Upgrade to Pro — share decks privately, control downloads, hide ads and more …

Seminario Twitter Dynamics

Paradigma
January 19, 2012

Seminario Twitter Dynamics

Seminario "Twitter Dynamics" del 19 de enero de 2012

Paradigma

January 19, 2012
Tweet

More Decks by Paradigma

Other Decks in Technology

Transcript

  1. ÍNDICE Introducción API Twitter Adquisición y persistencia de datos Conceptos

    básicos sobre grafos Visualización en Gephi y GraphStream Casos de uso
  2. INTRODUCCIÓN ¿Qué es twitter? Es una red social basada en

    microblogging Red social porque puedo elegir a quien seguir y que información crear o retransmitir. Microblogging porque solo puede postear un texto con un tamaño máximo de 140 carácteres.
  3. INTRODUCCIÓN Algunos números *** http://blog.twitter.com/2011/03/numbers.html 250 Millones de tweets enviados

    de media cada día (Octubre 2011) * 460.000 nuevas cuentas abiertas por día (de media en 2010) *** Incremento del 186 % de usuarios móviles en 2010 *** 100 Millones de usuarios activos estimados (Septiembre 2011) ** * http://techcrunch.com/2011/10/17/twitter-is-at-250-million-tweets-per-day/ ** http://techland.time.com/2011/09/09/twitter-reveals-active-user-number-how-many-actually-say-something/
  4. INTRODUCCIÓN Casos de estudio interesantes Predicción de valores de bolsa

    (Down Jones Industrial Average) correlacionado con análisis de sentiment de tweets (Bollen et al. 2011). En Achrekar et al. (2011) se muestra una alta correlación (en datos almacenados entre los años 2009 y 2010) entre el número de tweets relacionados con la gripe y el numero de casos reales. Una línea de investigación abierta por el DARPA llamada Topic Detection and Tracking research (1996).
  5. INTRODUCCIÓN Herramienta de acceso a todos los datos del ecosistema

    Twitter: Tweets, Retweets, Hashtags, Usuarios, ... etc Para empezar a experimentar, sólo necesitamos conocimientos básicos sobre HTTP y JSON
  6. INTRODUCCIÓN • REST API • Search API • Streaming API

    Consumo puntual de datos Búsquedas Consumo masivo de datos
  7. REST API • Tweets / retweets • Followers y Friends

    • Mensajes directos • Listas • ... Consulta y creación de:
  8. REST API • La API limita la frecuencia a la

    que podemos realizar peticiones • Algunos métodos requieren autenticación via OAuth => Límite va contra el usuario autenticado (350 requests/hora) • Otros pueden ser invocados anónimamente => Límite va contra la IP (150 requests/hora) ¿Cuanta información puedo obtener?
  9. API REST Algunos ejemplos sencillos Obtener listas en las que

    se ha incluído a un usuario Obtener la red de followers de un usuario
  10. REST API import requests import json import sys user_lists =

    [] max_pages = 5 next_cursor = -1 for i in range(0, max_pages): url = 'https://api.twitter.com/1/lists/memberships.json?screen_name=%s&cursor=%s' % (sys.argv[1], next_cursor) content = requests.get(url).content data = json.loads(content) next_cursor = data['next_cursor'] for list_data in data['lists']: name = list_data['name'] uri = list_data['uri'] description = list_data['description'] user_lists.append("%s (%s): %s" % (name, uri, description)) for l in user_lists: print l Limitamos páginas de resultados para evitar baneos Método lists/memberships Paginación listas en las que está un usuario
  11. REST API if __name__ == "__main__": # USER # obtain

    main user info main_user_name = sys.argv[1] main_user_info = obtain_users_info(screen_names=[main_user_name])[0] follower_network = { 'nodes' : {}, 'edges': [] } follower_network['nodes'][main_user_name] = main_user_info try: traverse_followers(main_user_name, follower_network, 1, MAX_RECURSION_LEVEL) except RateLimitReachedError as e: print "Ooops! we reached the rate limit!!! Follower Network will not be complete." except: print "Some error occurred!. We will go on with the current Follower Network!" generate_tsv(follower_network, main_user_name, 1) generate_dot(follower_network, main_user_name, 0) Hash donde almacenamos el grafo Ficheros de salida Red de followers de un usuario
  12. REST API def traverse_followers(user_name, follower_network, recursion_level, max_recursion_level): check_rate_limit() # retrieve

    up to MAX_IDS user followers: url = 'https://api.twitter.com/1/followers/ids.json?screen_name=%s&cursor=-1' % user_name content = client.get(url).content data = {} try: data = json.loads(content) except: print 'Error! rate limit?' return if 'error' in data: print 'Error: %s' % data['error'] return followers_ids = data['ids'][:MAX_IDS] #obtain info for each follower (in batches of 100) for i in range(0, len(followers_ids), 100): id_group = followers_ids[i:i+100] followers_info = obtain_users_info(ids = id_group) if followers_info is not None: for follower_info in followers_info: follower_name = follower_info['screen_name'] #add node info (if not exists yet) if follower_name not in follower_network['nodes']: follower_network['nodes'][follower_name] = follower_info #add edge follower_network['edges'].append((follower_name, user_name)) follower_network['nodes'][user_name]['indegree'] += 1 if recursion_level < max_recursion_level: traverse_followers(follower_name, follower_network, recursion_level+1, max_recursion_level) Obtener followers IDs
  13. REST API def obtain_users_info(ids = [], screen_names=[]): check_rate_limit() result =

    [] #transform ids into strings: ids = map(lambda x: str(x), ids) string_ids = ','.join(ids) screen_names = ','.join(screen_names) url = 'https://api.twitter.com/1/users/lookup.json?' if string_ids and screen_names: url += 'user_id=%s&screen_name=%s' % (string_ids, screen_names) elif string_ids: url += 'user_id=%s' % string_ids else: url += 'screen_name=%s' % screen_names print url content = client.get(url).content data = json.loads(content) if 'error' in data: print 'Error: %s' % data['error'] return for user_info in data: relevant_info = { 'screen_name' : user_info['screen_name'], 'profile_image_url': user_info['profile_image_url'], 'followers_count': user_info['followers_count'], 'indegree' : 0 } result.append(relevant_info) return result Obtener info detallada de cada follower
  14. REST API En el ejemplo almacenamos un hash en memoria

    con toda la información de la red Persistimos estos datos en el formato más conveniente para luego visualizarlos: JSON, grafo .DOT, documento en MongoDB ...etc. Ejemplo “de juguete”: una aplicación real requiere un diseño más elaborado: cache de llamadas, manejo de errores, balanceo de IPs/usuarios...
  15. SEARCH API Búsqueda de tweets recientes por palabras clave, nombres

    de usuario, hashtags... Lenguaje de queries básico con operadores #dataviz OR #visualization: http://search.twitter.com/search.json?q=%23dataviz%20OR %20%23visualization&rpp=100&page=1 ¿Para qué sirve?
  16. STREAMING API • Para un consumo masivo de datos, REST

    API no es suficiente • Streaming API es un "chorro" (firehose) de información, cercana al tiempo real, que normalmente filtraremos por algún criterio (hashtag, usuario...) • Si no filtramos, no obtendremos el 100% del stream de Twitter sino un muestreo del 1% aprox. (es posible obtener más información estableciendo acuerdos con Twitter) ¿Por qué Streaming?
  17. STREAMING API curl -d "track=SOPA" https://stream.twitter.com/1/statuses/filter.json -u[USER]:[PASSWD] • Abrir una

    conexión con autenticación y mantenerla abierta. • Procesar el flujo de datos recibido Ejemplo simple: ¿Cómo usarla?
  18. RADIOGRAFÍA DE UN TWEET { "possibly_sensitive": false, "in_reply_to_screen_name": null, "text":

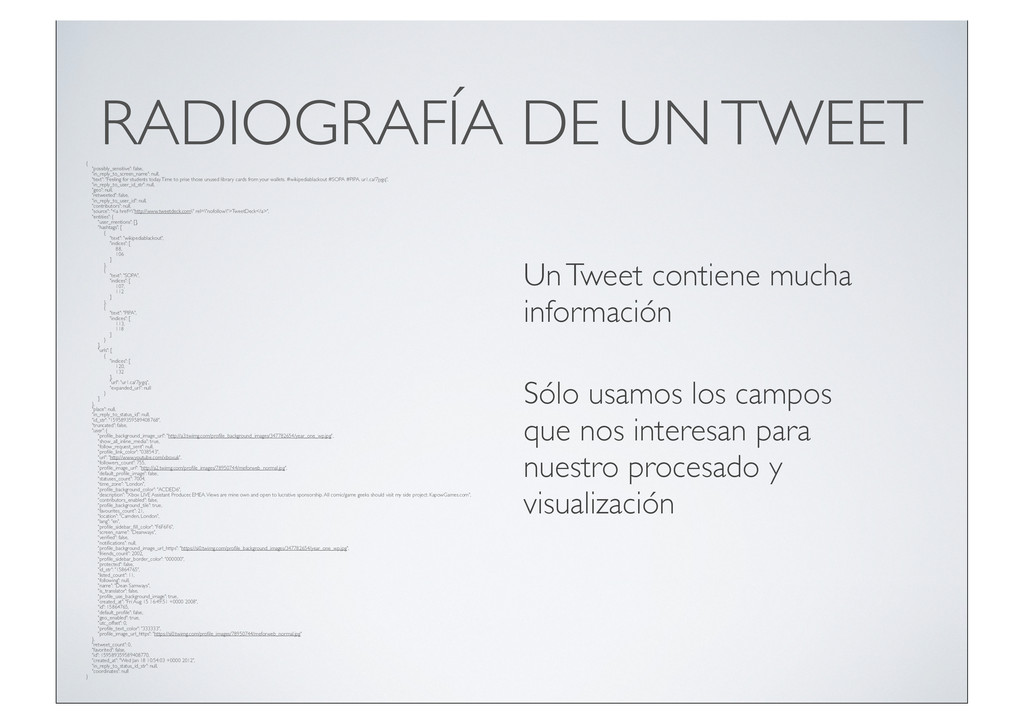
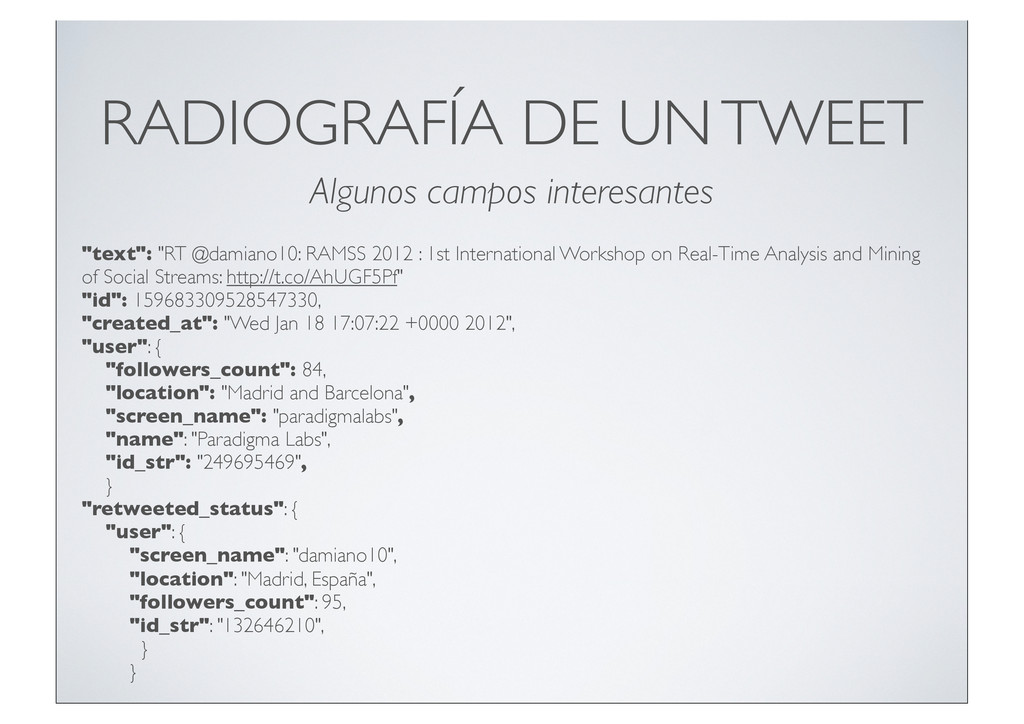
    "Feeling for students today. Time to prise those unused library cards from your wallets. #wikipediablackout #SOPA #PIPA. ur1.ca/7jygq", "in_reply_to_user_id_str": null, "geo": null, "retweeted": false, "in_reply_to_user_id": null, "contributors": null, "source": "<a href=\"http://www.tweetdeck.com\" rel=\"nofollow\">TweetDeck</a>", "entities": { "user_mentions": [], "hashtags": [ { "text": "wikipediablackout", "indices": [ 88, 106 ] }, { "text": "SOPA", "indices": [ 107, 112 ] }, { "text": "PIPA", "indices": [ 113, 118 ] } ], "urls": [ { "indices": [ 120, 132 ], "url": "ur1.ca/7jygq", "expanded_url": null } ] }, "place": null, "in_reply_to_status_id": null, "id_str": "159589359589408768", "truncated": false, "user": { "profile_background_image_url": "http://a3.twimg.com/profile_background_images/347782654/year_one_wp.jpg", "show_all_inline_media": true, "follow_request_sent": null, "profile_link_color": "038543", "url": "http://www.youtube.com/xboxuk", "followers_count": 755, "profile_image_url": "http://a2.twimg.com/profile_images/78950744/meforweb_normal.jpg", "default_profile_image": false, "statuses_count": 7004, "time_zone": "London", "profile_background_color": "ACDED6", "description": "Xbox LIVE Assistant Producer, EMEA. Views are mine own and open to lucrative sponsorship. All comic/game geeks should visit my side project: KapowGames.com", "contributors_enabled": false, "profile_background_tile": true, "favourites_count": 21, "location": "Camden, London", "lang": "en", "profile_sidebar_fill_color": "F6F6F6", "screen_name": "Deanways", "verified": false, "notifications": null, "profile_background_image_url_https": "https://si0.twimg.com/profile_background_images/347782654/year_one_wp.jpg", "friends_count": 2002, "profile_sidebar_border_color": "000000", "protected": false, "id_str": "15864765", "listed_count": 11, "following": null, "name": "Dean Samways", "is_translator": false, "profile_use_background_image": true, "created_at": "Fri Aug 15 16:49:51 +0000 2008", "id": 15864765, "default_profile": false, "geo_enabled": true, "utc_offset": 0, "profile_text_color": "333333", "profile_image_url_https": "https://si0.twimg.com/profile_images/78950744/meforweb_normal.jpg" }, "retweet_count": 0, "favorited": false, "id": 159589359589408770, "created_at": "Wed Jan 18 10:54:03 +0000 2012", "in_reply_to_status_id_str": null, "coordinates": null } Un Tweet contiene mucha información Sólo usamos los campos que nos interesan para nuestro procesado y visualización
  19. RADIOGRAFÍA DE UN TWEET "text": "RT @damiano10: RAMSS 2012 :

    1st International Workshop on Real-Time Analysis and Mining of Social Streams: http://t.co/AhUGF5Pf" "id": 159683309528547330, "created_at": "Wed Jan 18 17:07:22 +0000 2012", "user": { "followers_count": 84, "location": "Madrid and Barcelona", "screen_name": "paradigmalabs", "name": "Paradigma Labs", "id_str": "249695469", } "retweeted_status": { "user": { "screen_name": "damiano10", "location": "Madrid, España", "followers_count": 95, "id_str": "132646210", } } Algunos campos interesantes
  20. ADQUISICIÓN Hemos visto ejemplos “de juguete” Casos de Uso reales

    Cuando se necesita una adquisición a mayor escala, se incrementa la complejidad y se requiere una infraestructura mayor Actualmente tenemos una arquitectura de adquisición en Twitter con 20 servidores dedicados
  21. API DE TWITTER Para profundizar... Mining the Social Web Matthew

    A. Russel 21 Recipes for Mining Twitter Matthew A. Russel
  22. PERSISTENCIA DE DATOS Dónde Paradigma noSQL con MongoDB y Spring

    Data http://www.parleys.com/#st=5&id=2737 Leonardo Menezes y Miguel Olivares from pymongo import Connection import requests import json # Database configuration port = 0000 conn = Connection(’host’, port) db = conn.twitter coll = db.trends url = ’https://api.twitter.com/1/trends/1.json’ content = requests.get(url).content data = json.loads(content) for tt in data[0][’trends’]: coll.save(tt)
  23. PROCESADO DE DATOS Cómo from pymongo import Connection import datetime

    # Database configuration port = 0000 conn = Connection(’host’, port) db = conn.twitter coll = db.nolesvotes # Date range start = datetime.datetime(2011, 5, 16, 0, 0, 0) end = datetime.datetime(2011, 5, 16, 23, 59, 59) condition = {’created_at’: {’$gte’: start, ’$lt’:end}} for item in coll.find(condition).sort([("created_at", True)]): # Do something print item
  24. PERSISTENCIA DE DATOS #libya Conflicto en Libia: Febrero 2011, 200.000

    tweets #nolesvotes Revolución en España: Abril-Agosto 2011, 800.000 tweets #ows + #15oct Revolución Global: Octubre 2011, 6 Millones de tweets #20n Generales en España, Noviembre 2011, 4 Millones de tweets #christmas Estudio emocional sobre la Navidad: Diciembre 2011, 10 Millones de tweets #sopa Ley Sopa y Sinde, Enero 2012, 500.000 tweets hasta la fecha Algunos números de casos reales
  25. CONCEPTOS Modelar una red A = {{u1, u2 }, {u1,

    u3 }, {u2, u3 }, {u4, u2 }, {u4, u5 }, {u5, u2 }, {u5, u4 }} V = {u1, u2, u3, u4, u5 }
  26. CONCEPTOS Medir en una red Ma = 2 6 6

    6 6 4 0 1 1 0 0 0 0 1 0 0 0 0 0 0 0 0 1 0 0 1 0 1 0 1 0 3 7 7 7 7 5 In(i) = n X c=0 Ma[i, c] Out(i) = n X f=0 Ma[f, i]
  27. CONCEPTOS no solo Indegree y Outdegree ... http://networkx.lanl.gov/ Algorithms •

    Bipartite • Centrality • Chordal • Clique • Clustering • Communities • Components • Cores • Cycles • Directed Acyclic Graphs • Distance Measures • Distance-Regular Graphs • Eulerian • Flows • Graphical degree sequence • Isolates • Isomorphism • Link Analysis • Minimum Spanning Tree • Products • Shortest Paths
  28. GEPHI • Herramienta interactiva de visualización y exploración de redes

    y grafos hecha en JAVA • Es Open Source y multiplataforma • “Photoshop for Data”
  29. GEPHI • Facilita el trabajo de Análisis de datos con:

    • Layouts predefinidos y configurables • Cálculo de métricas sobre redes • Filtrado de nodos en base a atributos • Clustering • “Data Laboratory” • Plug-ins
  30. GEPHI • Vamos a visualizar la red de followers que

    generamos en el ejemplo anterior (REST API) • Para ello se persistieron los datos en un formato entendible por Gephi (en este caso .DOT) Ejemplo de Uso
  31. VISUALIZACIÓN GRAPHSTREAM ¿Qué es Graph Stream? Es una librería en

    JAVA para el manejo de grafos dinámicos y estáticos. Hospedado en la Universidad de Le Havre. Mantenida por miembros del grupo de investigación RI2C . Tres librerias: Core, Algo y UI.
  32. VISUALIZACIÓN GRAPHSTREAM Caracteristicas importantes Podemos configurar “el aspecto” de los

    grafos de la misma manera que un CSS puede modificar el aspecto de un HTML.
  33. VISUALIZACIÓN GRAPHSTREAM Caracteristicas importantes Podemos configurar “el aspecto” de los

    grafos de la misma manera que un CSS puede modificar el aspecto de un HTML. graph.addAttribute("ui.stylesheet",  "graph  {  fill-­‐color:  red;  }"); node.addAttribute("ui.style",  "fill-­‐color:  rgb(0,100,255);"); graph  {        fill-­‐color:  red; } node  {        size:  10px,  15px;        shape:  box;        fill-­‐color:  green;        stroke-­‐mode:  plain;        stroke-­‐color:  yellow; }
  34. VISUALIZACIÓN GRAPHSTREAM Caracteristicas importantes Podemos crear un video a partir

    de la generación de imagenes del grafo. OutputPolicy outputPolicy = OutputPolicy.BY_ELEMENT_EVENT; OutputType type = OutputType.JPG; Resolution resolution = Resolutions.HD720; // Start output images FileSinkImages fsi = new FileSinkImages( "/tmp/img", type, resolution, outputPolicy); fsi.setRenderer(RendererType.SCALA); fsi.setLayoutPolicy( LayoutPolicy.COMPUTED_IN_LAYOUT_RUNNER ); // Set quality output fsi.setQuality(Quality.HIGH); fsi.setStyleSheet("graph { padding: 50px; fill-color: black; }"); // Link output with graph g.addSink(fsi);
  35. VISUALIZACIÓN GRAPHSTREAM Algunos ejemplos Visualizar los followers de un usuario.

    Visualizar los followers de un usuario y mostrar este numero implícito en el tamaño del nodo Visualizar los followers de un usuario y mostrar este numero implícito en el tamaño del nodo y añadir las imagenes de los usuarios.
  36. VISUALIZACIÓN GRAPHSTREAM Algunos ejemplos Visualizar los followers de un usuario

    y mostrar este numero implícito en el tamaño del nodo
  37. VISUALIZACIÓN GRAPHSTREAM Algunos ejemplos Visualizar los followers de un usuario

    y mostrar este numero implícito en el tamaño del nodo y añadir las imagenes de los usuarios.
  38. VISUALIZACIÓN GRAPHSTREAM Código // Create graph Graph g = new

    DefaultGraph("g"); // Display in real time console g.display(true); // Set some quality params g.addAttribute("ui.antialias"); g.addAttribute("ui.quality"); g.addAttribute("ui.stylesheet", "graph { fill-color: black; }");
  39. VISUALIZACIÓN GRAPHSTREAM Código public static void addNode(Graph g, String nodeLabel,

    double size, String url){ if (g.getNode(nodeLabel) == null){ if (size < 0.0) size = 1.0; g.addNode(nodeLabel); Node n = g.getNode(nodeLabel); size = size * 2.0; System.out.println("=> "+size); String shape = "rounded-box"; if (size > 20.0) shape = "cross"; n.addAttribute("ui.style" , String.format("size: %spx, %spx; fill-color: #3d5689; shape: %s; text-size: %s; stroke-mode: plain; stroke-color: yellow; text-color:white;",20, 20, "circle", size/2)); n.setAttribute("label",nodeLabel); } }
  40. VISUALIZACIÓN GRAPHSTREAM Código public static void addEdge(Graph g, String from,

    String to, double weight){ if (g.getNode(from) != null && g.getNode(to) != null && g.getEdge(from+to) == null && g.getEdge(to+from) == null){ g.addEdge(from+to, from, to, true); Edge e = g.getEdge(from+to); if (weight < 0.0) weight = 1.0; e.addAttribute("ui.style" , String.format("fill-color: #3d5689; size: %s;", weight)); } }
  41. VISUALIZACIÓN GRAPHSTREAM Código public static void changeNode(Graph g, String nodeLabel,

    double size){ if (g.getNode(nodeLabel) != null){ if (size < 0.0) size = 2.0; Node n = g.getNode(nodeLabel); String shape = "rounded-box"; if (size > 20.0){ shape = "cross"; } n.addAttribute("ui.stylesheet" , String.format("size: %spx, %spx;shape: %s; text-size: %s; ", size, size, shape, size/2)); } }
  42. CASO DE USO 1 Identificación de influenciadores en una red

    from pymongo import Connection import datetime # Database configuration conn = Connection(‘host’, 000000) db = conn.twitter coll = db.nolesvotes # Search conditions start = datetime.datetime(2011, 5, 16, 18, 0, 0) end = datetime.datetime(2011, 5, 16, 18, 59, 59) cond = {’retweeted_status’: {’$exists’: True} , ’created_at’: {’$gte’: start, ’$lt’:end}} # Variable to save the network structure network = ’’ # Perform search for item in coll.find(cond).sort([("created_at", True)]): network += ’\t%s -> %s\n’ % (item[’user’][’screen_name’] , item[’retweeted_status’][’user’][’screen_name’]) # Save data into a file file_out = file(’/tmp/retweet_network.dot’ , ’w’) file_out.write(’digraph G{\n%s}’ % network) file_out.close()
  43. CASO DE USO II Agrupando hashtags con MI* rt @coriano2323:

    acampadabcn - plaça catalunya, http://bit.ly/ikkkaa #acampadasol #spanishrevolution #15mani #nolesvotes rt @ximicomix: rt @lexdubia rt @ma 20:00 en sol. convocatoria ciudadana. pasalo. #acampadasol #spanishrevolution #nolesvotes rt @megasuavi: comunicación horizontal usar #meneame para difundir todo sobre #acampadasol y #nolesvotes adio a los grandes rt @abelokeponemos: un apoyo a todos los que han llevado la #spanishrevolution con muchisimo ánimo! (: recordad... #nolesvotes {#acampadasol, #spanishrevolution, #15mani, #nolesvotes, #meneame} Mi = 2 6 6 6 6 4 0 3.66 2.41 6 2.41 3.66 0 2.41 6 0 2.41 2.41 0 2 0 6 6 2 0 2 2.41 0 0 2 0 3 7 7 7 7 5 F = {3, 3, 1, 4, 1} *(Chart K. et all 1998) I(X; Y ) = X x 2 X X y 2 Y p(x, y) ⇤ log ✓ p(x, y) p(x)p(y) ◆
  44. estamos investigando/desarrollando ... Estudio de las distintas topologias de red

    y su dinámicas en el tiempo Métricas para la detección de influenciadores por dominio Detección de emergencia con Fuzzy hashtags ... como visualizar todo esto?
  45. estamos investigando/desarrollando ... ... como visualizar todo esto? Smart Offices:

    Internet de las cosas aplicadas a crear el ambiente óptimo de trabajo utilizando Arduino TwitterMaps. Mapa interactivo para entender twitter día a día con Processing API pública de análisis de texto: NER, contexto basado en grafo semántico de Wikipedia y Sentiment Analysis. Desarrollo de herramientas enfocadas al periodismo de datos
  46. Harshavardhan Achrekar, Ross Lazarus, and West Cummings Park. Predicting Flu

    Trends using Twitter Data. Architecture, pages 702–707, 2011. Ron Bekkerman and Koby Crammer. One-class clustering in the text domain. Proceedings of the Conference on Empirical Methods in Natural Language Processing - EMNLP ’08, page 41, 2008. doi: 10.3115/1613715.1613722. URL http://portal.acm.org/citation.cfm? doid=1613715.1613722. Johan Bollen, Huina Mao, and Xiao-jun Zeng. Twitter mood predicts the stock market. Journal of Computational Science, pages 1–8, 2011. URL http://www.sciencedirect.com/science/article/ pii/S187775031100007X. B Bollobás. Modern Graph Theory, volume 184 of Graduate Texts in Mathematics. Springer, 1998. ISBN 0387984887. doi: 10.1234/12345678. URL http://www.springer.com/math/numbers/book/ 978-0-387-98488-9. Francine Chen, Ayman Farahat, and Thorsten Brants. Multiple similarity measures and source-pair in- formation in story link detection. In Proceedings of the 2nd Human Language Technology Conference of the North American Chapter of the Association for Computational Linguistics, Boston, MA, USA, pages 313–320, 2004. URL http:// acl.ldc.upenn.edu/hlt-naacl2004/main/pdf/18_Paper.pdf. Thomas M J Fruchterman and Edward M Reingold. Graph drawing by force-directed placement. Soft- ware Practice and Experience, 21(11):1129–1164, 1991. ISSN 00380644. doi: 10.1002/spe.4380211102. URL http://doi.wiley.com/ 10.1002/spe.4380211102. Bruce Hendrickson and Robert Leland. A multilevel algorithm for partitioning graphs. In Proceedings of the 1995 ACM/IEEE conference on Supercomputing (CDROM), page 28. ACM, 1995. URL http://dl.acm.org/citation.cfm? id=224228. REFERENCIAS
  47. Yoshihiro Kawano, Yoshito Kishimoto, and Tatsuhiro Yonekura. A Prototype of

    Attention Simulator on Twitter. 2011 14th International Conference on Network-Based Information Systems, pages 173– 177, September 2011. doi: 10.1109/NBiS.2011.51. URL http://ieeexplore.ieee.org/lpdocs/ epic03/wrapper.htm?arnumber=6041919. Stephen G Kobourov. Force-Directed Drawing Algorithms. University of Arizona, 2004. ISBN 0849385970. Eldar Sadikov and M.M.M. Martinez. Information Propagation on Twitter. CS322 Project Report, 2009. URL http:// snap.stanford.edu/class/cs224w-2010/proj2009/TwitterWriteup_Sadikov.pdf. Maksim Tsvetovat and Alexander Kouznetsov. Social Network Analysis for Startups. Oreilly & Associates Inc, 2011. ISBN 9781449306465. URL http://books.google.com/books?hl=en&amp; lr=&amp;id=Tn- L5WoCeygC&amp;oi=fnd&amp;pg=PR3&amp;dq=Social+Network+Analysis+for+ Startups&amp;ots=SS7Zs6D9wb&amp;sig=A0oZKZ_bBlXNnSjyZmf3vI6HAkM. Zhiheng Xu, Long Ru, Liang Xiang, and Qing Yang. Discovering User Interest on Twitter with a Mod- ified Author- Topic Model. 2011 IEEE/WIC/ACM International Conferences on Web Intelligence and Intelligent Agent Technology, pages 422–429, August 2011. doi: 10.1109/WI-IAT.2011.47. URL http://ieeexplore.ieee.org/lpdocs/epic03/ wrapper.htm?arnumber=6040707. Yuto Yamaguchi, Toshiyuki Amagasa, and Hiroyuki Kitagawa. Tag-based User Topic Discovery Using Twitter Lists. 2011 International Conference on Advances in Social Networks Analysis and Mining, pages 13–20, July 2011. doi: 10.1109/ASONAM.2011.58. URL http://ieeexplore.ieee.org/ lpdocs/epic03/wrapper.htm?arnumber=5992580. Hua Zhao. Applying Dynamic Co-occurrence in Story Link Detection. Journal of Computing and Information Technology, pages 157–164, 2009. ISSN 1330-1136. doi: 10.2498/cit.1001104. URL http://cit.zesoi.fer.hr/ browsePaper.php?paper=1104. REFERENCIAS
  48. Liyong Zhao, Chongchong Zhao, Jingqin Pang, and Jianyi Huang. Sensitive

    Topic Detection Model Based on Collaboration of Dynamic Case Knowledge Base. 2011 IEEE 20th International Workshops on Enabling Technologies: Infrastructure for Collaborative Enterprises, pages 156–161, June 2011. doi: 10.1109/WETICE. 2011.29. URL http://ieeexplore.ieee.org/lpdocs/epic03/wrapper. htm?arnumber=5990044. REFERENCIAS