Upgrade to Pro — share decks privately, control downloads, hide ads and more …

Observability 101

pigol
March 21, 2021

Observability 101

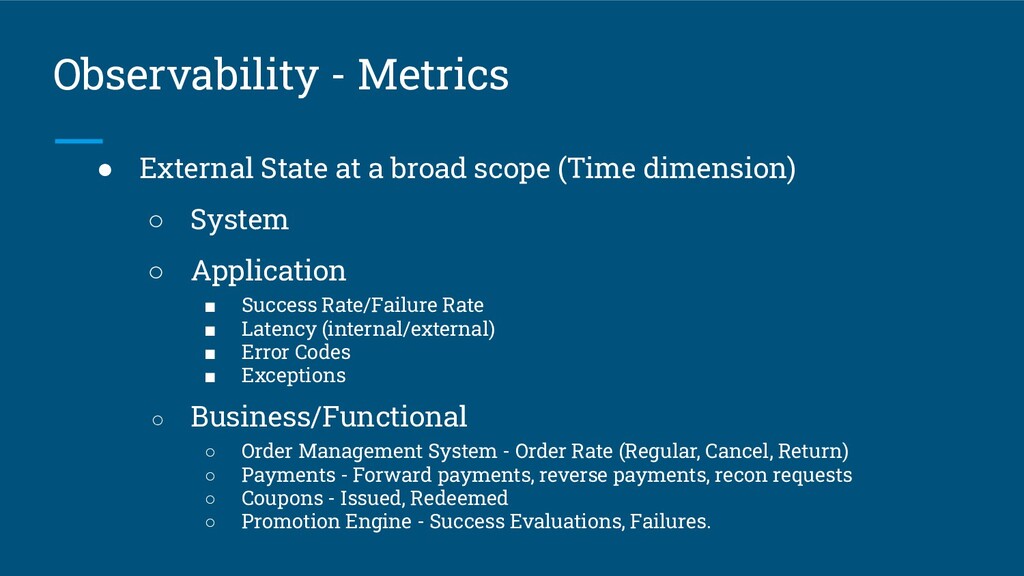
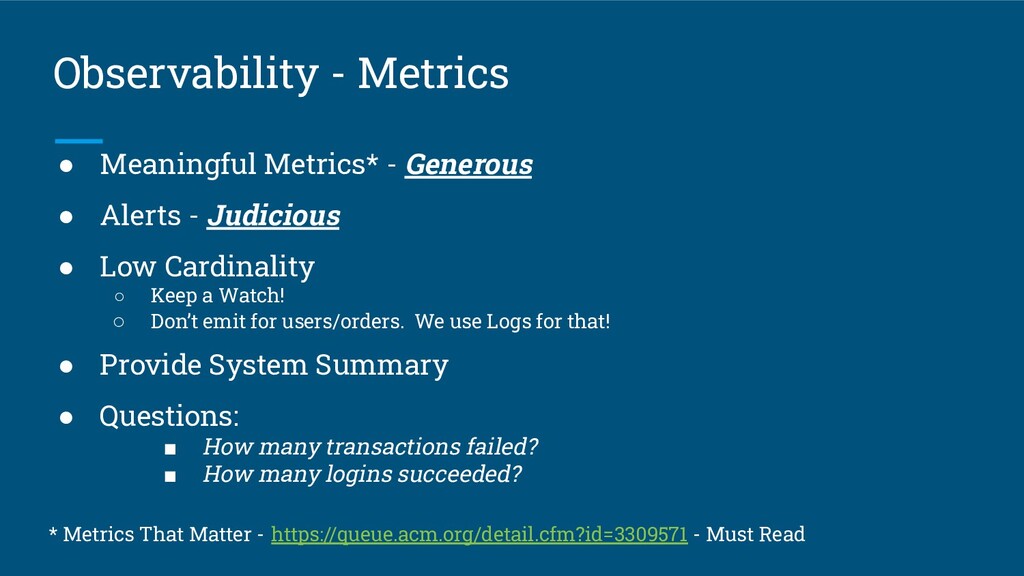
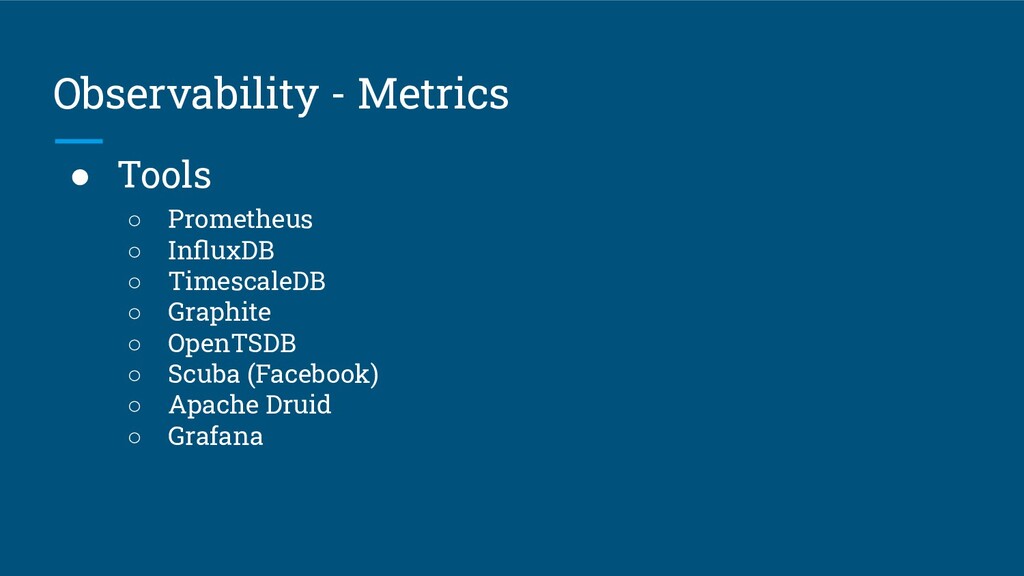
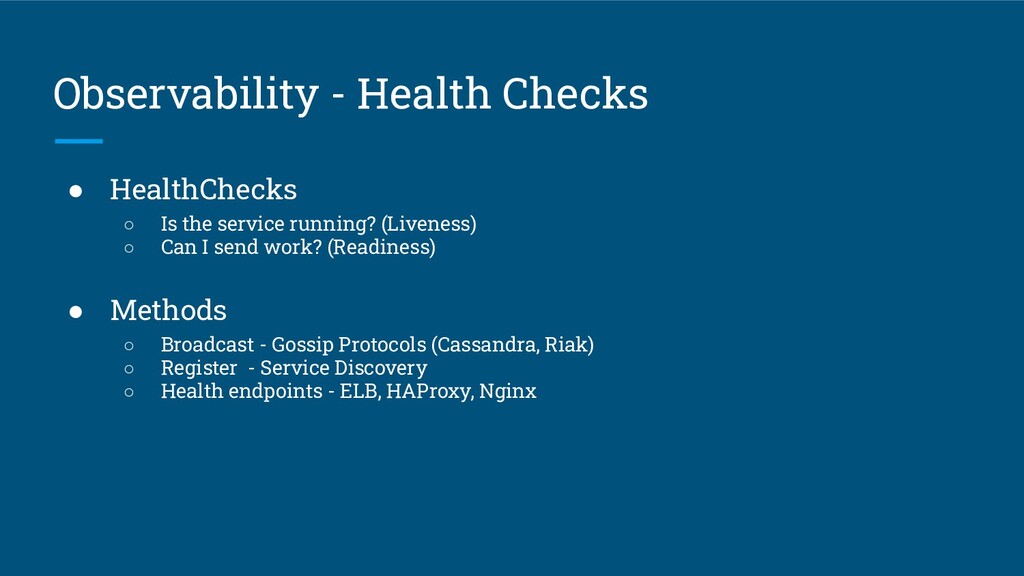
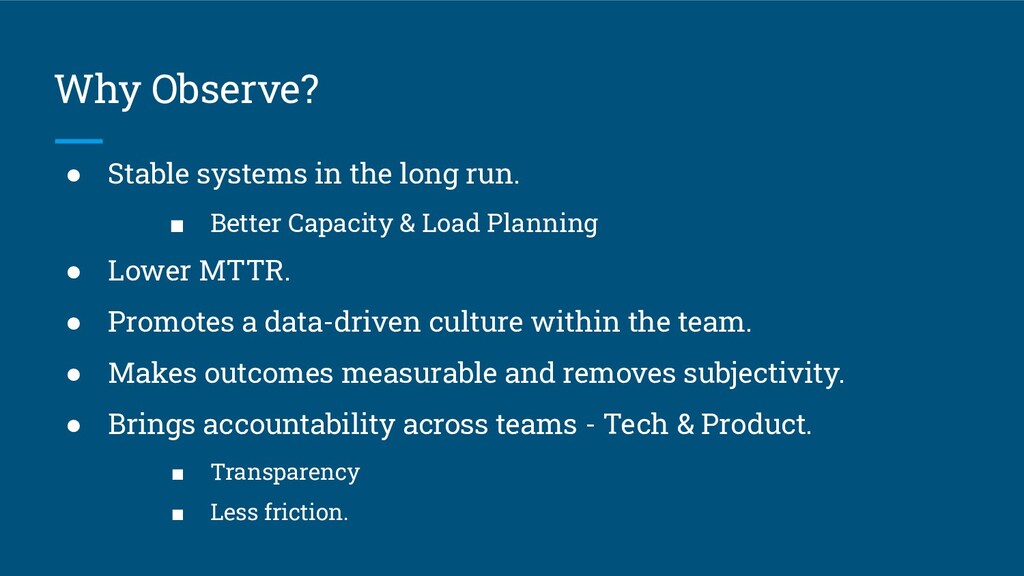
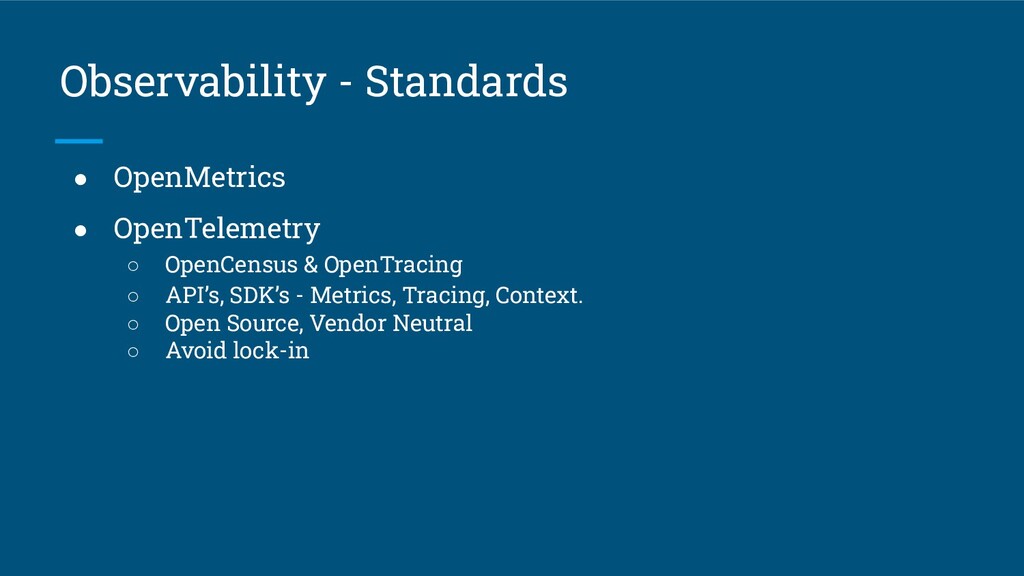
The talk was given at the Bangalore Observability meet-up on March, 13th. Covers the basics of observability relevant for beginners, and intermediate level practitioners of Observability. Also, covers some of the recent trends on Data observability, and monitoring.

pigol

March 21, 2021
Tweet

More Decks by pigol

Other Decks in Programming

Transcript

  1. Release to Production is just the beginning! “40% to 90%

    of the total costs of software are incurred after launch.” • Facts and Fallacies of Software Engineering, Glass R (2002), Addison-Wesley, p-115 • Which Factors affect Software Projects maintenance costs more? Acta Informatica Medica
  2. What to monitor? Let’s take an example: HTTP REST API’s

    • API Latency (95th percentile, Avg, 99th percentile) • CPU, Load Avg • Memory • Swap • JMX Heap Size (Assuming Java implementation) • HTTP Error Codes (200, 400, 300) • Exceptions • External API call Latencies • … • And more…….
  3. What to monitor? Let’s take an example: HTTP REST API’s

    • API Latency (95th percentile, Avg, 99th percentile) • CPU, Load Avg • Memory • Swap • JMX Heap Size • HTTP Error Codes (200, 400, 300) • Exceptions • External API call Latencies • And more……. X Servers X Clusters
  4. What to monitor? Let’s take an example: HTTP REST API’s

    • API Latency (95th percentile, Avg, 99th percentile) • CPU, Load Avg • Memory • Swap • JMX Heap Size • HTTP Error Codes (200, 400, 300) • Exceptions • External API call Latencies • And more……. X Servers X Clusters
  5. Monitoring • Capturing the state of the system to determine

    its health. ◦ HealthChecks ▪ Is the service running? ▪ Can I send work? ◦ Metrics ▪ System, Application, Functional • Alerts ◦ Anomalous behaviors - How do you define an anomaly?
  6. Monitoring • Alerts - Known Failures ◦ Knowledge Based ◦

    Reactive (post-outages) What about the unknown failures?
  7. Observability • https://theagileadmin.com/2018/02/16/monitoring-and-observability/ Observability is a measure of how well

    the internal states of a system can be inferred from knowledge of its external outputs. Analogous to medical diagnosis.
  8. Observability - Internal States • Context Specific ◦ Web Servers

    ▪ Availability ▪ Incoming Request Rate ▪ Latency ▪ HTTP Failures ◦ Application Services ▪ Success Rate ▪ Functionalities ◦ Message Queue ▪ Queue Length ▪ Consumer/Producer Count Needs Instrumentation! While writing code
  9. Observability - Metrics • External State at a broad scope

    (Time dimension) ◦ System ◦ Application ▪ Success Rate/Failure Rate ▪ Latency (internal/external) ▪ Error Codes ▪ Exceptions ◦ Business/Functional ◦ Order Management System - Order Rate (Regular, Cancel, Return) ◦ Payments - Forward payments, reverse payments, recon requests ◦ Coupons - Issued, Redeemed ◦ Promotion Engine - Success Evaluations, Failures.
  10. Observability - Metrics • Meaningful Metrics* - Generous • Alerts

    - Judicious • Low Cardinality ◦ Keep a Watch! ◦ Don’t emit for users/orders. We use Logs for that! • Provide System Summary • Questions: ▪ How many transactions failed? ▪ How many logins succeeded? * Metrics That Matter - https://queue.acm.org/detail.cfm?id=3309571 - Must Read
  11. Observability - Metrics • Tools ◦ Prometheus ◦ InfluxDB ◦

    TimescaleDB ◦ Graphite ◦ OpenTSDB ◦ Scuba (Facebook) ◦ Apache Druid ◦ Grafana
  12. Observability - Health Checks • HealthChecks ◦ Is the service

    running? (Liveness) ◦ Can I send work? (Readiness) • Methods ◦ Broadcast - Gossip Protocols (Cassandra, Riak) ◦ Register - Service Discovery ◦ Health endpoints - ELB, HAProxy, Nginx
  13. Observability - Logging • Understanding at a smaller scope ◦

    Request, customer, transaction • Ask Questions ◦ Why couldn’t the customer place an order? ◦ Why did the transaction fail? • Centralised - Log Collection, Aggregation • Searchable - Indexing • Correlatable - Common Key (Request Id) • Tools - ELK, EFK, Splunk, SumoLogic, Loki
  14. Observability - Tracing • Dissect a request into sub-paths. (Spans)

    • Profile system usage at a span level. • Extract Insights Tools: • Google Dapper (https://ai.google/research/pubs/pub36356) • Twitter Zipkin (https://zipkin.io/) • Open Jaeger (https://www.jaegertracing.io/) • New Relic
  15. Service Level Objectives (SLO) * https://landing.google.com/sre/sre-book/chapters/service-level-objectives/ * https://www.youtube.com/watch?v=tEylFyxbDLE • Defines

    a Quantifiable Goal for a service. • Measure the goal - Represents the User Experience/Delight Factor. • First step before writing a new service. Work backwards • Have as few SLO’s as possible. ◦ Represents the system behaviour.
  16. Service Level Objectives (SLO) - Exercise • Cart Service •

    Authentication & Authorization Service • Communication Engine (SMS, Email, Push Notifications)
  17. Why Observe? • Stable systems in the long run. ▪

    Better Capacity & Load Planning • Lower MTTR. • Promotes a data-driven culture within the team. • Makes outcomes measurable and removes subjectivity. • Brings accountability across teams - Tech & Product. ▪ Transparency ▪ Less friction.
  18. Observability - Standards • OpenMetrics • OpenTelemetry ◦ OpenCensus &

    OpenTracing ◦ API’s, SDK’s - Metrics, Tracing, Context. ◦ Open Source, Vendor Neutral ◦ Avoid lock-in
  19. Observability - Recent Trends • Data Observability ◦ Freshness ◦

    Volume ◦ Schema ◦ Distribution ◦ Lineage • AccelData, MonteCarlo, Soda * https://www.montecarlodata.com/what-is-data-observability/ * https://cloudedjudgement.substack.com/p/data-observability-the-next-monitoring
  20. References • Debugging Production Systems • Pierre Vincent - How

    to build observable Distributed systems? • Charity Majors - Observability for Emerging Infra: What Got You Here Won't Get You There" • Caitee McAfree - Of the Order of Billions: Building Observability at Twitter • https://eng.uber.com/observability-at-scale/ • OpenTelemetry • OpenMetrics • Monitoring and Observability