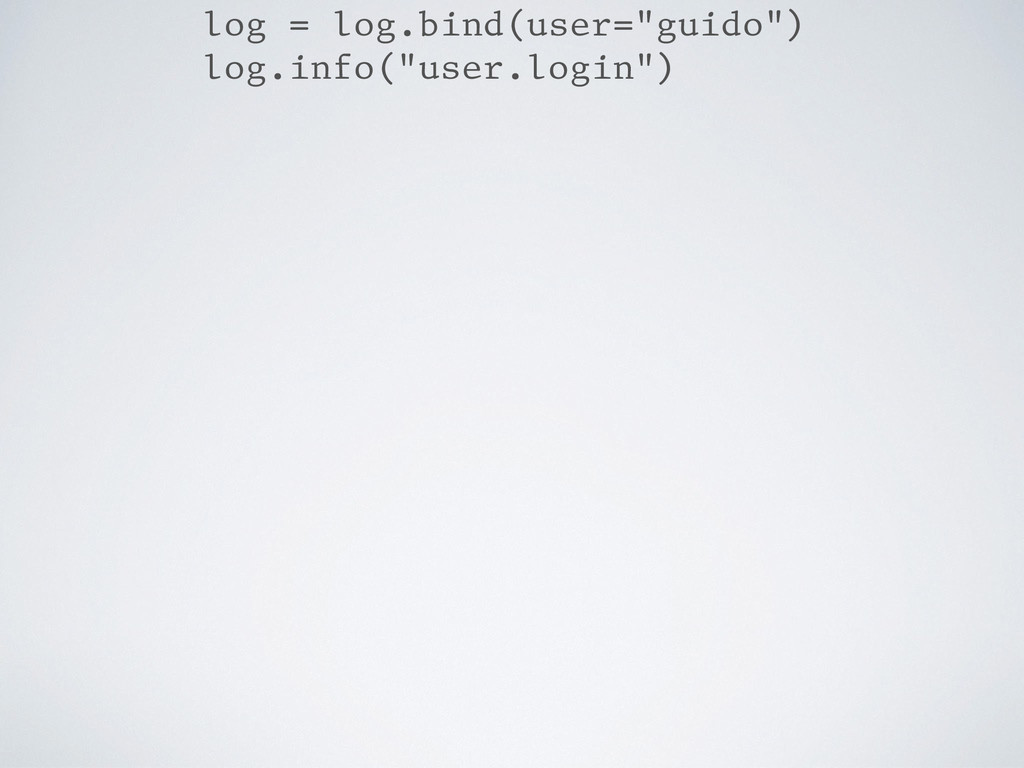
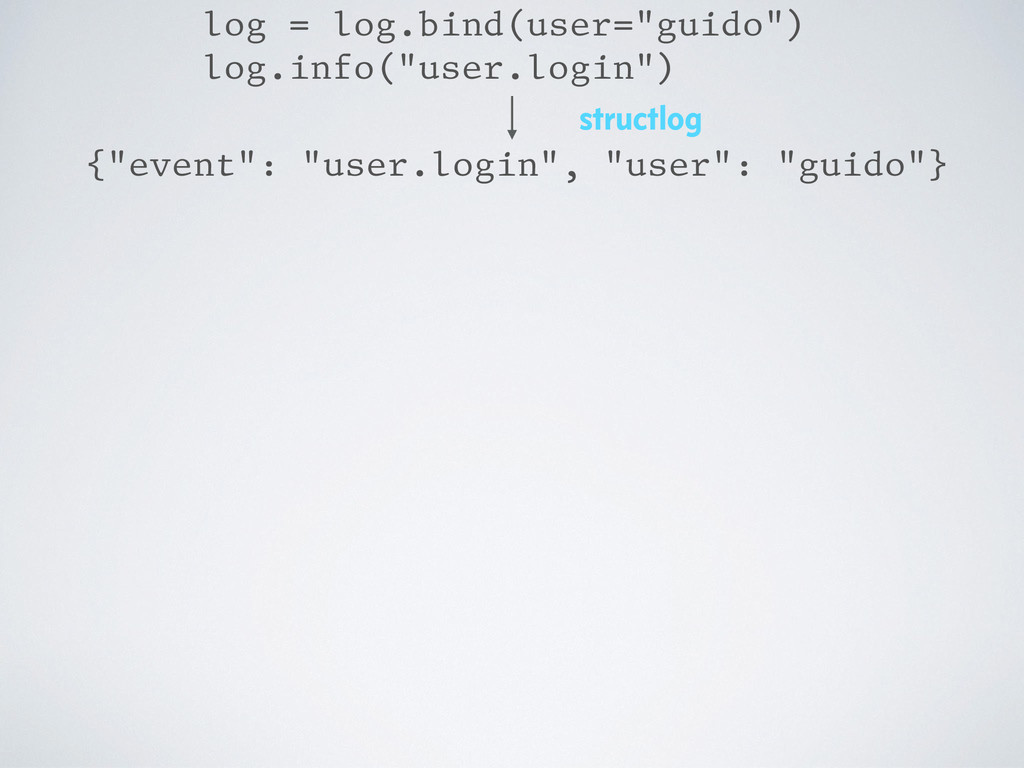
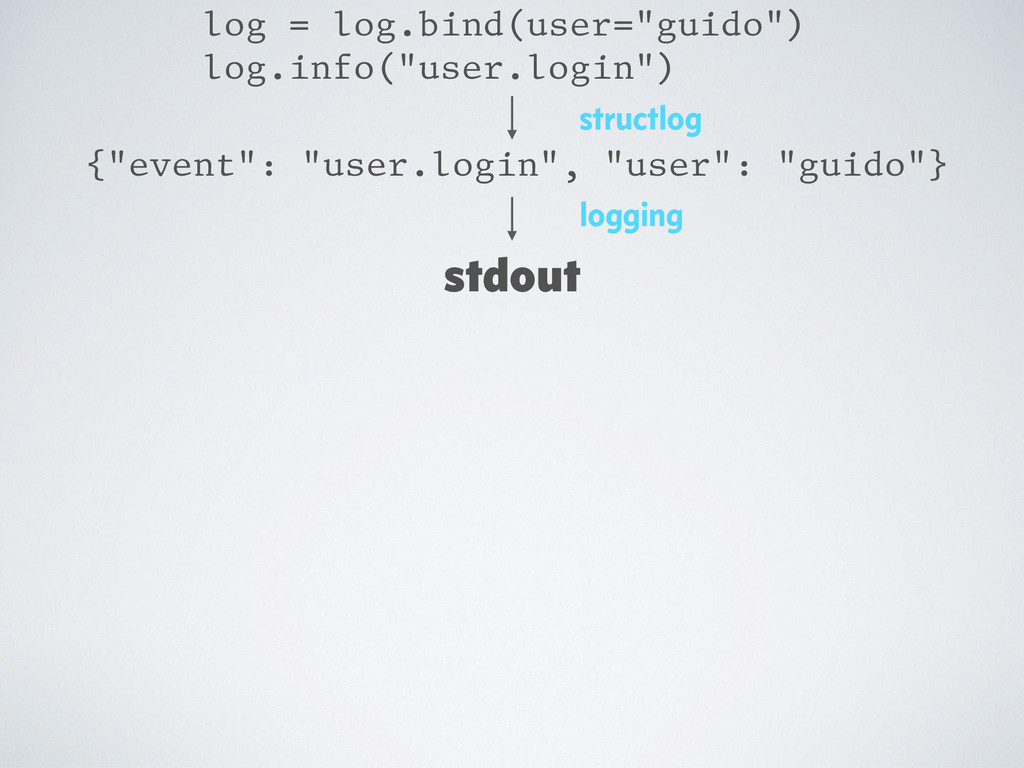
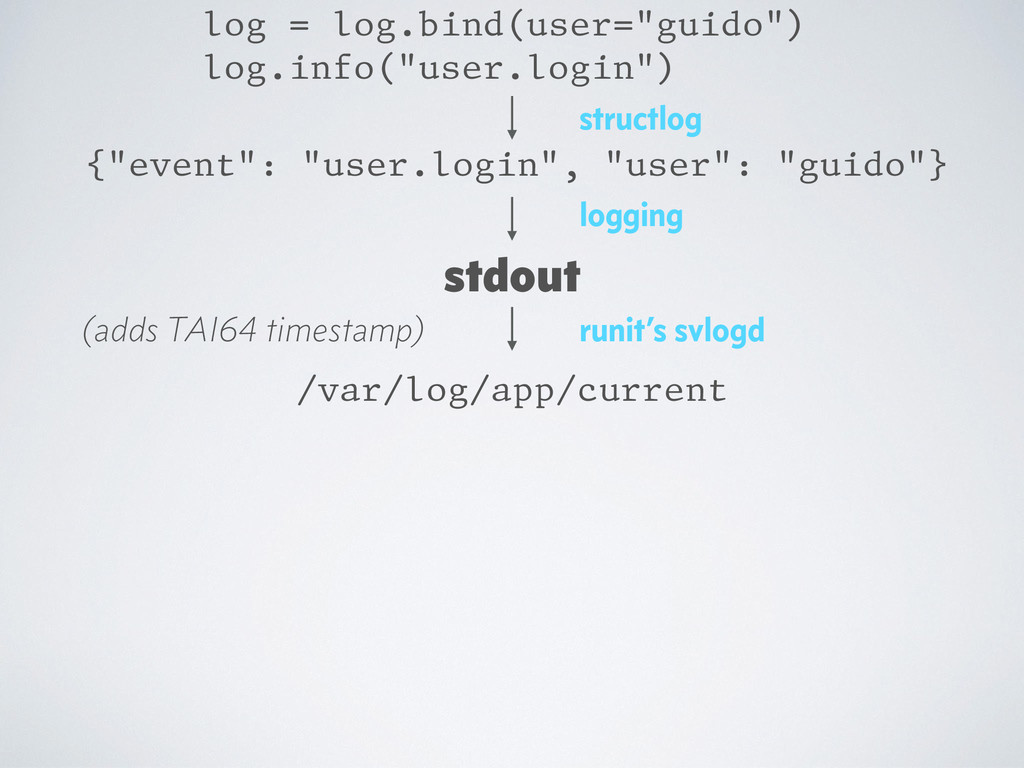
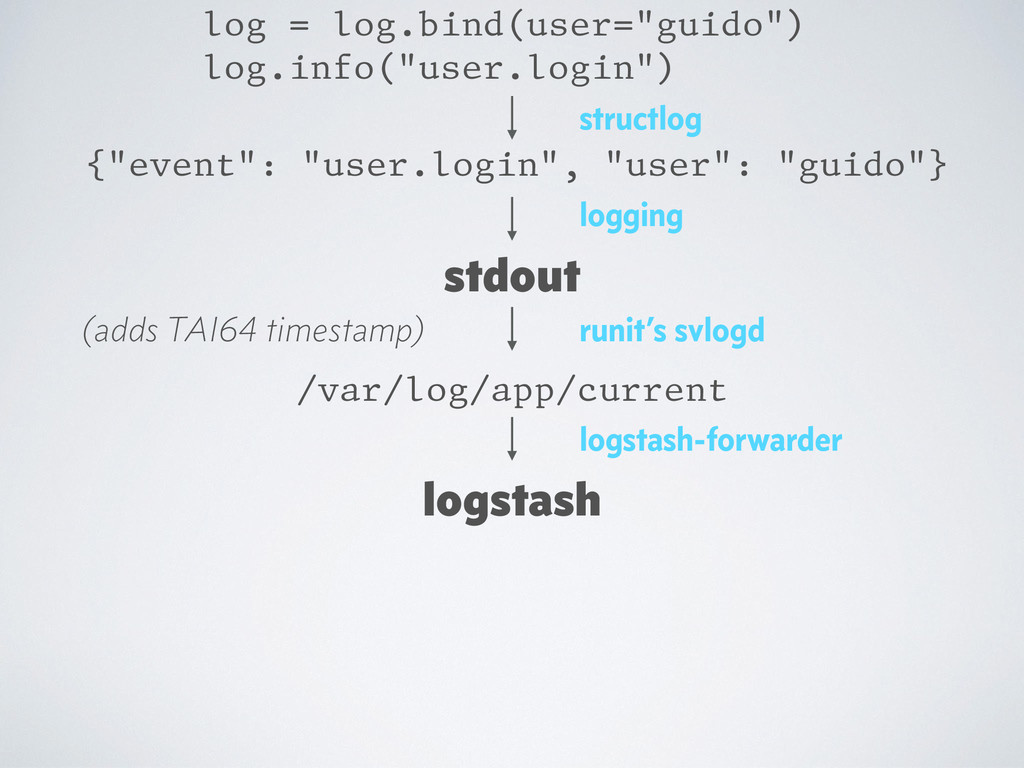
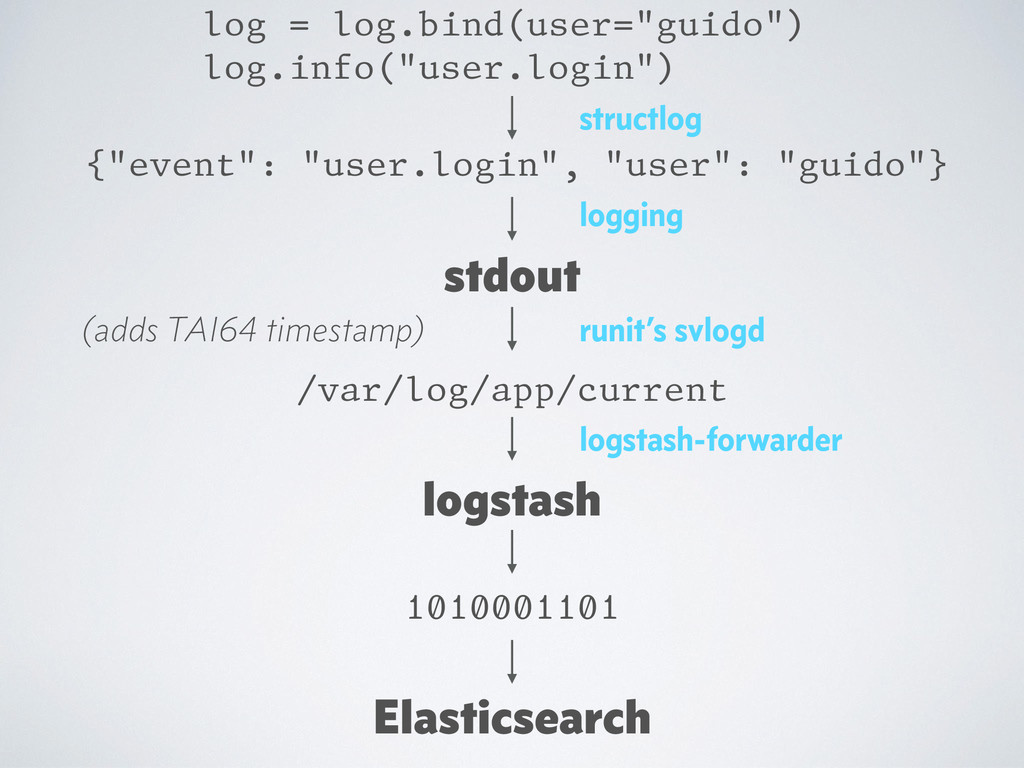
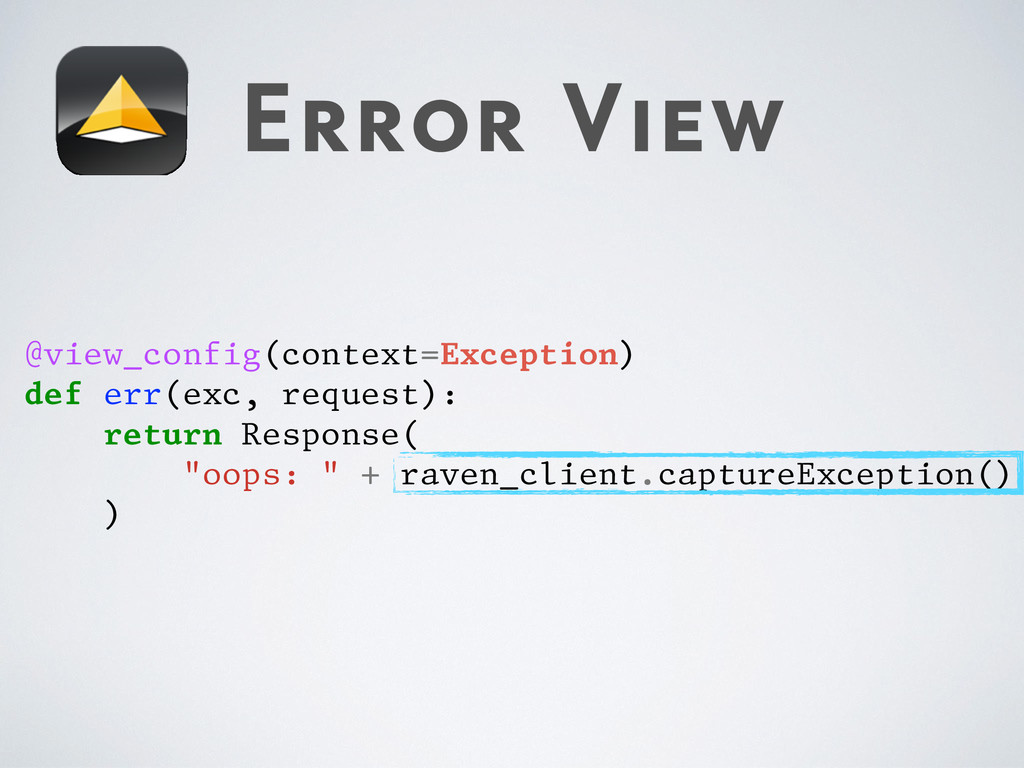
Your Python server applications are running but you’re wondering what they are doing? Your only clue about their current state is the server load? Let’s have stroll through the landscape of logging and metrics so you’ll find the perfect fit for your use cases!
https://us.pycon.org/2015/schedule/presentation/353/