c u l a t i o n M o d e l P o s t p r o c e s s i n g i n P y t h o n R y a n A b e r n a t h e y Columbia University J u l i u s B u s e c k e Princeton University GCM
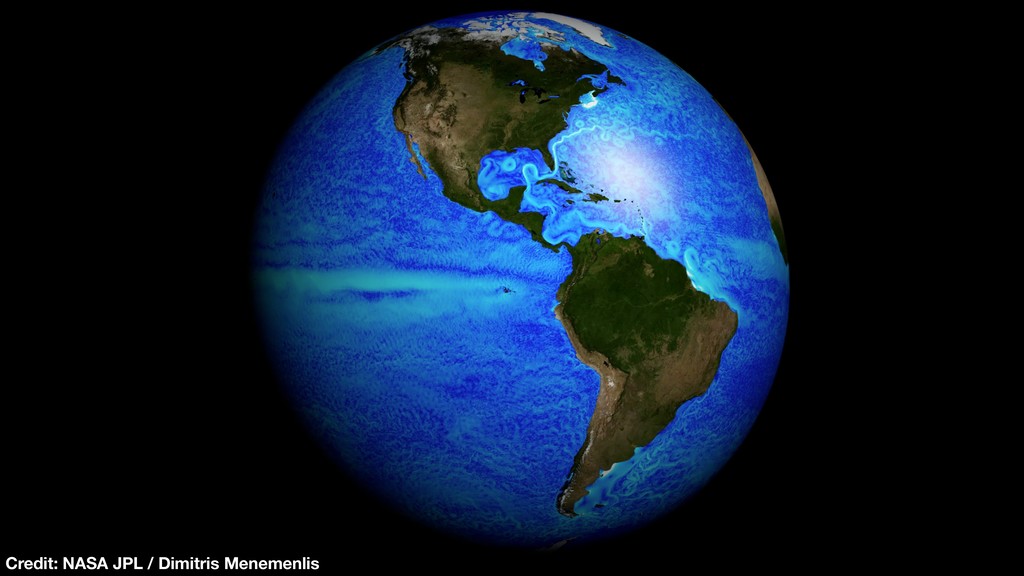
high-performance computers. • We can already simulate the ocean at incredibly high fidelity. • I could easily produce a petabyte of scientifically useful data within a week or two. !3 C o m p u t e r a r c h i t e c t u r e : S i m u l at i o n Lawrence Livermore National Laboratory's Sierra supercomputer. Randy Wong/LLNL
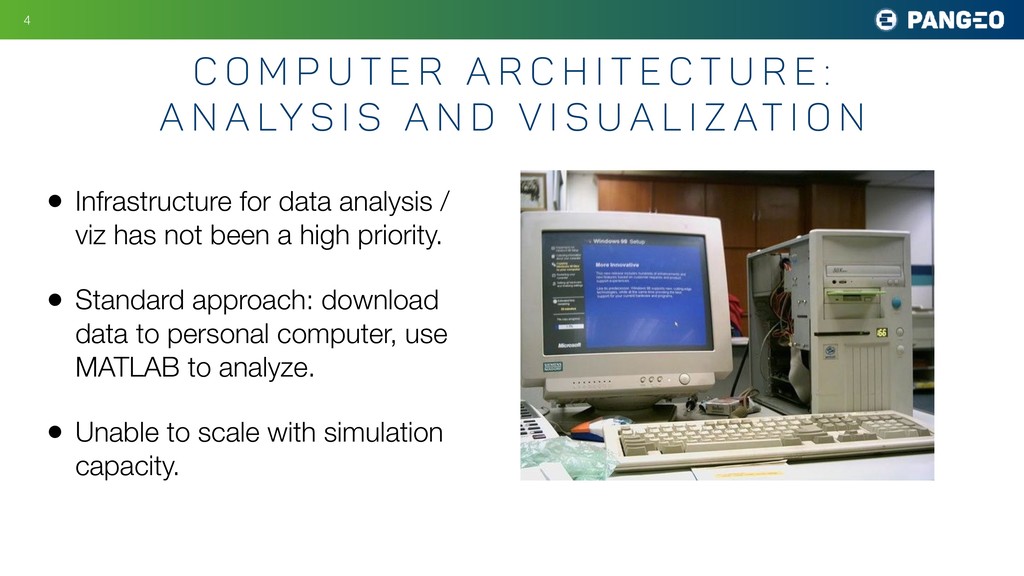
a high priority. • Standard approach: download data to personal computer, use MATLAB to analyze. • Unable to scale with simulation capacity. !4 C o m p u t e r a r c h i t e c t u r e : A n a ly s i s a n d V i s u a l i z at i o n
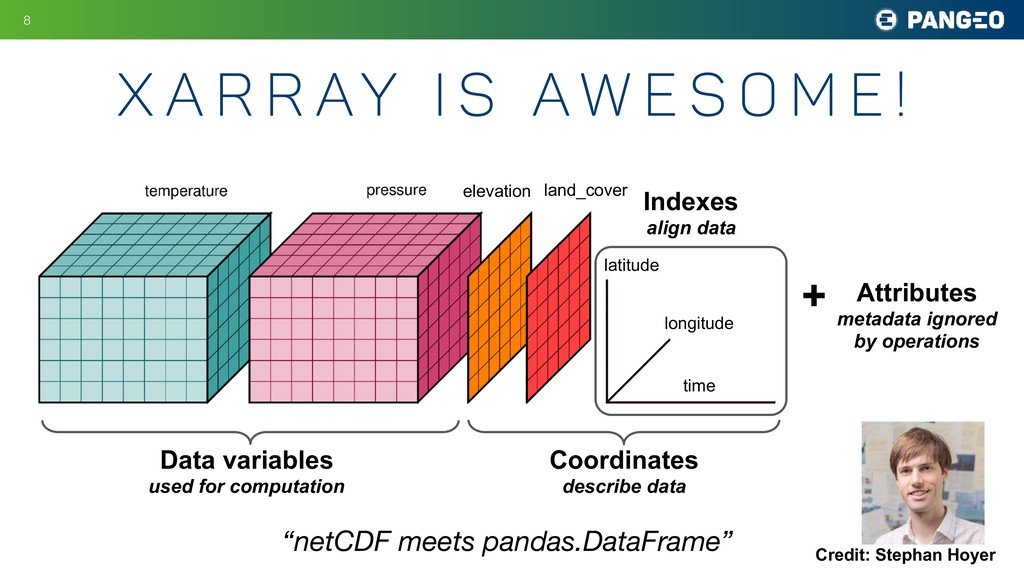
s o m e ! !8 time longitude latitude elevation Data variables used for computation Coordinates describe data Indexes align data Attributes metadata ignored by operations + land_cover “netCDF meets pandas.DataFrame” Credit: Stephan Hoyer
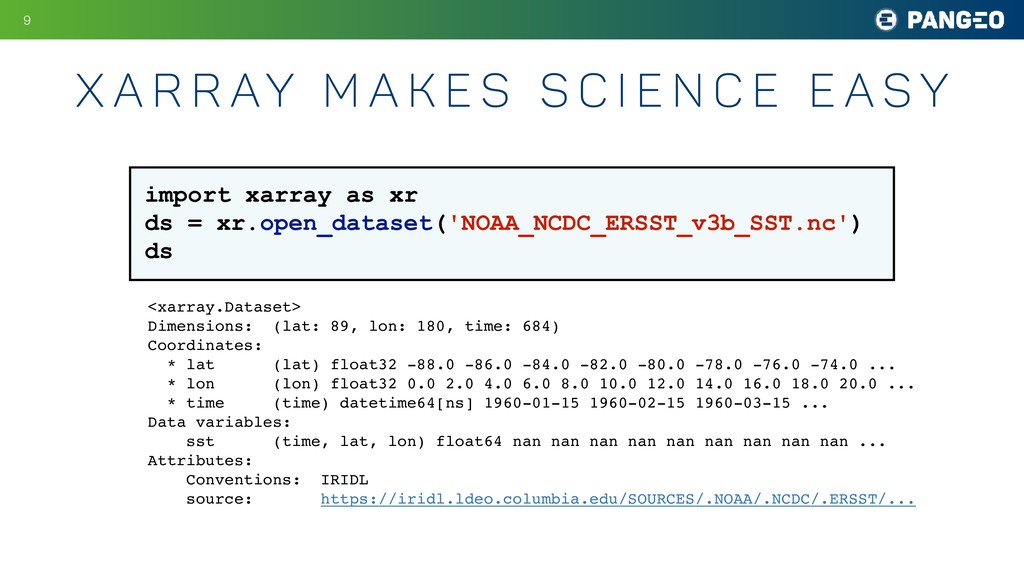
s c i e n c e e a s y !9 import xarray as xr ds = xr.open_dataset('NOAA_NCDC_ERSST_v3b_SST.nc') ds <xarray.Dataset> Dimensions: (lat: 89, lon: 180, time: 684) Coordinates: * lat (lat) float32 -88.0 -86.0 -84.0 -82.0 -80.0 -78.0 -76.0 -74.0 ... * lon (lon) float32 0.0 2.0 4.0 6.0 8.0 10.0 12.0 14.0 16.0 18.0 20.0 ... * time (time) datetime64[ns] 1960-01-15 1960-02-15 1960-03-15 ... Data variables: sst (time, lat, lon) float64 nan nan nan nan nan nan nan nan nan ... Attributes: Conventions: IRIDL source: https://iridl.ldeo.columbia.edu/SOURCES/.NOAA/.NCDC/.ERSST/...
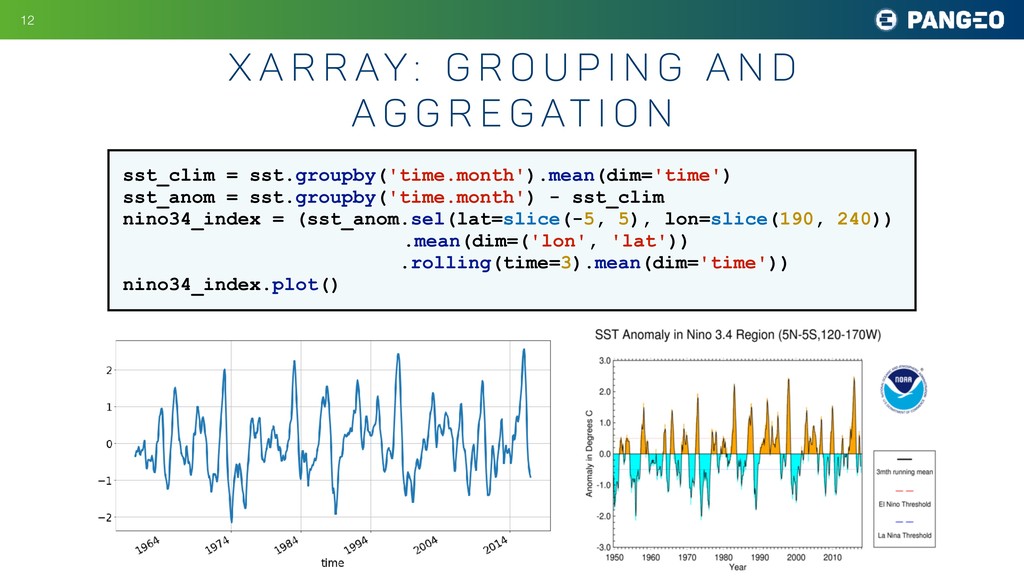
p i n g a n d a g g r e g at i o n !12 sst_clim = sst.groupby('time.month').mean(dim='time') sst_anom = sst.groupby('time.month') - sst_clim nino34_index = (sst_anom.sel(lat=slice(-5, 5), lon=slice(190, 240)) .mean(dim=('lon', 'lat')) .rolling(time=3).mean(dim='time')) nino34_index.plot()
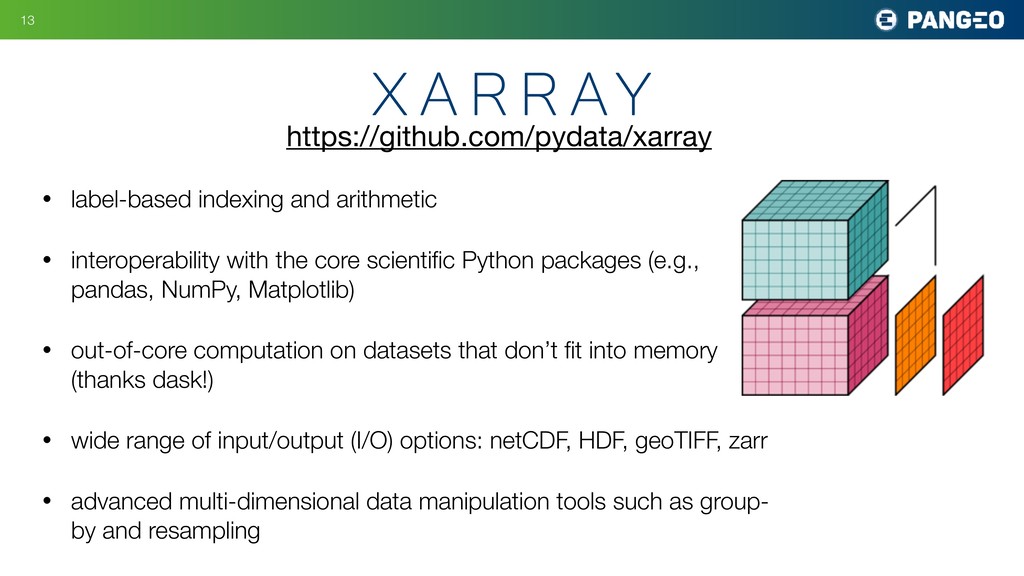
scientific Python packages (e.g., pandas, NumPy, Matplotlib) • out-of-core computation on datasets that don’t fit into memory (thanks dask!) • wide range of input/output (I/O) options: netCDF, HDF, geoTIFF, zarr • advanced multi-dimensional data manipulation tools such as group- by and resampling !13 x a r r ay https://github.com/pydata/xarray
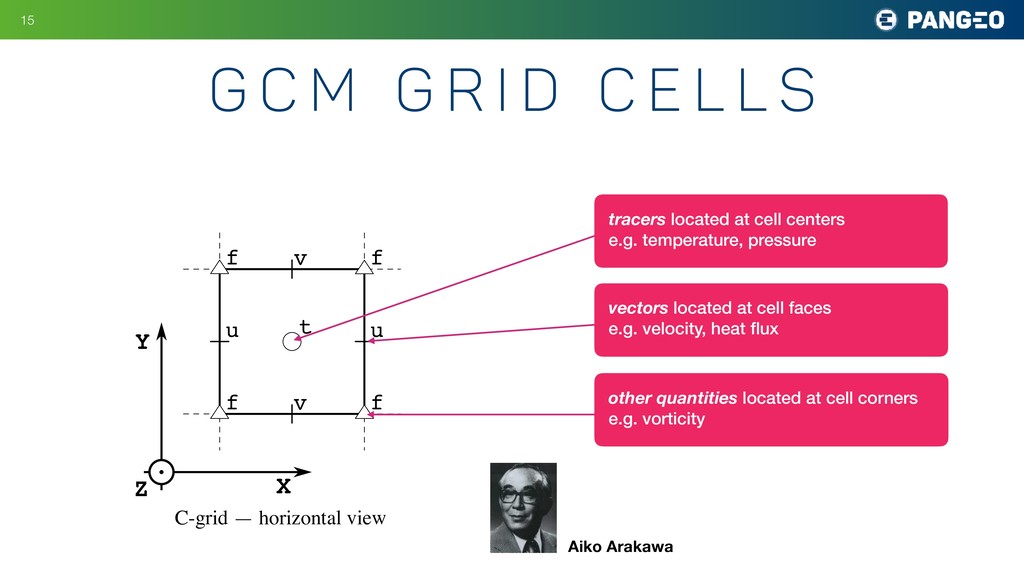
l s !15 7/9/2019 grid2d_hv.svg C-grid — horizontal view C-grid — vertical view t u w w u w u w u u w u w X Z Y t u v v f f u f f X Y Z tracers located at cell centers e.g. temperature, pressure vectors located at cell faces e.g. velocity, heat flux other quantities located at cell corners e.g. vorticity Aiko Arakawa
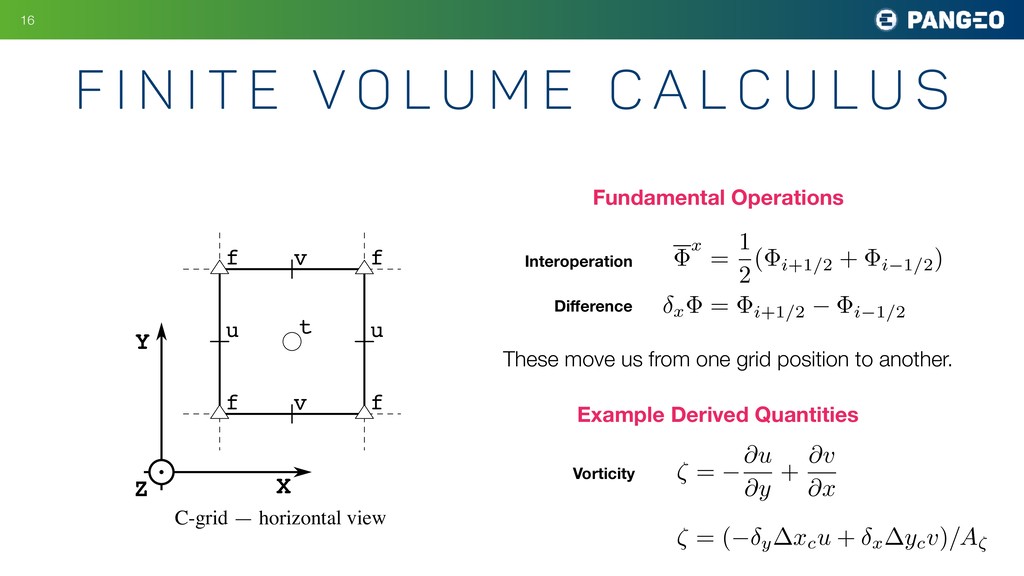
m e C a l c u l u s !16 7/9/2019 grid2d_hv.svg C-grid — horizontal view C-grid — vertical view t u w w u w u w u u w u w X Z Y t u v v f f u f f X Y Z Fundamental Operations Interoperation Difference x = 1 2 ( i +1 / 2 + i 1 / 2 ) x = i +1 / 2 i 1 / 2 These move us from one grid position to another. Example Derived Quantities ⇣ = @u @y + @v @x ⇣ = ( y xcu + x ycv ) /A⇣ Vorticity
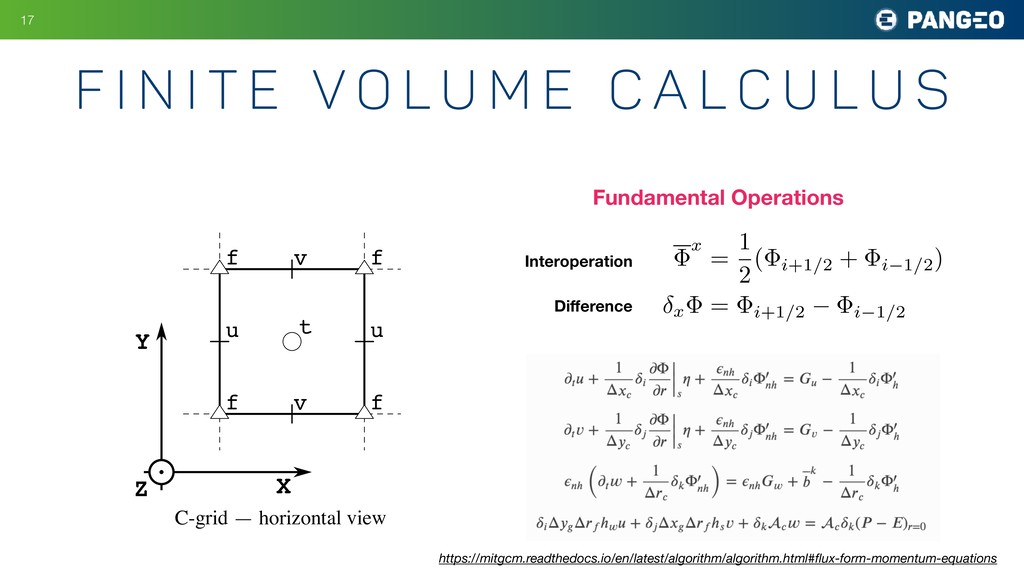
m e C a l c u l u s !17 7/9/2019 grid2d_hv.svg C-grid — horizontal view C-grid — vertical view t u w w u w u w u u w u w X Z Y t u v v f f u f f X Y Z Fundamental Operations Interoperation Difference x = 1 2 ( i +1 / 2 + i 1 / 2 ) x = i +1 / 2 i 1 / 2 https://mitgcm.readthedocs.io/en/latest/algorithm/algorithm.html#flux-form-momentum-equations
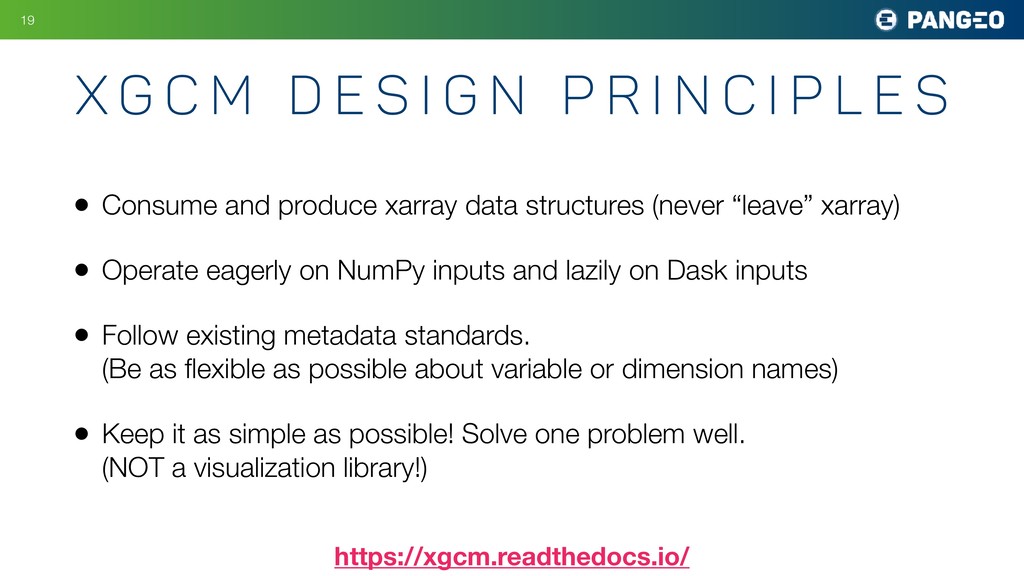
• Operate eagerly on NumPy inputs and lazily on Dask inputs • Follow existing metadata standards. (Be as flexible as possible about variable or dimension names) • Keep it as simple as possible! Solve one problem well. (NOT a visualization library!) !19 X G C M D e s i g n P r i n c i p l e s https://xgcm.readthedocs.io/
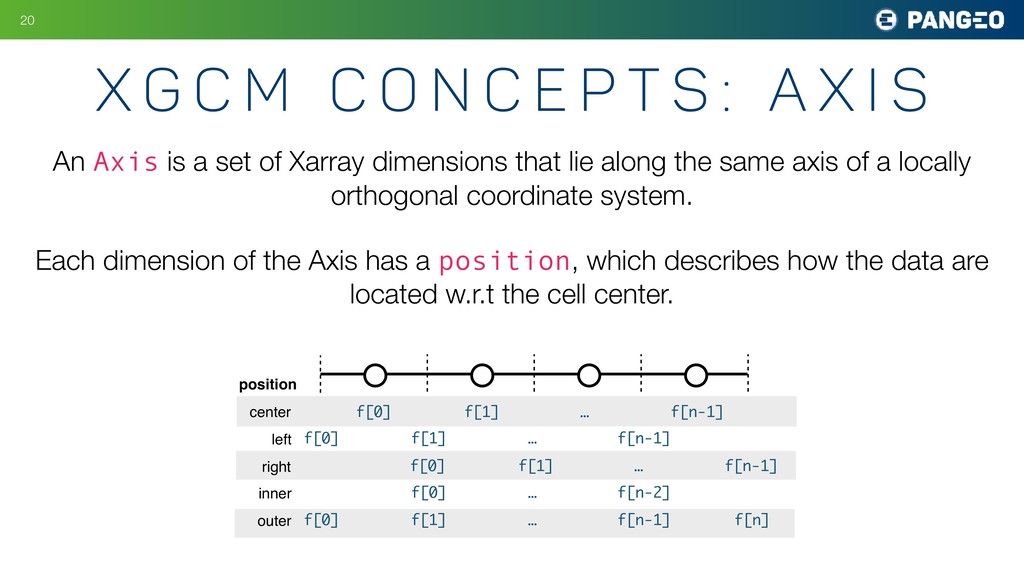
t s : A x i s !20 7/9/2019 axis_positions.svg center f[0] f[1] … f[n-1] left f[0] f[1] … f[n-1] right f[0] f[1] … f[n-1] inner f[0] … f[n-2] position outer f[0] f[1] … f[n-1] f[n] An Axis is a set of Xarray dimensions that lie along the same axis of a locally orthogonal coordinate system. Each dimension of the Axis has a position, which describes how the data are located w.r.t the cell center.
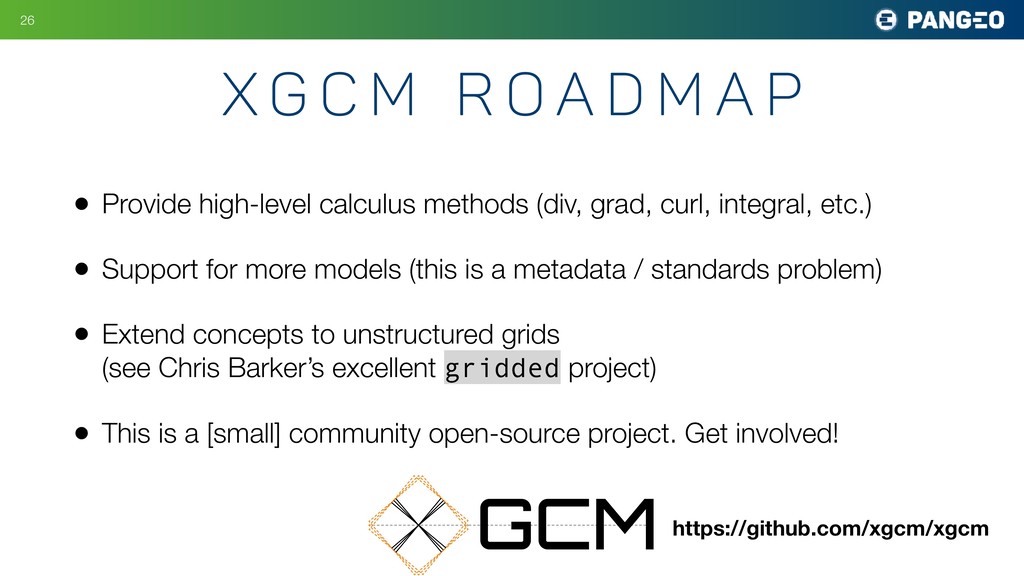
• Support for more models (this is a metadata / standards problem) • Extend concepts to unstructured grids (see Chris Barker’s excellent gridded project) • This is a [small] community open-source project. Get involved! !26 X G C M R o a d m a p GCM https://github.com/xgcm/xgcm
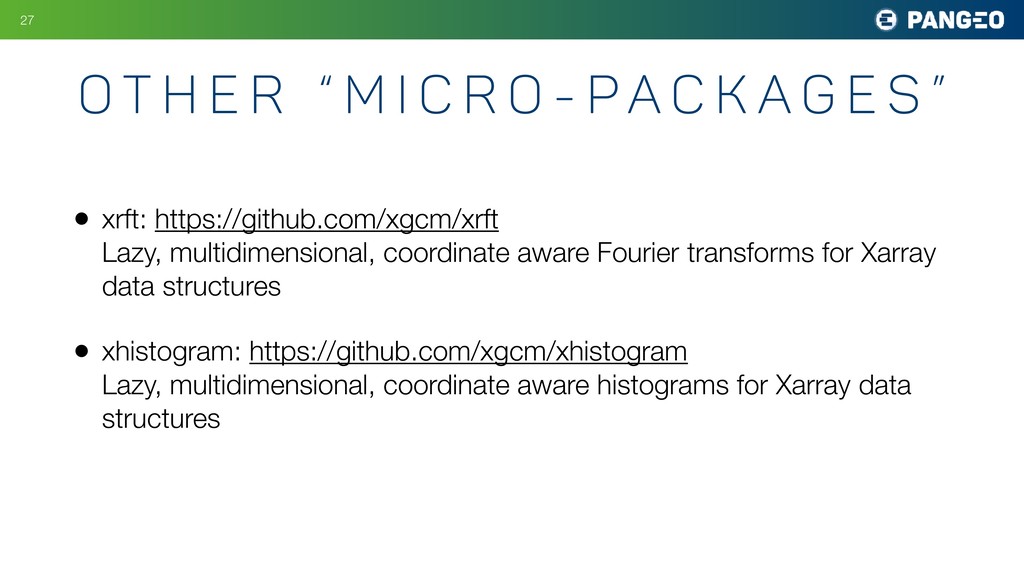
Xarray data structures • xhistogram: https://github.com/xgcm/xhistogram Lazy, multidimensional, coordinate aware histograms for Xarray data structures !27 O t h e r “ M i c r o - Pa c k a g e s ”