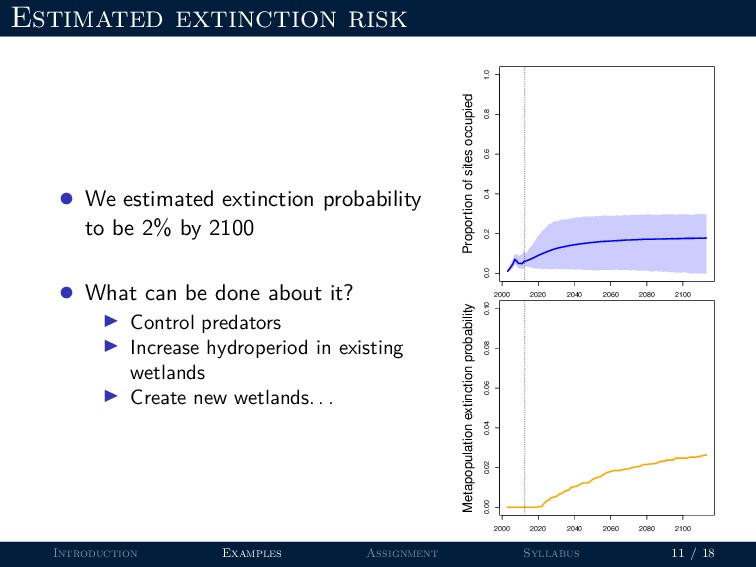
population size and structure? (2) How do environmental change and human activities (including management actions) affect population viability? Introduction Examples Assignment Syllabus 2 / 18
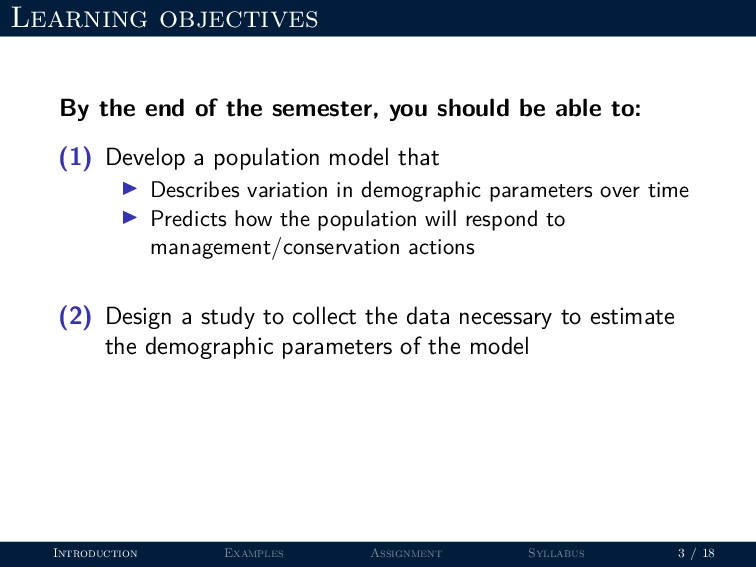
be able to: (1) Develop a population model that Describes variation in demographic parameters over time Predicts how the population will respond to management/conservation actions Introduction Examples Assignment Syllabus 3 / 18
be able to: (1) Develop a population model that Describes variation in demographic parameters over time Predicts how the population will respond to management/conservation actions (2) Design a study to collect the data necessary to estimate the demographic parameters of the model Introduction Examples Assignment Syllabus 3 / 18
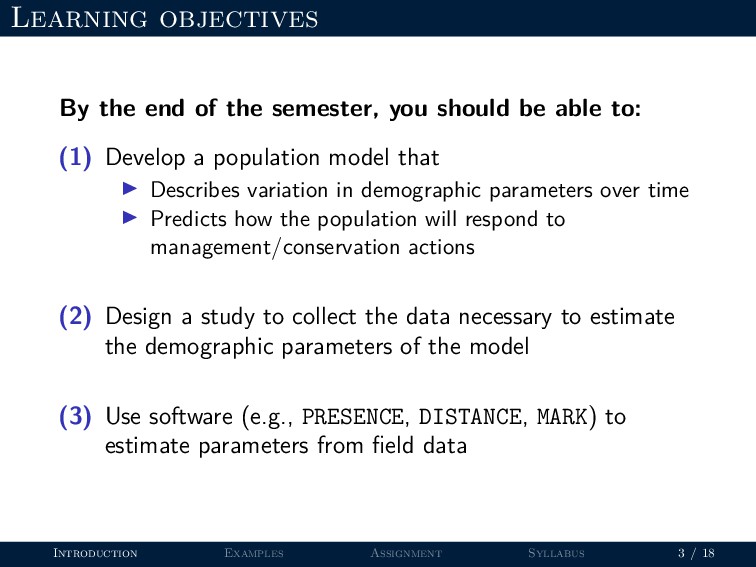
be able to: (1) Develop a population model that Describes variation in demographic parameters over time Predicts how the population will respond to management/conservation actions (2) Design a study to collect the data necessary to estimate the demographic parameters of the model (3) Use software (e.g., PRESENCE, DISTANCE, MARK) to estimate parameters from field data Introduction Examples Assignment Syllabus 3 / 18
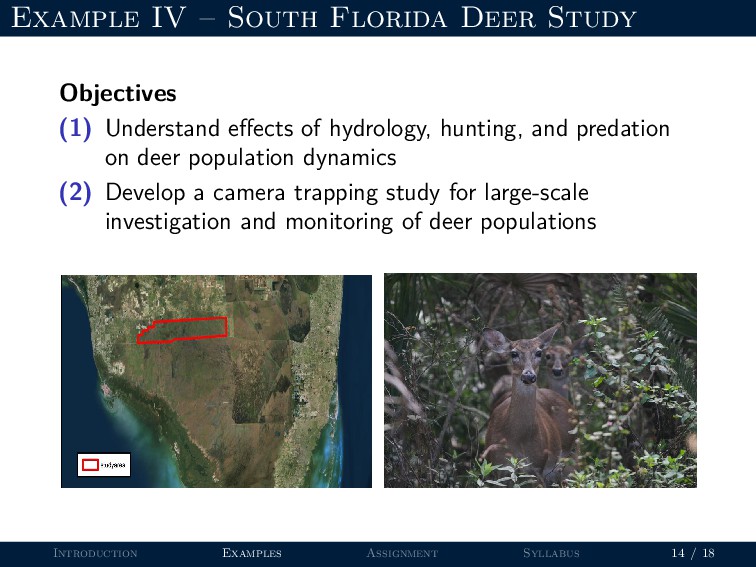
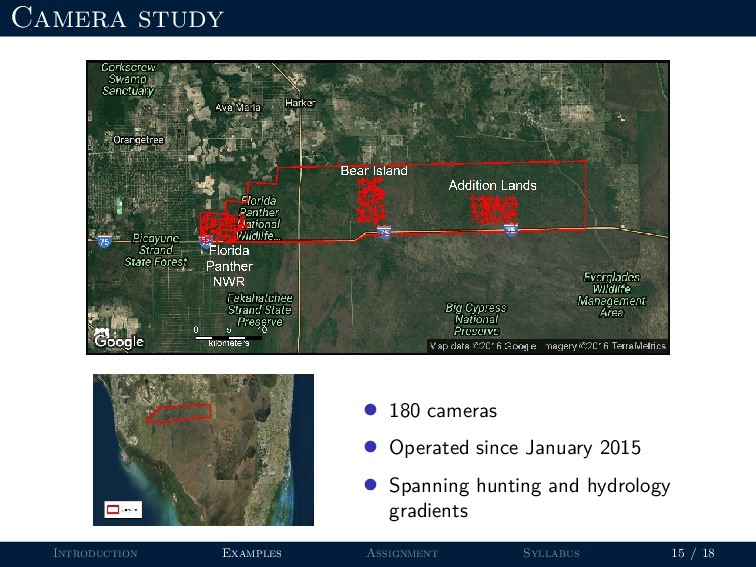
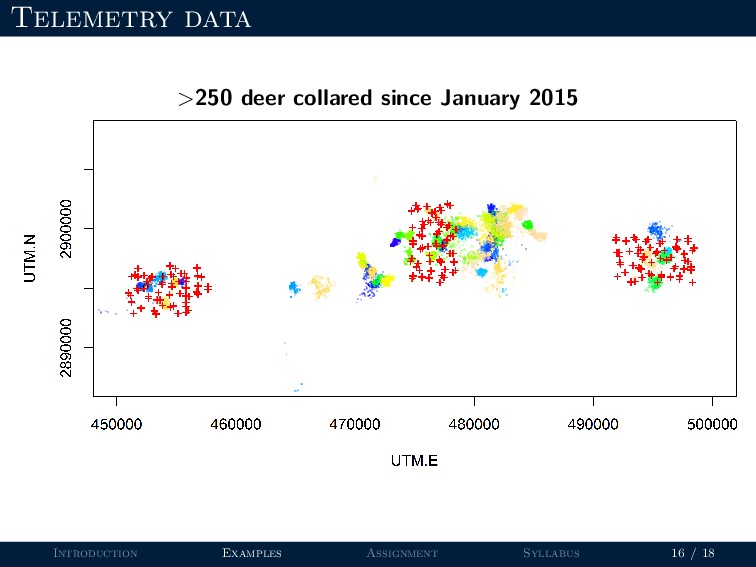
effects of hydrology, hunting, and predation on deer population dynamics (2) Develop a camera trapping study for large-scale investigation and monitoring of deer populations Introduction Examples Assignment Syllabus 14 / 18
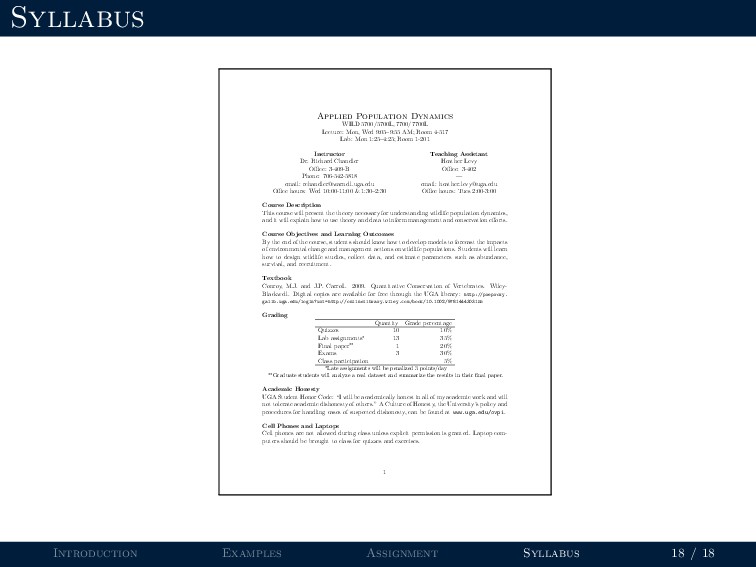
9:05–9:55 AM; Room 4-517 Lab: Mon 1:25–4:25; Room 1-201 Instructor Teaching Assistant Dr. Richard Chandler Heather Levy Office: 3-409-B Office: 3-402 Phone: 706-542-5818 — email: [email protected] email: [email protected] Office hours: Wed 10:00-11:00 & 1:30–2:30 Office hours: Tues 2:00-3:00 Course Description This course will present the theory necessary for understanding wildlife population dynamics, and it will explain how to use theory and data to inform management and conservation efforts. Course Objectives and Learning Outcomes By the end of the course, students should know how to develop models to forecast the impacts of environmental change and management actions on wildlife populations. Students will learn how to design wildlife studies, collect data, and estimate parameters such as abundance, survival, and recruitment. Textbook Conroy, M.J. and J.P. Carroll. 2009. Quantitative Conservation of Vertebrates. Wiley- Blackwell. Digital copies are available for free through the UGA library: http://preproxy. galib.uga.edu/login?url=http://onlinelibrary.wiley.com/book/10.1002/9781444303155 Grading Quantity Grade percentage Quizzes 10 10% Lab assignments∗ 13 35% Final paper∗∗ 1 20% Exams 3 30% Class participation 5% ∗Late assignments will be penalized 3 points/day ∗∗Graduate students will analyze a real dataset and summarize the results in their final paper. Academic Honesty UGA Student Honor Code: “I will be academically honest in all of my academic work and will not tolerate academic dishonesty of others.” A Culture of Honesty, the University’s policy and procedures for handling cases of suspected dishonesty, can be found at www.uga.edu/ovpi. Cell Phones and Laptops Cell phones are not allowed during class unless explicit permission is granted. Laptop com- puters should be brought to class for quizzes and exercises. 1 Introduction Examples Assignment Syllabus 18 / 18