Upgrade to Pro — share decks privately, control downloads, hide ads and more …

Velocity NY 2014: Deploying on the Edge (with notes)

Rob Peters
September 17, 2014

Velocity NY 2014: Deploying on the Edge (with notes)

Slides from http://velocityconf.com/velocityny2014/public/schedule/detail/35815

Video at https://www.youtube.com/watch?v=PJbKTJN3ThY

See https://speakerdeck.com/rjpcal/velocity-ny-2014-deploying-on-the-edge for slides without notes

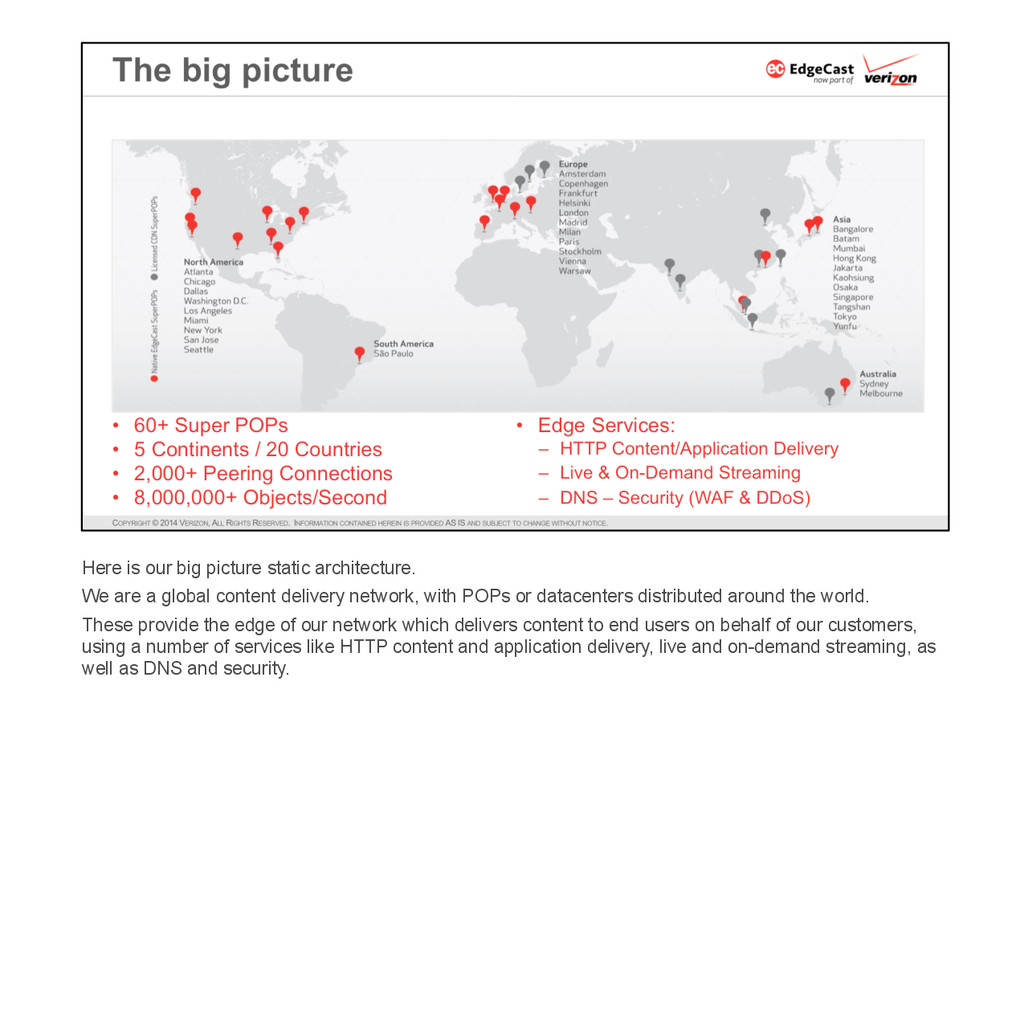
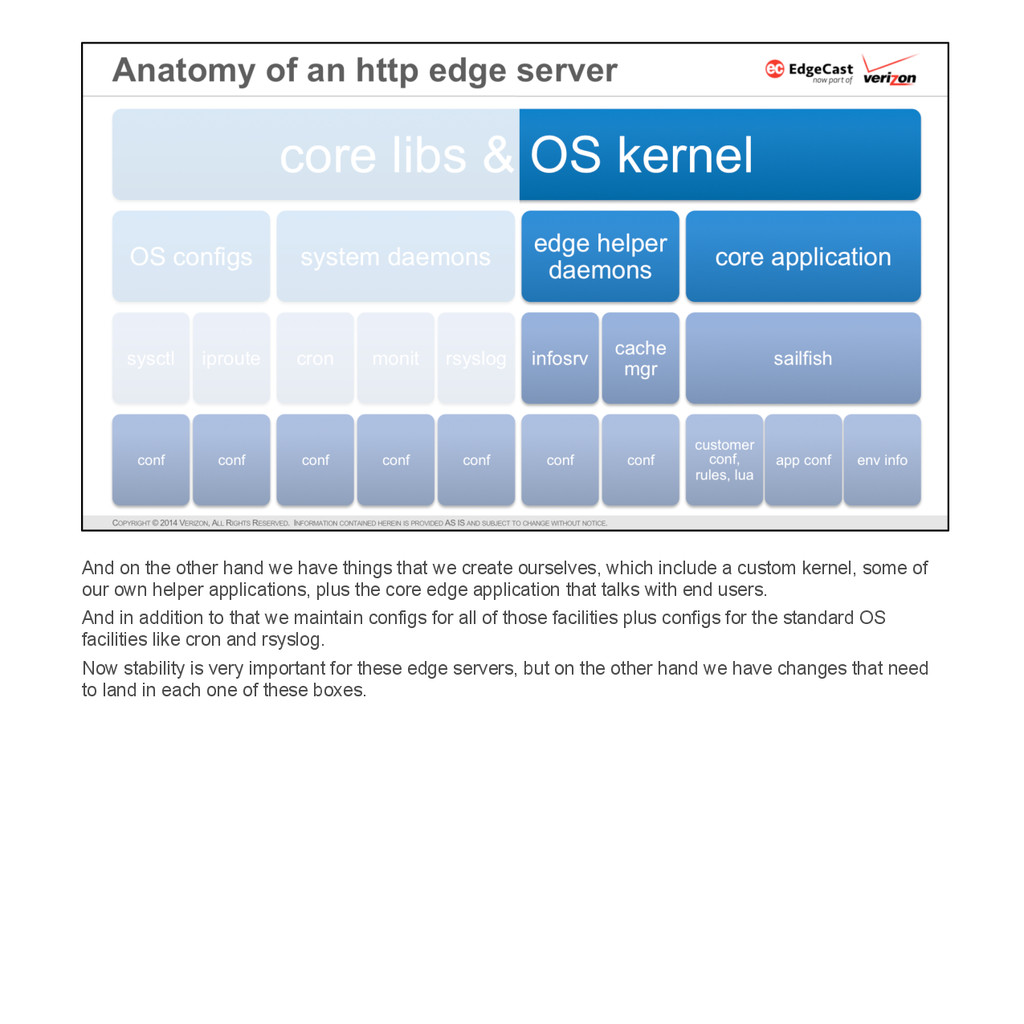
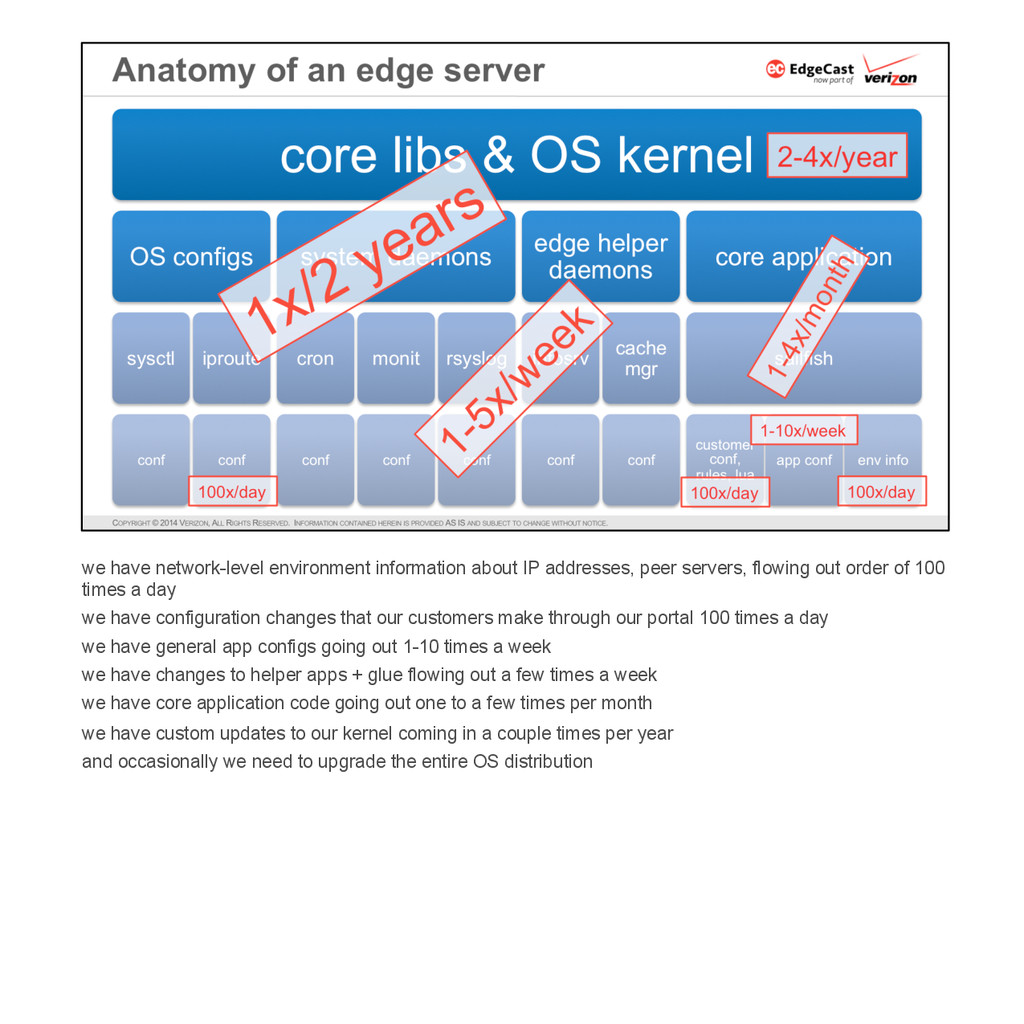
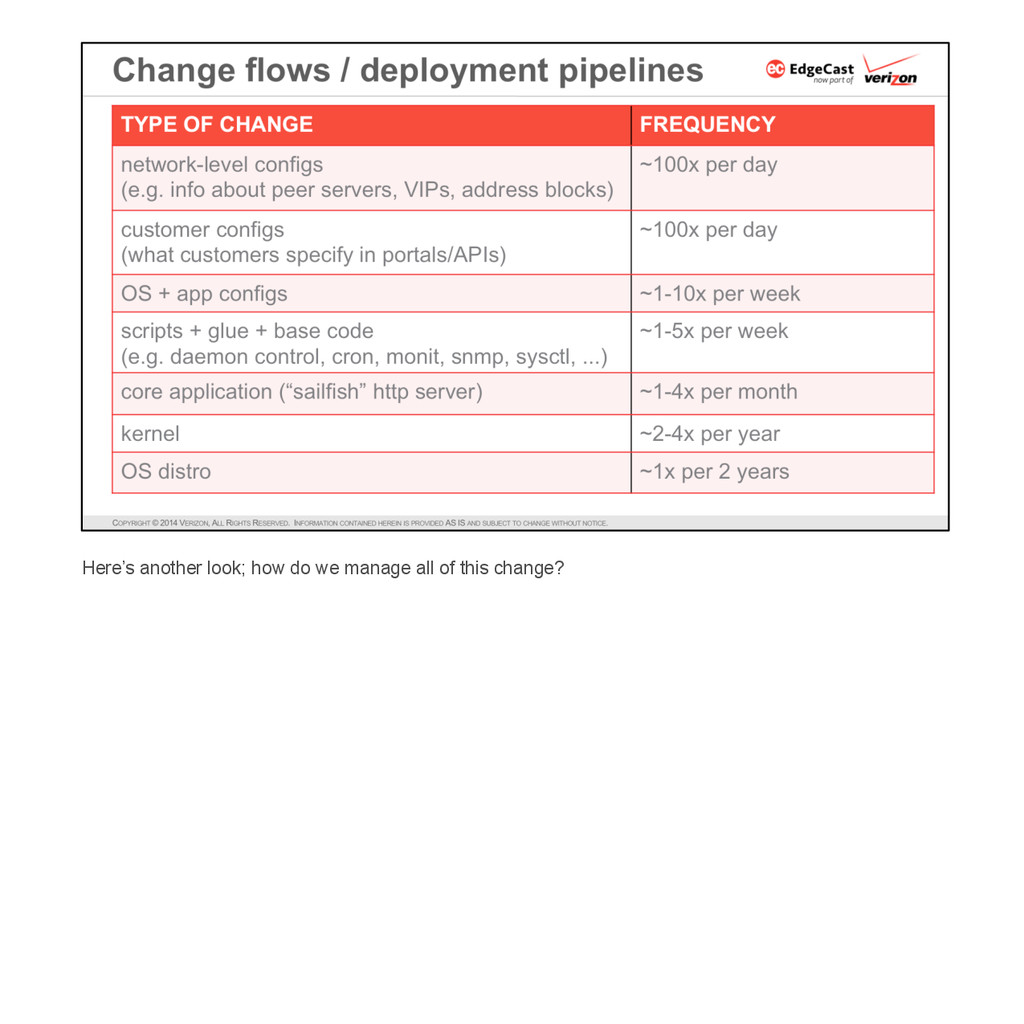
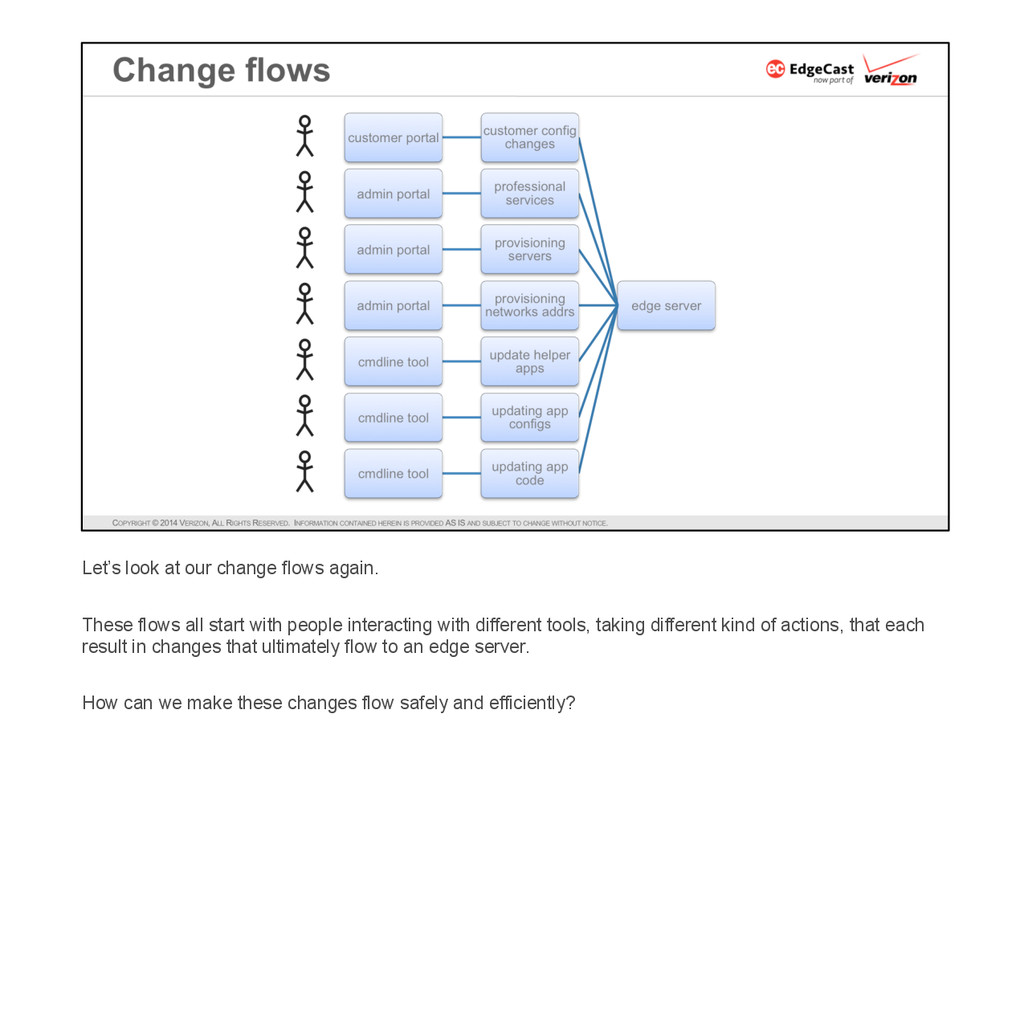
We operate a global edge network that delivers many types of modern web traffic, including dynamic applications, websites, mobile apps, live and on-demand streams, and large-file downloads. We strive to maintain reliability, performance, and functionality as we develop and deploy the http server software that handles this traffic. In this talk we’ll cover the evolution of our deployment best practices as we have learned from the community and from our own experiences, including the following:

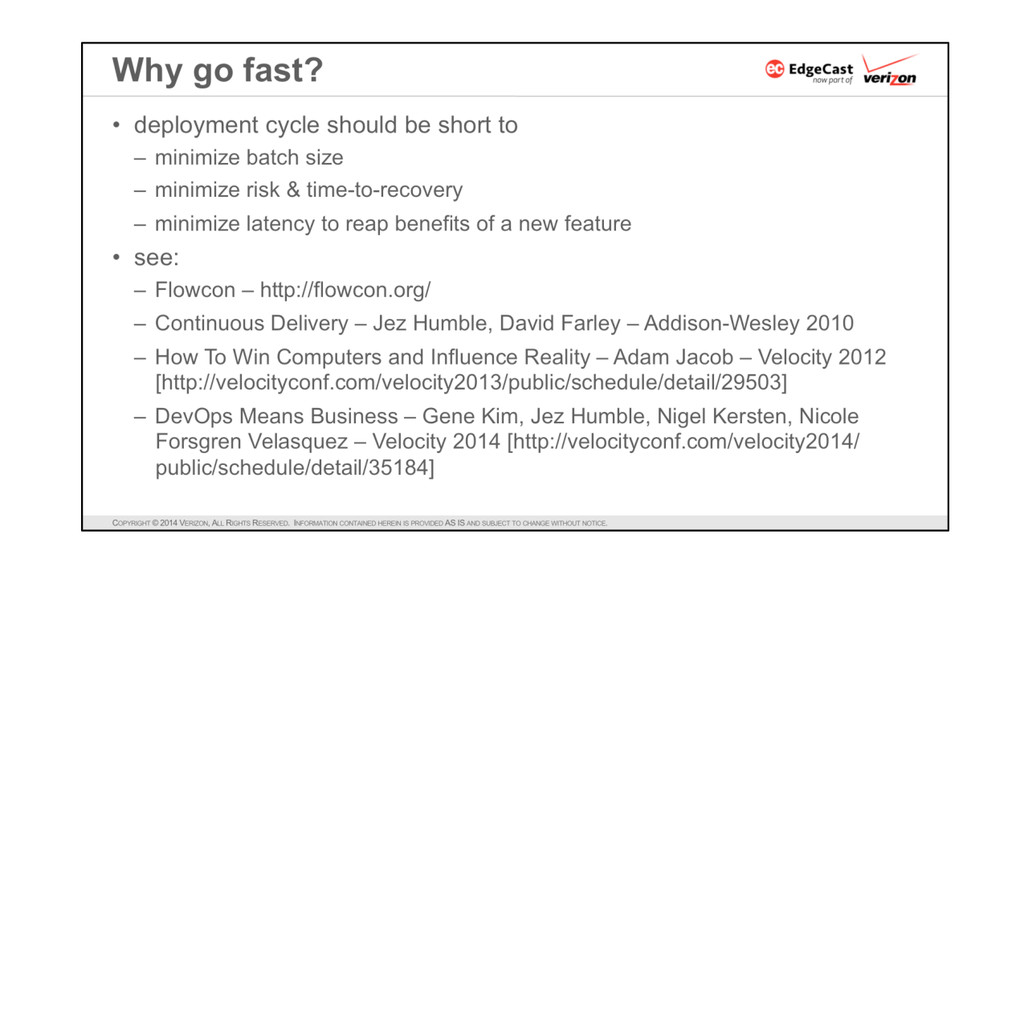
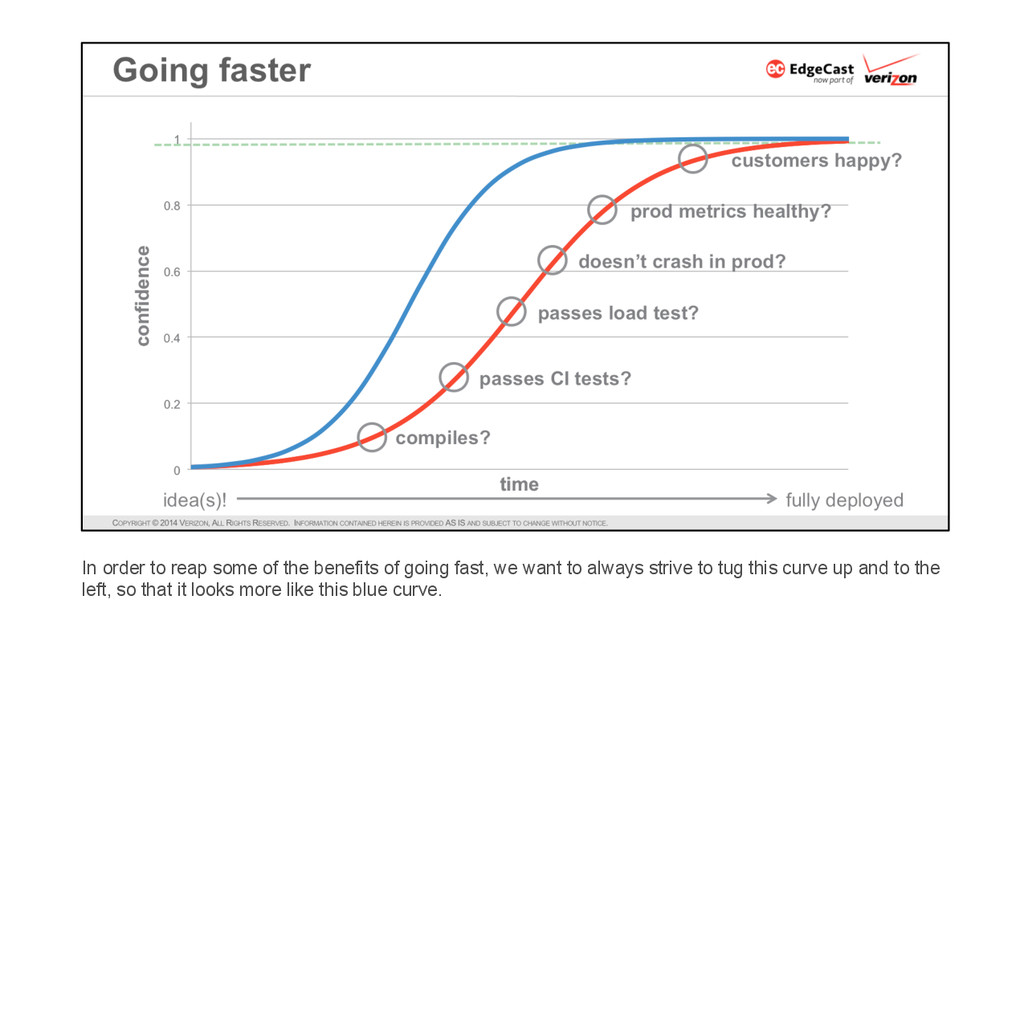
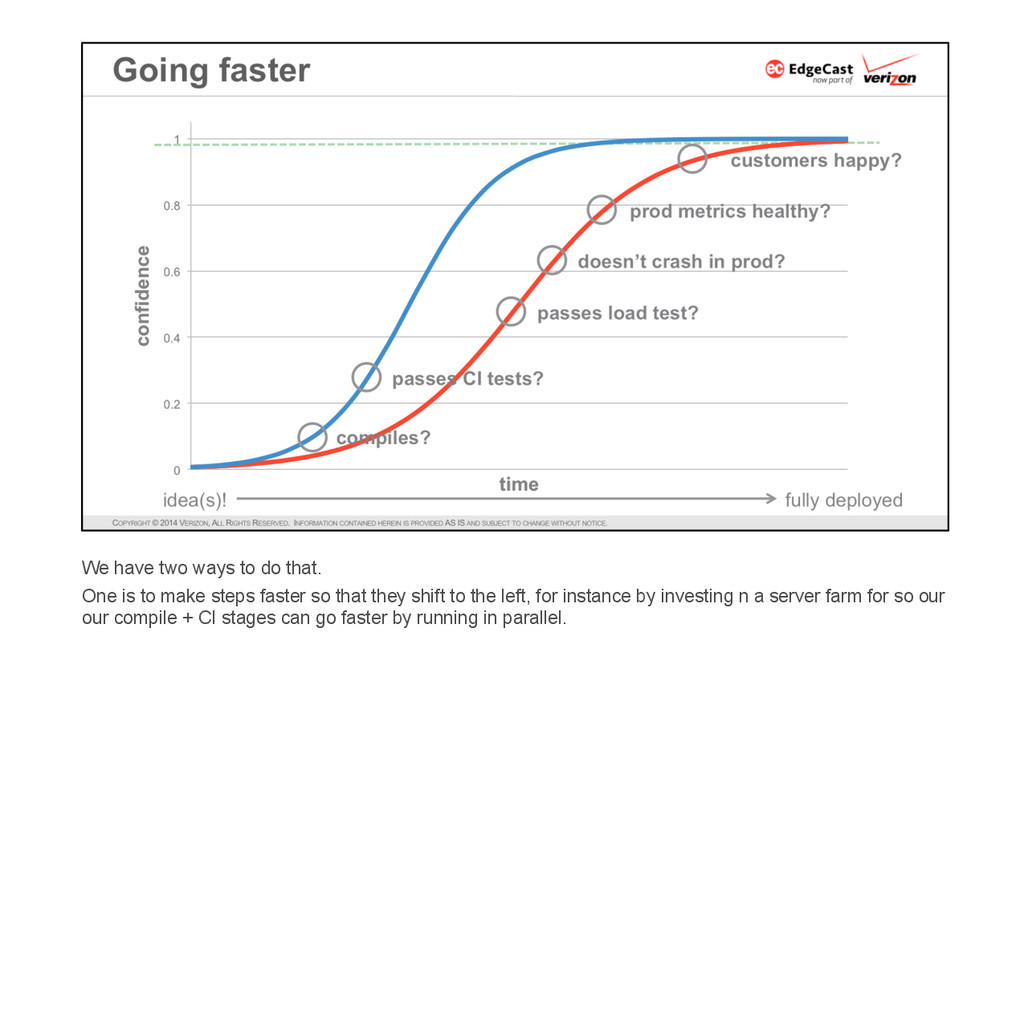
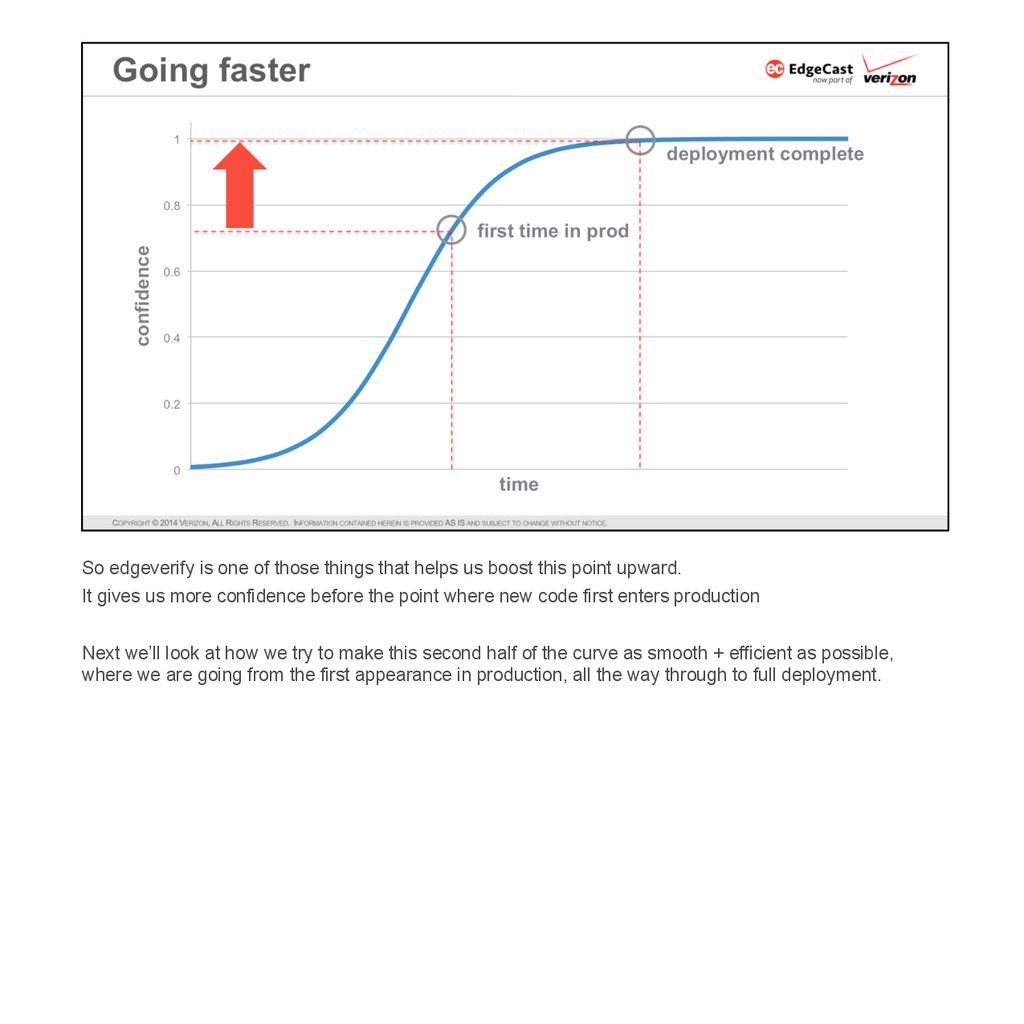
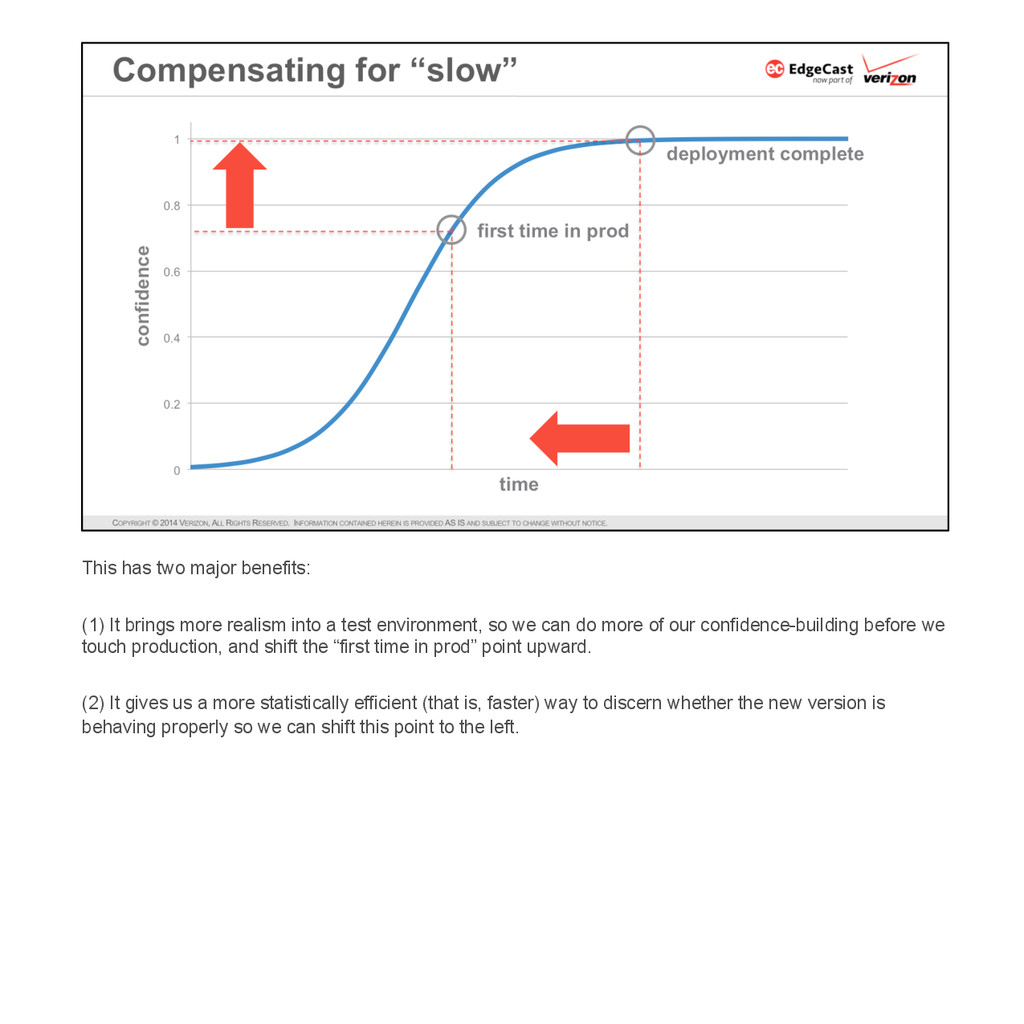
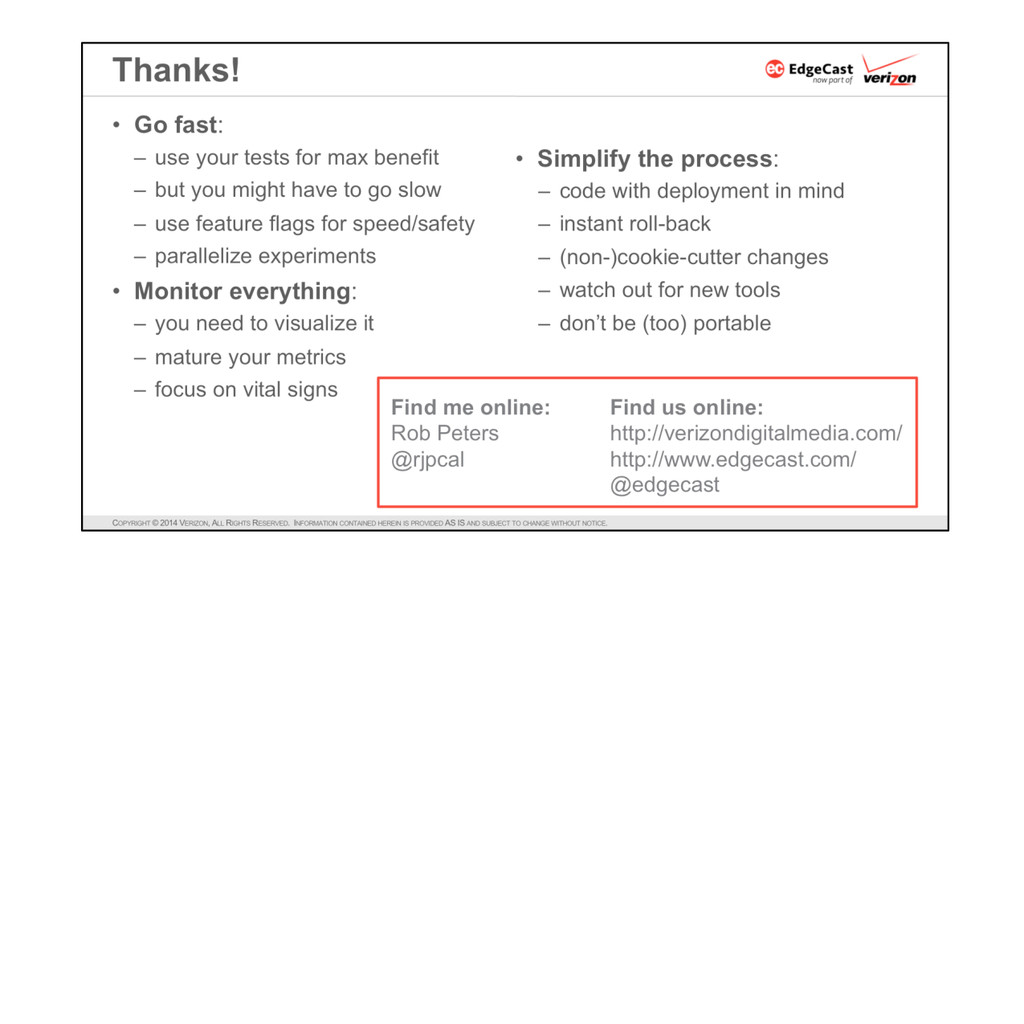
* Go fast — the deployment cycle should be as short as possible in order to minimize batch size (so as to constrain the scope of the unexpected, because there is always something unexpected) and reduce risk and mean-time-to-recovery.
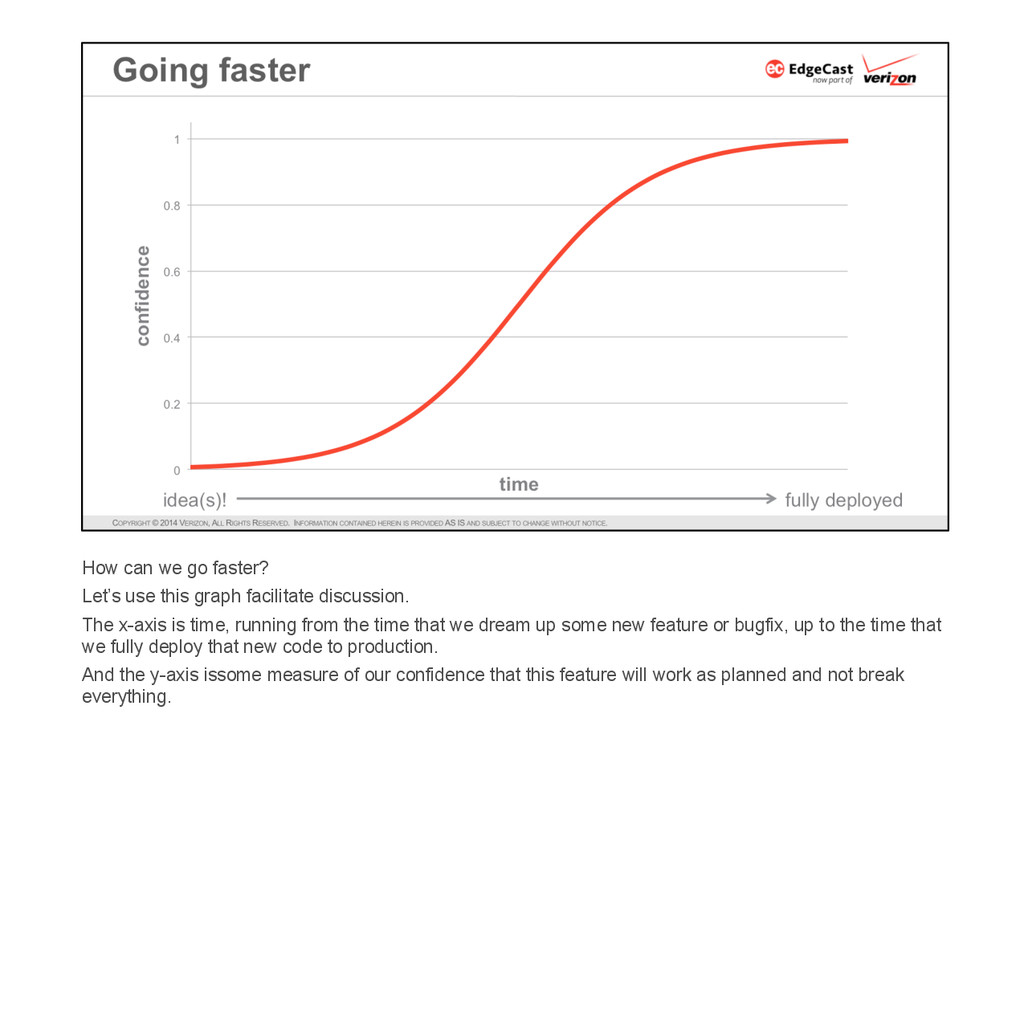
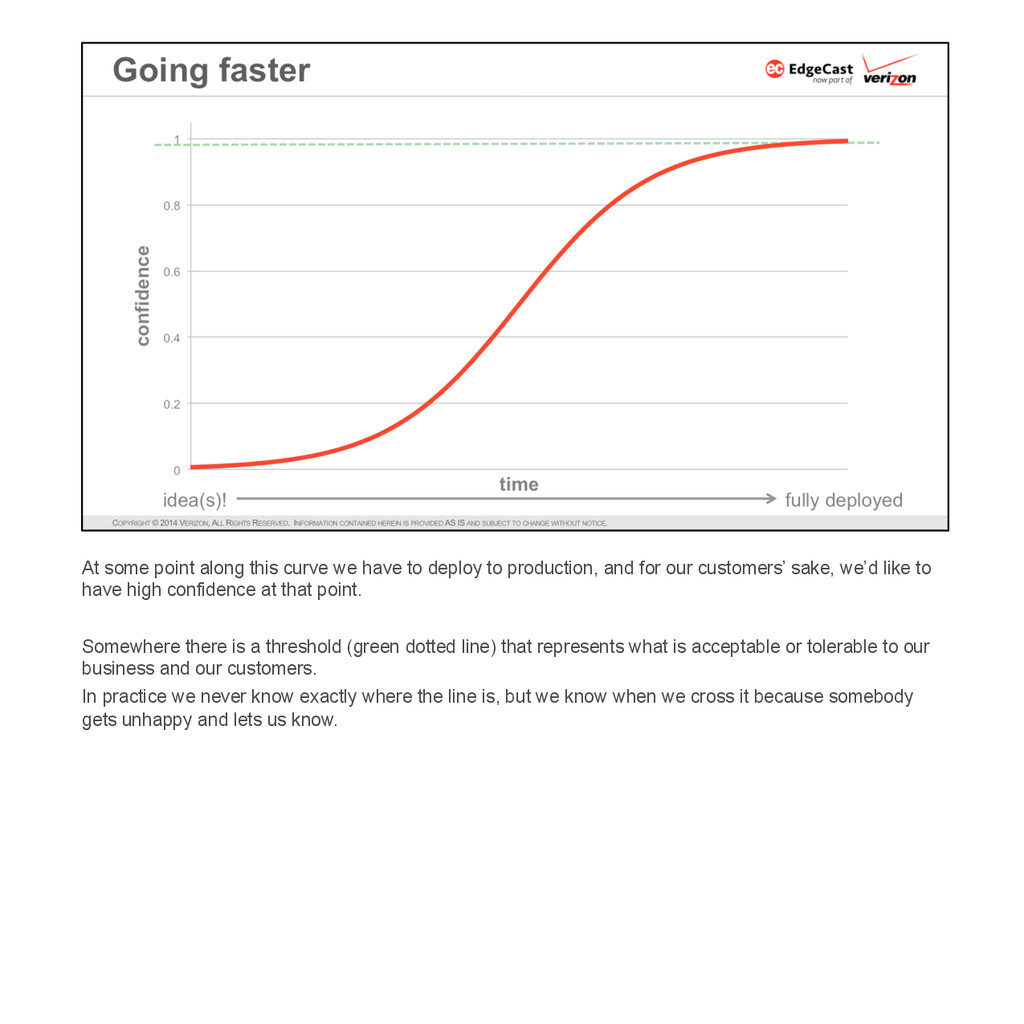
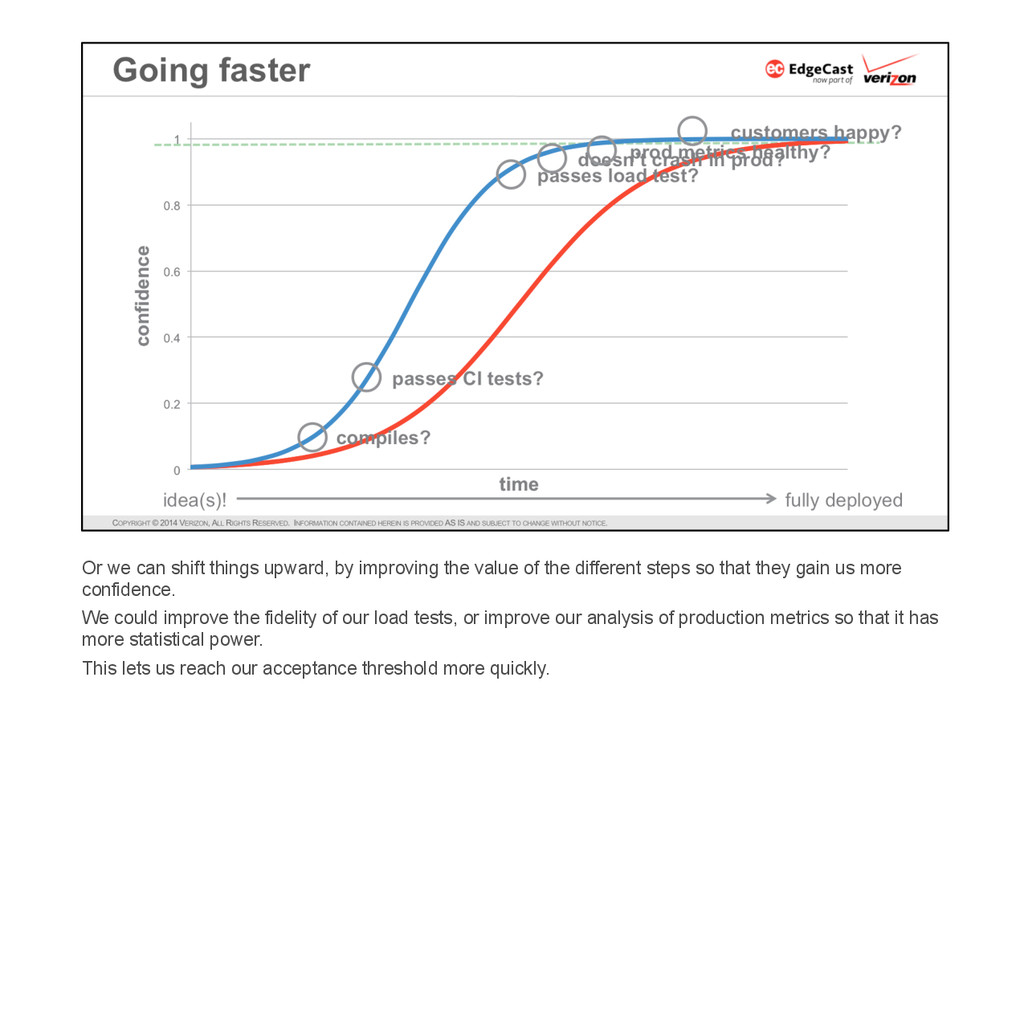
* But not too fast — the deployment cycle should be long enough to be very confident that the latest release has no new issues before moving on to the next release. The time to “long enough” may vary significantly depending on the layer of the software stack.
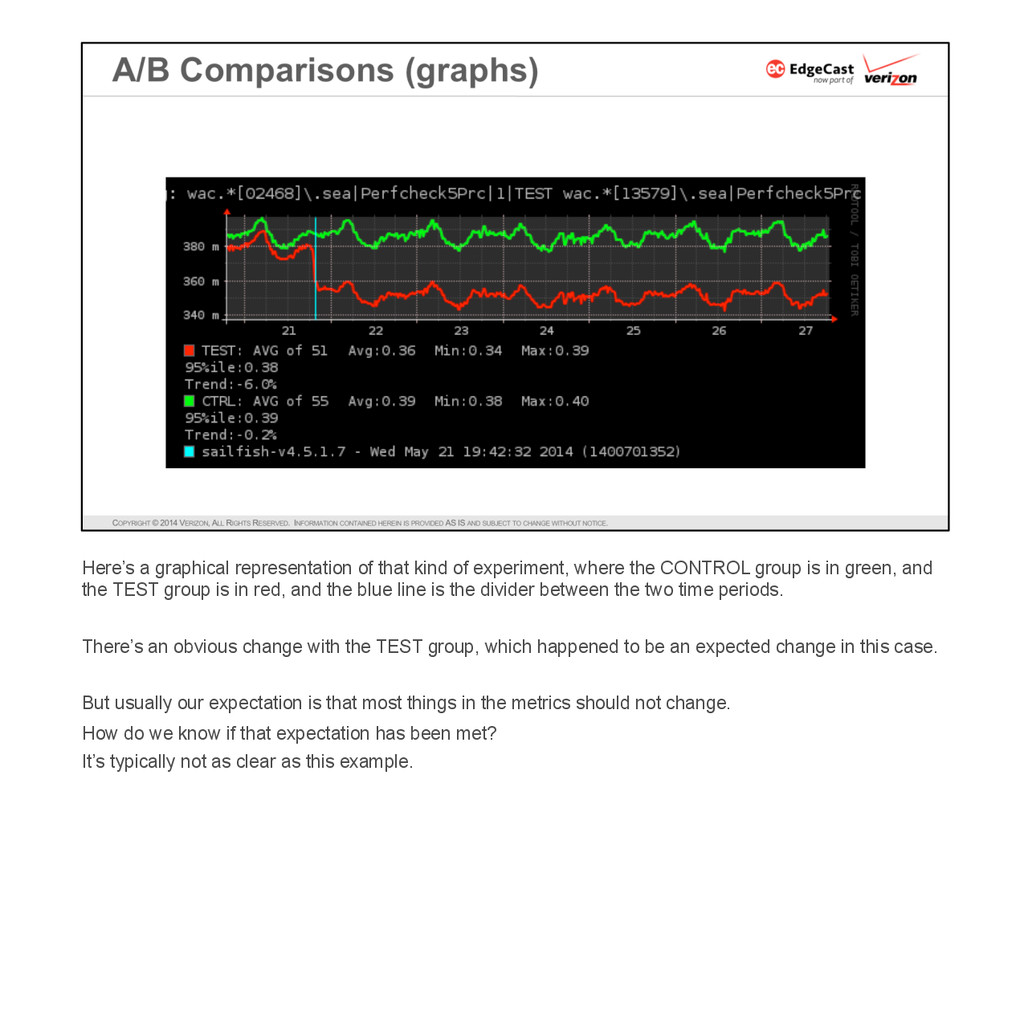
* Monitor everything — you can’t fix a problem until you can visualize it.
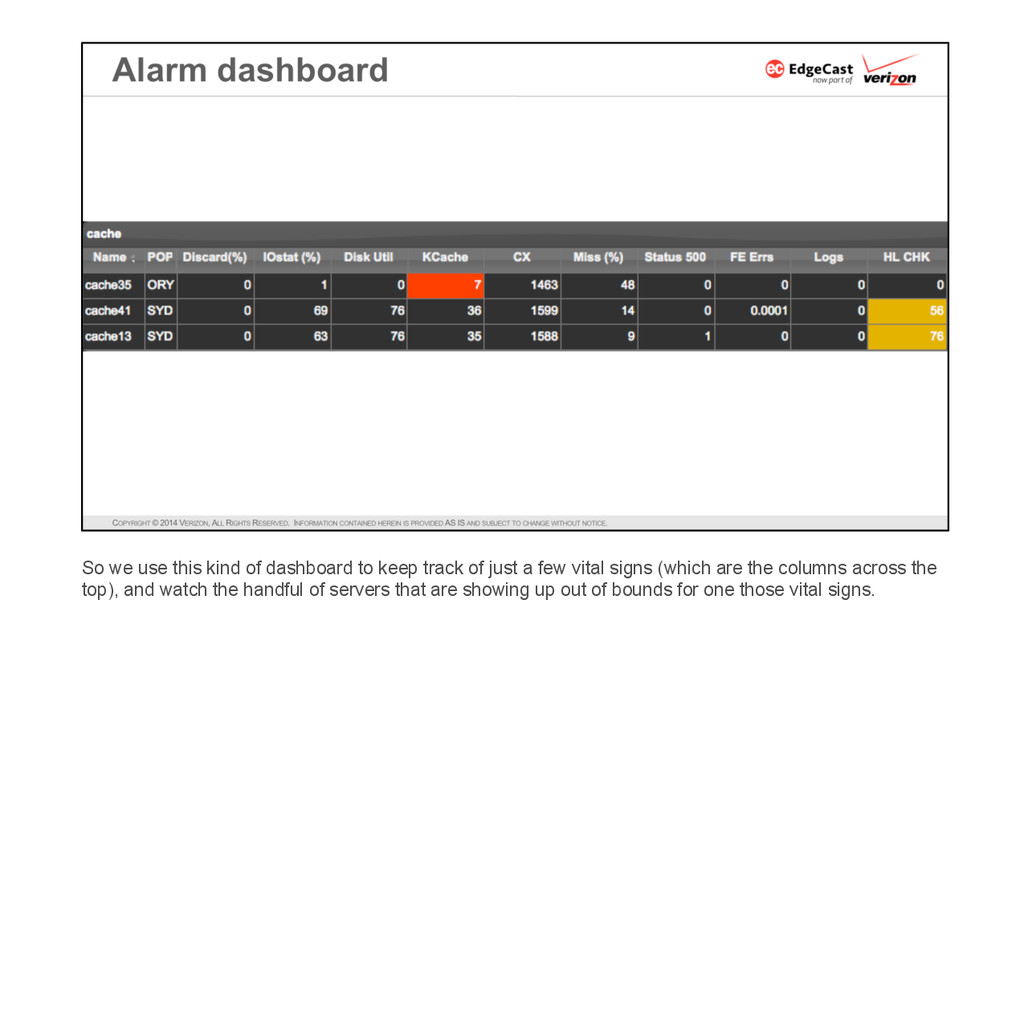
* But really monitor just a few things — find the smallest set of vital signs that can reliably indicate “is everything running smoothly?”
* Be able to roll forward/backward almost instantly, keeping in mind that the links between command/control and edge systems may be slow and/or lossy.
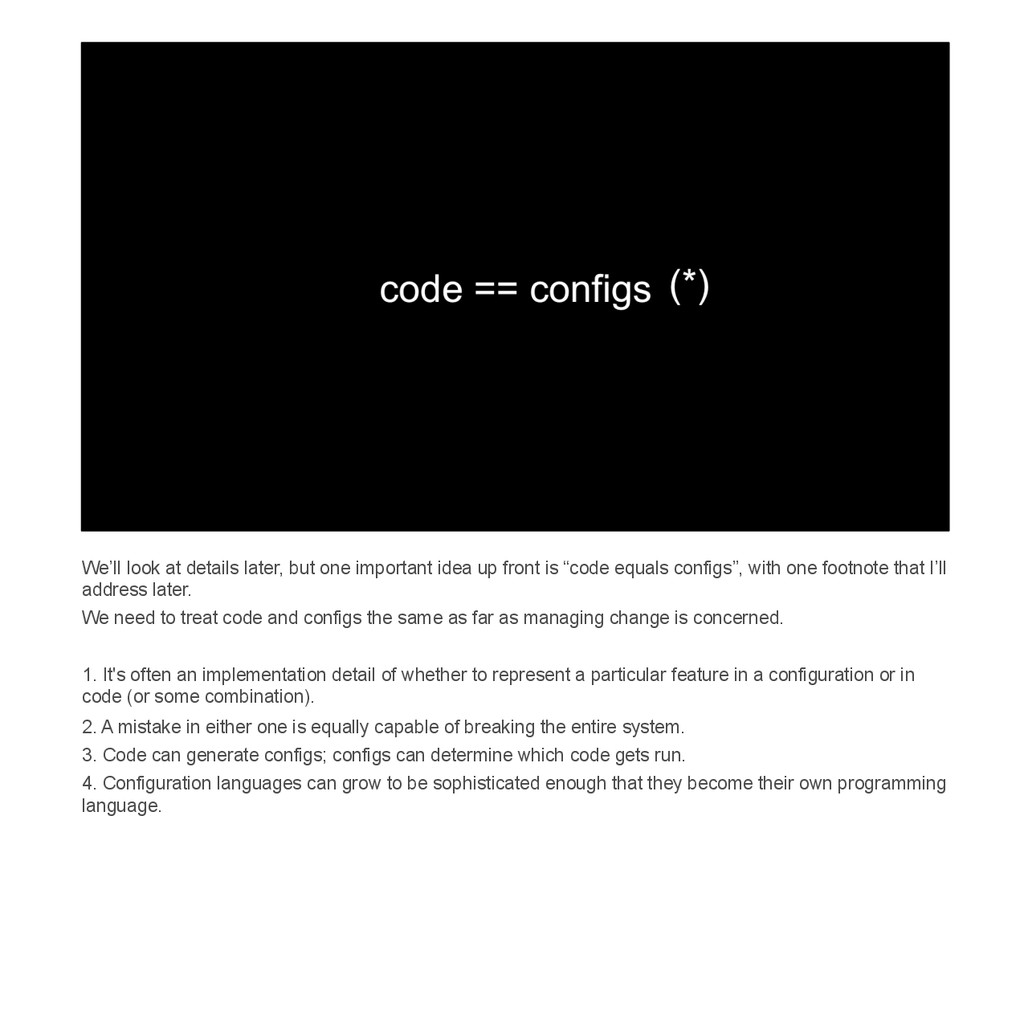
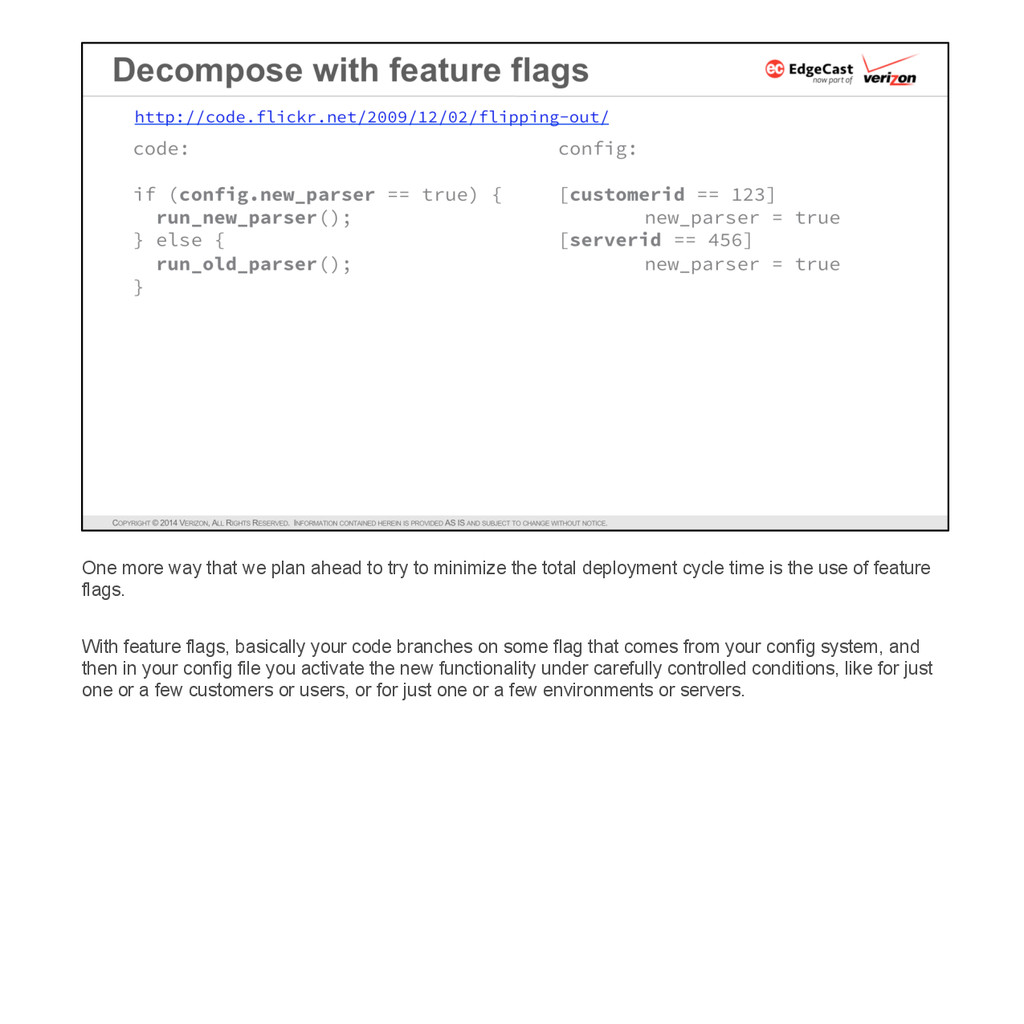
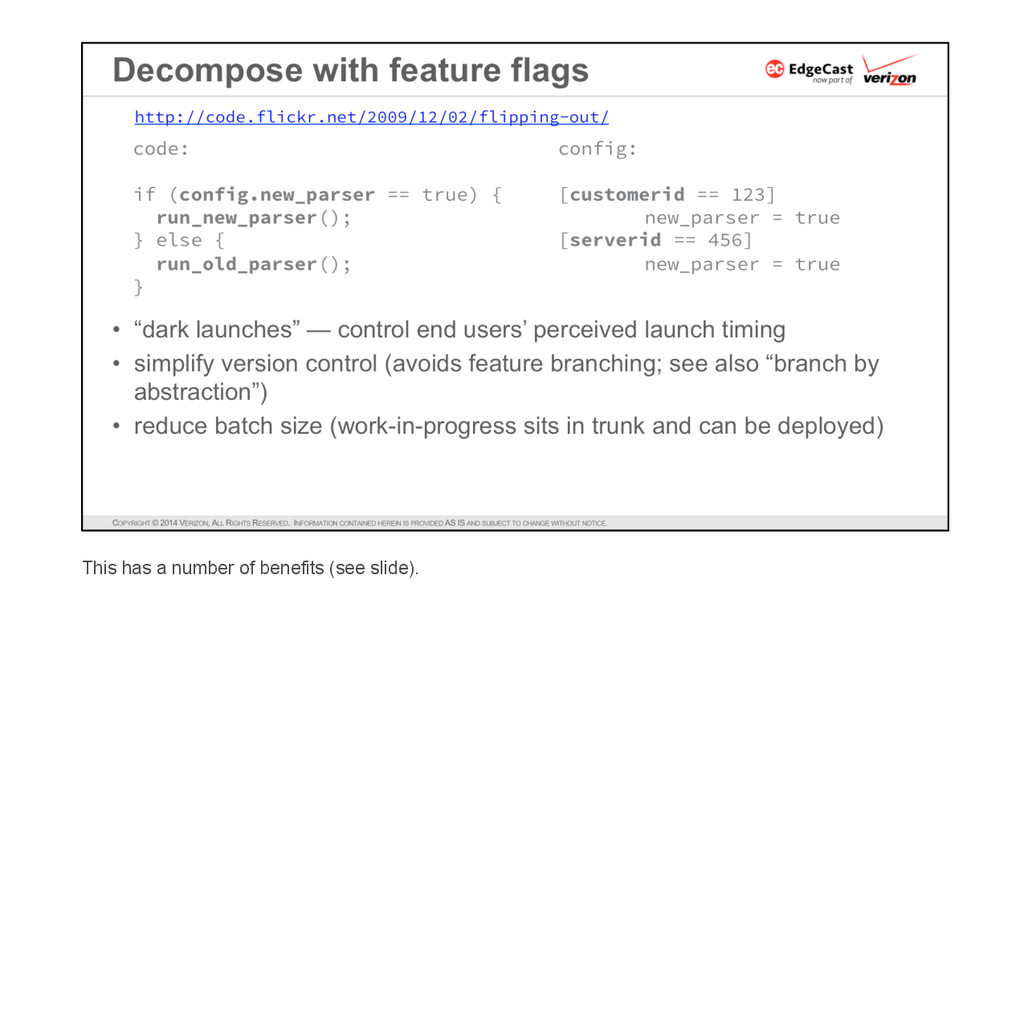
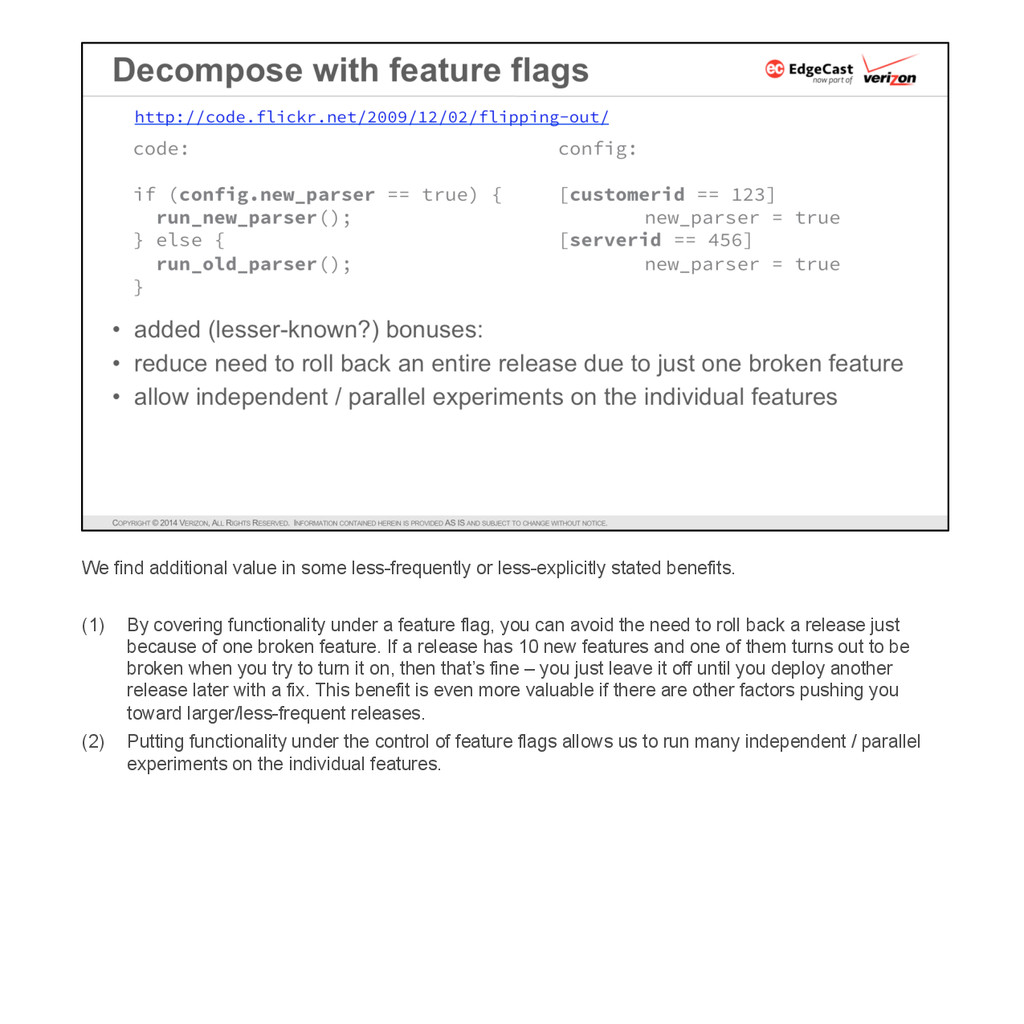
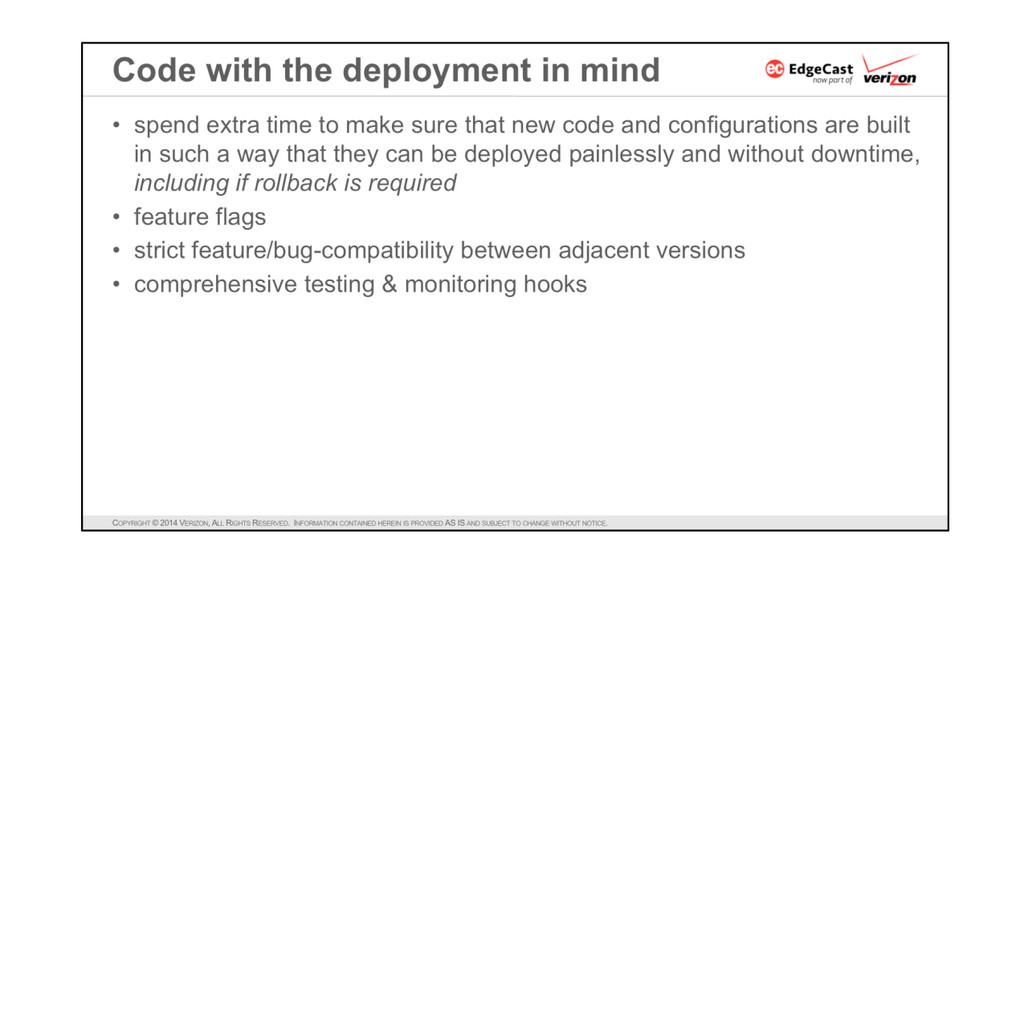
* Be “lazy" — a programmer’s “lazy” can mean spending days building something that turns a 10-second task into a 2-second task. This is exactly the right approach when it comes to deployment, where it means spending extra time to ensure that new code and configurations are built in such a way that they can be deployed painlessly. This often amounts to strict compatibility between the default behaviors of adjacent versions, configurability to easily turn new functionality on/off, and comprehensive hooks for testing and monitoring.
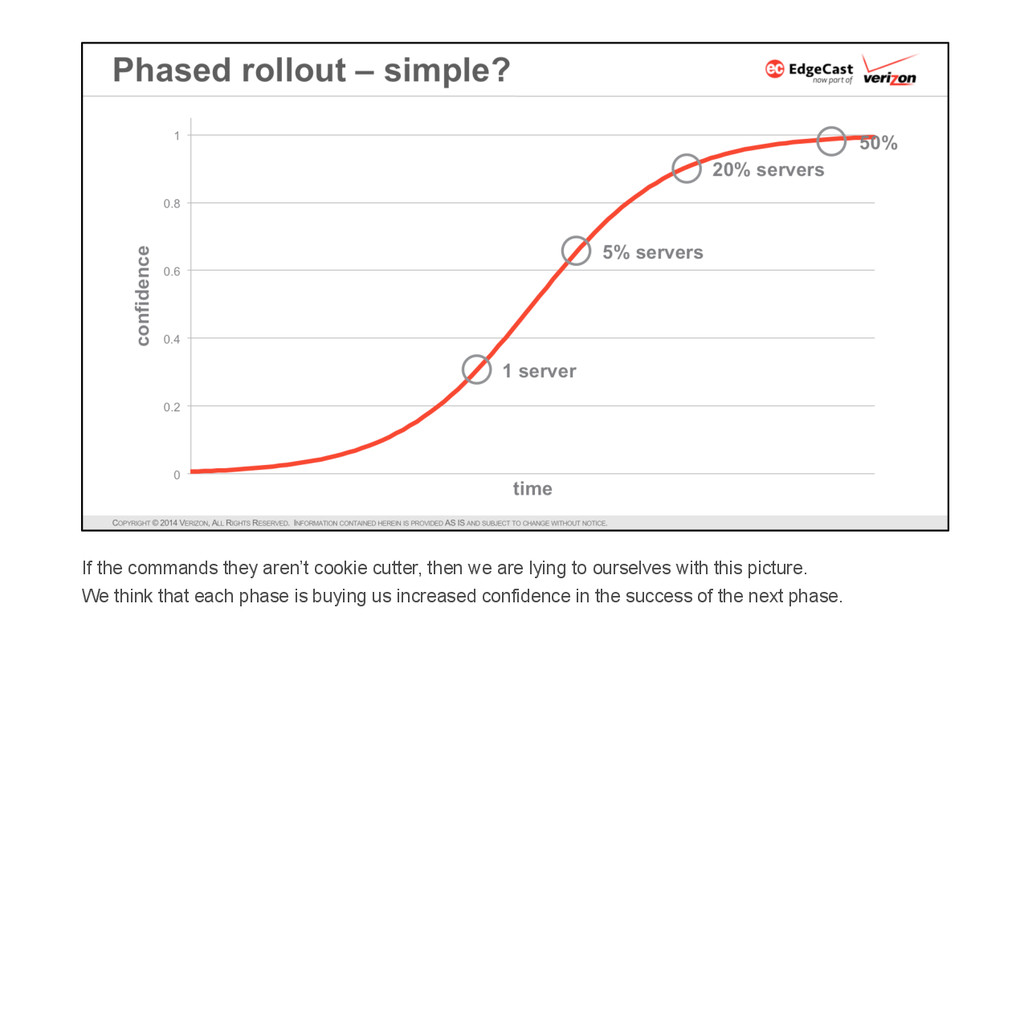
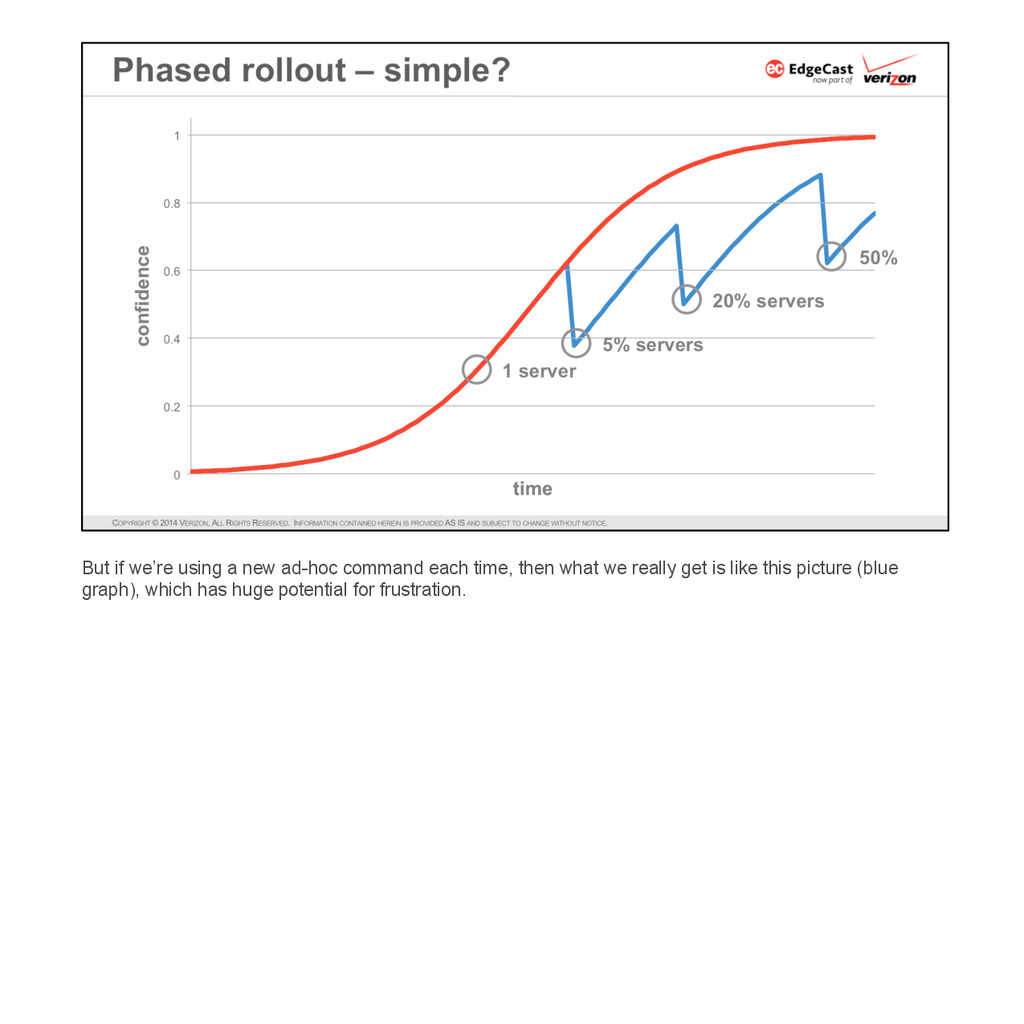
* Minimize risk in the deployment process itself — while each new software update may have different and unique changes, the procedure for deploying the update can be the same every time.
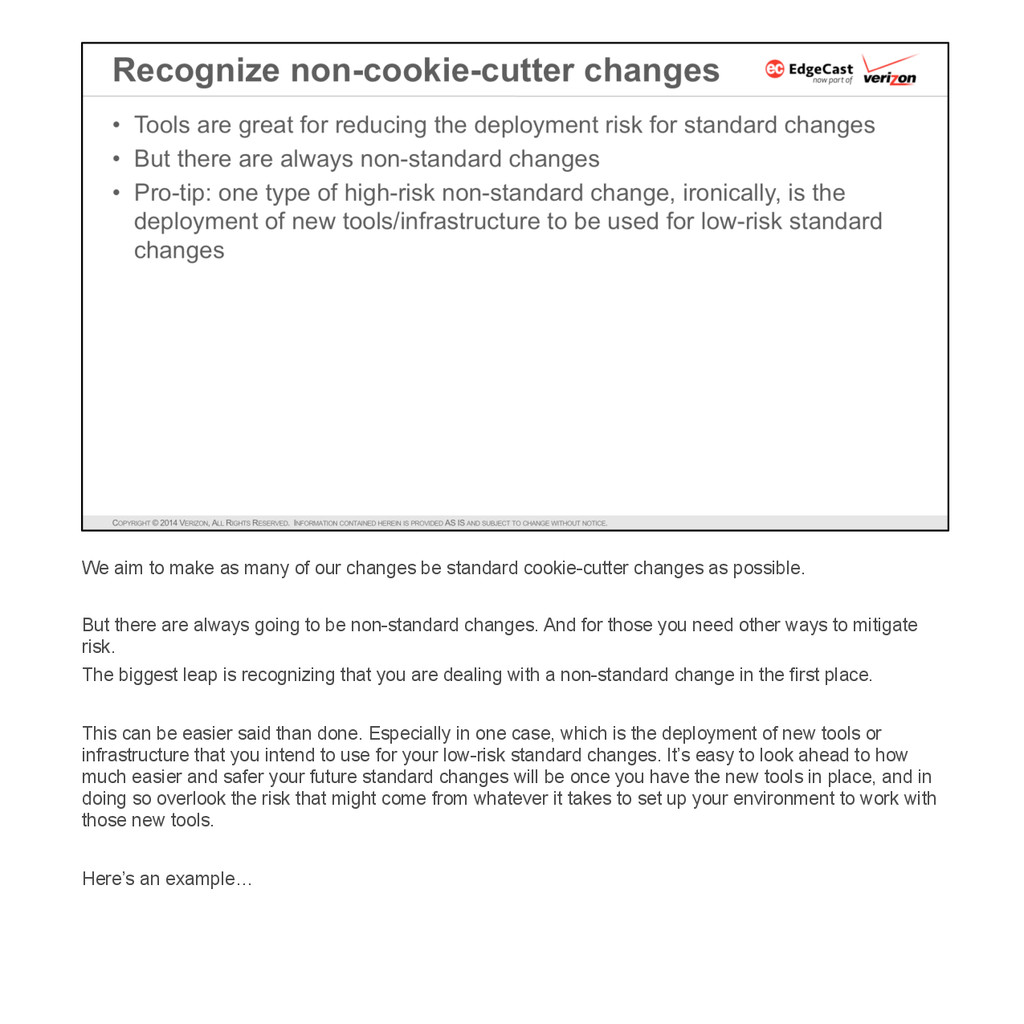
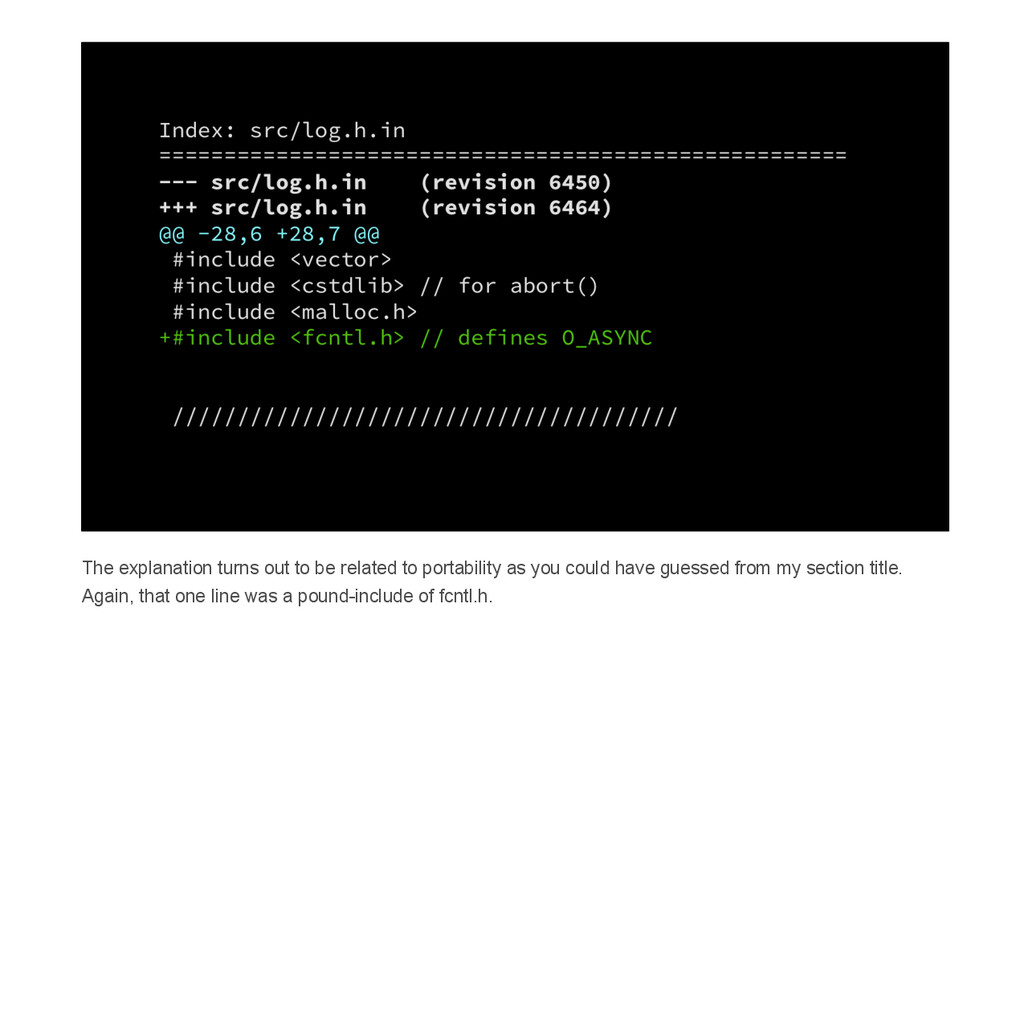
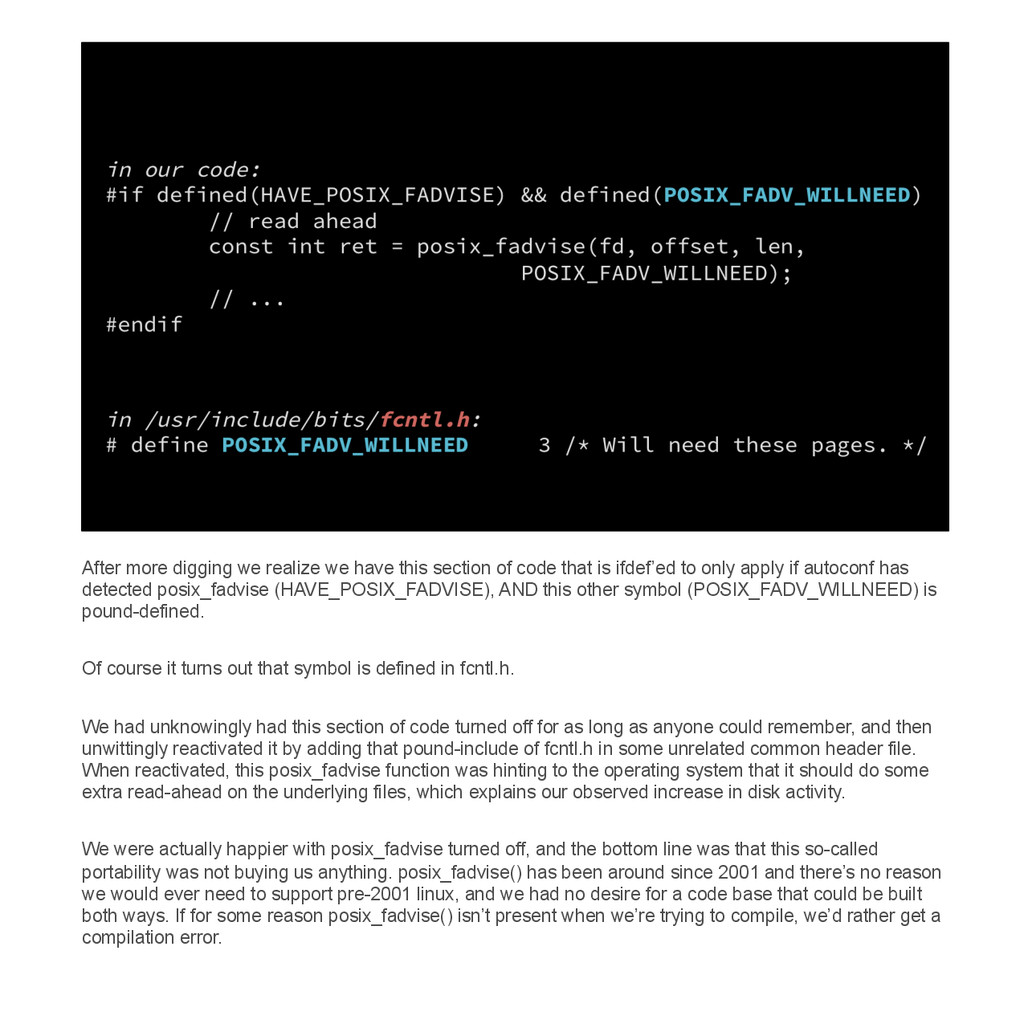
* Don’t be too portable/configurable — if the application should never run in production without package XYZ, then it shouldn’t pretend to be portable to an environment without XYZ.

Rob Peters

September 17, 2014
Tweet

More Decks by Rob Peters

Other Decks in Technology

Transcript

  1. Here is our big picture static architecture. We are a

    global content delivery network, with POPs or datacenters distributed around the world. These provide the edge of our network which delivers content to end users on behalf of our customers, using a number of services like HTTP content and application delivery, live and on-demand streaming, as well as DNS and security.
  2. Here’s a very simplified view of how it looks in

    action. Global load-balancing directs end users to connect to one of our edge POPs, which delivers content to the users. The edge POPs contain heavy-duty network gear like core routers and load balancers, as well as farms of edge servers for delivering content. The edge servers are caches, which pick up their content from customer origin servers. Meanwhile customer operators and CDN operators talk to our back-office POP, which provides portals and administrative tools and monitoring facilities, and which in turn communicates with the edge POPs.
  3. We’ll be focusing on the edge POPs and specifically on

    the edge servers that actually deliver content to end-users.
  4. On the one hand we have the stock pieces of

    a linux distribution, like the kernel, core libraries, and standard daemons.
  5. And on the other hand we have things that we

    create ourselves, which include a custom kernel, some of our own helper applications, plus the core edge application that talks with end users. And in addition to that we maintain configs for all of those facilities plus configs for the standard OS facilities like cron and rsyslog. Now stability is very important for these edge servers, but on the other hand we have changes that need to land in each one of these boxes.
  6. we have network-level environment information about IP addresses, peer servers,

    flowing out order of 100 times a day we have configuration changes that our customers make through our portal 100 times a day we have general app configs going out 1-10 times a week we have changes to helper apps + glue flowing out a few times a week we have core application code going out one to a few times per month we have custom updates to our kernel coming in a couple times per year and occasionally we need to upgrade the entire OS distribution
  7. We’ll look at details later, but one important idea up

    front is “code equals configs”, with one footnote that I’ll address later. We need to treat code and configs the same as far as managing change is concerned. 1. It's often an implementation detail of whether to represent a particular feature in a configuration or in code (or some combination). 2. A mistake in either one is equally capable of breaking the entire system. 3. Code can generate configs; configs can determine which code gets run. 4. Configuration languages can grow to be sophisticated enough that they become their own programming language.
  8. The configurations we run inside sailfish in production basically amount

    to a very large and complex program. We have ~500 different configuration options that can be set within a sailfish config. Some of these are very complex (like a load-balancing and failover configuration for a set of origin servers, or a lua script). And all of them can be applied under arbitrary combinations of complex conditions.
  9. So we are essentially running a program with ~1 million

    LOC. That is more lines of code than we have in the actual sailfish application itself. This program effectively has several thousand maintainers (who happen to be our customers), and is updated 100 times per day.
  10. This all leads to one main principle, which is to

    code with the deployment in mind. For me this is DevOps in a nutshell. It’s not about who does what or which team does what. It’s about thinking about how will we actually deploy and operate something before we build it.
  11. We’ll look at some ways that principle has played out

    for us, starting with “go fast, but not too fast”.
  12. How can we go faster? Let’s use this graph facilitate

    discussion. The x-axis is time, running from the time that we dream up some new feature or bugfix, up to the time that we fully deploy that new code to production. And the y-axis issome measure of our confidence that this feature will work as planned and not break everything.
  13. At some point along this curve we have to deploy

    to production, and for our customers’ sake, we’d like to have high confidence at that point. Somewhere there is a threshold (green dotted line) that represents what is acceptable or tolerable to our business and our customers. In practice we never know exactly where the line is, but we know when we cross it because somebody gets unhappy and lets us know.
  14. We do what we can along the way to try

    to boost our confidence.
  15. In order to reap some of the benefits of going

    fast, we want to always strive to tug this curve up and to the left, so that it looks more like this blue curve.
  16. We have two ways to do that. One is to

    make steps faster so that they shift to the left, for instance by investing n a server farm for so our our compile + CI stages can go faster by running in parallel.
  17. Or we can shift things upward, by improving the value

    of the different steps so that they gain us more confidence. We could improve the fidelity of our load tests, or improve our analysis of production metrics so that it has more statistical power. This lets us reach our acceptance threshold more quickly.
  18. Let’s look at our change flows again. These flows all

    start with people interacting with different tools, taking different kind of actions, that each result in changes that ultimately flow to an edge server. How can we make these changes flow safely and efficiently?
  19. We have various kinds of testing involved in each of

    these flows that are appropriate to that type of change.
  20. In one case we were implementing a customized rule on

    behalf of a customer, in the flow represented inside the red box here, like we do frequently. It passed our testing, met this customer’s requirements, and everything looked fine within that box.
  21. The only problem was it broke other customers’ traffic due

    to a typo in a regular expression that we didn’t catch.
  22. In the aftermath we ended up creating a new type

    of testsuite, that we call edgeverify, to help us avoid this problem in the future.
  23. EdgeVerify is an engine that consumes test cases that contain

    a simple JSON specification of an http request, with URL and headers that will be sent to a fully configured sailfish engine, plussome expectations about the response, like status code and headers. We can also make assertions about some other things like cache keys and TTLs.
  24. EdgeVerify gained adoption and we quickly built a substantial set

    of test cases, and updated our procedure so that any of these types of changes should now include a new edgeverify test case if at all possible. This way we can be quite confident that changes for one customer won’t have other negative effects.
  25. We soon realized that this was more broadly useful, and

    what we really wanted to do was reposition edgeverify as you see in this diagram. And in fact we are now using edgeverify in this way, automatically gating all sorts of changes from getting out into production. This is on top of whatever other testing might be specific to the particular change flow pipeline.
  26. Here’s an example of the kind of message we get

    if edgeverify catches a problem.
  27. So edgeverify is one of those things that helps us

    boost this point upward. It gives us more confidence before the point where new code first enters production Next we’ll look at how we try to make this second half of the curve as smooth + efficient as possible, where we are going from the first appearance in production, all the way through to full deployment.
  28. The main idea is that we treat each deployment as

    an experiment, in a scientific sense of having a null hypothesis.
  29. Here’s our the basic experimental design. We split a set

    of servers into control+test groups, which are hopefully well-matched. Then at some point we apply a new version of code or configs to the test group, and we look at the time periods before and after that change. So we have these 4 boxes’ worth of data to consider.
  30. Here’s a graphical representation of that kind of experiment, where

    the CONTROL group is in green, and the TEST group is in red, and the blue line is the divider between the two time periods. There’s an obvious change with the TEST group, which happened to be an expected change in this case. But usually our expectation is that most things in the metrics should not change. How do we know if that expectation has been met? It’s typically not as clear as this example.
  31. Here’s another example showing A/B graphs for several different metrics

    around a change point. It’s hard to tell whether this change broke anything? There’s an increase in the TEST group in this metric for server health based on response time (upper left graph). The Round Trip Time values for both groups dipped after the change (lower left graph). And the two groups’ rate of 400-level http status codes diverged after the change (upper right graph). Actually there was no change at all in this case; this is just background noise in the metrics, and the resulting ambiguity is just a reality we have to deal with.
  32. So this is a factor that tends to push us

    toward going slower, so that we can have the right level of confidence. How slow is slow enough?
  33. We have to wait long enough to make sure our

    deployment has had a chance to be exposed to all the things that might potentially have bearing on its functioning.
  34. If it’s a change in one of these bottom layers,

    our wait time is probably pretty short, because the scope of things that could possibly break is restricted to that box. That’s not to say that potential breakage might not be severe, but still if anything does break we’ll probably know about it very quickly.
  35. But if it’s a change in one of these more

    fundamental pieces, then we might have to wait longer. If we’re deploying a kernel, then in theory almost anything at all could break.
  36. Here’s an example of that where we found where it

    took a lot of waiting before things broke, but when they did, they broke in a bad way. This was a kernel bug involving a 64-bit counter that was counting number of nanoseconds since boot. This counter was wrapping around to 0, and causing a divide-by-zero error in kernel space, which is just a hard crash. It’s supposed to wrap around at 2^64 nanoseconds, or 585 years (don’t run this kernel version if you’re aiming for some sort of uptime record). But with this bug it was actually wrapping at 2^54 nanoseconds, which is a much more down-to-earth 208 days. So this is an argument for going a bit slow with your kernel upgrades. You definitely wouldn’t want your entire server farm booted into this particular kernel at the same time.
  37. What are some more typical categories of “all the things”

    that we need to wait for? The big area is just customer + end-user traffic cycles, of which we see a huge variety. Here’s one customer’s traffic variations over a week, which is a stereotypical “nice” case that is almost sinusoidal and has not much change from day to day.
  38. Here’s a different customer who has a baseline daily oscillation

    like the last one, but that’s obviously dwarfed by a couple giant spikes that go up to almost 10x the normal daily peak. We are not concerned about having capacity to handle the magnitude of these spikes, but they do present a challenge to our deployment-science experiments. They indicate that the workload being performed by our edge servers is changing very dynamically, and, from the perspective of our A/B experiment, unpredictably.
  39. Here’s an example of a different type of metric, looking

    at the average percentage of http requests that resulted in a 400-level status code across servers in one pop. The line is remarkably flat across this period of 4 weeks, except for this one day that has a big spike up to about 4x normal levels. This could indicate a problem with some customer’s authentication that resulted in extra 403s. Or it could be some content got misplaced on a customer’s origin, resulting in extra 404s. Again the bottom line is that this shows the edge servers are exposed to a very different workload at that point.
  40. Geography provides one more example of workload diversity across edge

    servers. Each point here represents one POP, and they are color-coded by continent. One on axis here we have kB delivered per http request, which is some indicator of the typical content profile being requested of that POP. On the other axis we have % of TCP segments that are retransmitted, which is an indicator of the quality of the end-to-end connection between our datacenters and the end users. The actual values don’t really matter here, but the point is that POPs in different continents cluster into different areas of this scatter plot, which again indicates different edge server workloads. That means we need to take geographical differences into account as we are deploying changes; in fact we’ve had experiences where latent bugs end up exposed only in one geographical region.
  41. We have to go slow to wait for “all the

    things” to possibly happen; part of the problem is that we don’t have a lot of statistical power in the yellow box here. Because the two server groups are not perfectly matched. And the two time periods are not perfectly matched.
  42. So we have gone to fairly extensive lengths to build

    a live replay system called Ghostfish, which our lead research scientist Amir Khakpour presented this at Velocity Santa Clara earlier this year. Ghostfish allows us to sample from production systems, and replay it in real-time to multiple groups of test servers. This allows us to have identical traffic going to one group with the old code and another group with the new code.
  43. This has two major benefits: (1) It brings more realism

    into a test environment, so we can do more of our confidence-building before we touch production, and shift the “first time in prod” point upward. (2) It gives us a more statistically efficient (that is, faster) way to discern whether the new version is behaving properly so we can shift this point to the left.
  44. One more way that we plan ahead to try to

    minimize the total deployment cycle time is the use of feature flags. With feature flags, basically your code branches on some flag that comes from your config system, and then in your config file you activate the new functionality under carefully controlled conditions, like for just one or a few customers or users, or for just one or a few environments or servers.
  45. We find additional value in some less-frequently or less-explicitly stated

    benefits. (1)  By covering functionality under a feature flag, you can avoid the need to roll back a release just because of one broken feature. If a release has 10 new features and one of them turns out to be broken when you try to turn it on, then that’s fine – you just leave it off until you deploy another release later with a fix. This benefit is even more valuable if there are other factors pushing you toward larger/less-frequent releases. (2)  Putting functionality under the control of feature flags allows us to run many independent / parallel experiments on the individual features.
  46. And that’s our final key principle in our approach to

    going fast. This is the footnote to my earlier “code == configs” comment. Code changes have to be serialized; config changes can be parallelized. If we are deploying a release with 10 new features, we do one experiment as we deploy (as quickly as possible) the code itself with all 10 features off. Then, we can start potentially 10 new experiments in parallel to test the effects of turning on the new features. In the meantime, we can also start the next code deployment. This is very important for us because the timelines for the different experiments may vary widely. Some of those experiments only need a day, while others we’d like to run for months or even years at a time.
  47. At Velocity NY last year (2013), I used this analogy.

    There’s a saying in software development that you can’t fix a bug until you can reproduce it, and that in fact reproducing it is the really hard part. The fix is easy once you can reproduce it.
  48. The analogy in web performance is that you can’t fix

    a problem until you can visualize it clearly.
  49. These days it seems we all have a lot of

    measurements that we can potentially visualize, but visualizing them clearly might be tricky. For the edge servers that we’re focusing on today, we have around 10 billion samples per month, feeding into about 2 million unique time series of data. As many other people have said, the challenge in this scenario is making sense of all this data. I’ll mention a few ideas that have helped us in that area.
  50. You need to mature your measurement streams. Basically this means

    that you need to think about taking your existing data streams, and weaving them together with your hard-fought operational experience into new, more refined data streams and tools.
  51. At Velocity in Santa Clara this year (2014) I presented

    this Measurement Maturity Model which describes a pattern we have seen repeatedly in the evolution of measurement streams, and of the tools we use to view and interact with those streams. First stage: you are capturing data on the fly and doing ad-hoc analysis – like tcpdump Second stage: you now have automatic data recording – like access logs Third stage: you add automated aggregation and visualization – like graphite or statsd Fourth stage: you have proactive alerting or notifications Fifth stage: you have some sort of self-healing or self-adapation The idea is that measurements that are useful will tend to evolve toward later stages. And, by being aware of this model or pattern, you can build tools + systems to help facilitate that evolution.
  52. This ties in closely with efficient deployments because we need

    quality production measurements in order to make these later stages go quickly and smoothly. How do measurement streams evolve?
  53. From that kind of raw data we can manually generate

    some graphs to help us understand causes + effects.
  54. We can build tools to get visualizations across all the

    servers. We call this one our “live grid” which shows a current snapshot of many metrics across a set of servers and provides deep links into our historical trending/graphing system.
  55. For instance this type of tool that looks for time

    series that correlate strongly with each other. This example showing a strong correlation between server response time and how busy the disk was. These tools are great for drilling down to understand specific problems. But they aren’t so great for letting us know whether there’s a problem in the first case, because there’s just too much to look at.
  56. So for day-to-day operations, outside the context of any particular

    change, we need to focus on vital signs. When you visit a doctor, they don’t start off running an MRI and X-Ray and sending 10 vials of blood in for comprehensive labs. Instead they just take your vital signs – temperature, blood pressure, pulse, and then follow up if needed. And there’s a good reason – if they run all those extra tests, it’s not only expensive, but also bound to produce more false positives which just lead to unnecessary further testing, which leads to alert fatigue.
  57. So we use this kind of dashboard to keep track

    of just a few vital signs (which are the columns across the top), and watch the handful of servers that are showing up out of bounds for one those vital signs.
  58. We want to simplify the process, or in other words

    we want to be “lazy”, according to a programmer’s definition. Which means that we are willing to spend days and days coding something that will turn a 2-hour task into a 1-hour task. But if it saves us that hour during a critical time, like during a deployment, AND makes the resulting work safer, more typo-proof, then it’s definitely worth it. The point is that we’re actively managing the complexity, moving it around so that we make specific parts simple.
  59. Coding with the deployment in mind can be represented with

    an airport metaphor. We want to code with the deployment in mind, just like a pilot and crew need prepare with the runway in mind; they need to do a lot of work before they hit the runway. Once they are on the runway, that is precious real estate, they have only 30 seconds there, so they had better be ready to go and get the job done quickly, or if necessary get back off the runway ASAP. They shouldn’t just get on the runway, then go a little ways forward, maybe stop and look at why some indicator lights aren’t working, then maybe back up a little bit, try out a new type of wing, start over a few times… That is bad not only for the safety of their own flight, but also bad because they are blocking everyone else who wants to use the runway. Just like how code changes are generally serialized.
  60. So, part of the preparation is planning a strategy to

    get off the runway real quick if necessary.
  61. We learned that lesson the hard way; here’s how one

    deployment looked that involved a painfully slow rollback. (See details on slide.)
  62. A simple fix was just to keep multiple versions of

    the app code stored on the server at all times. We move the slow svn part up front, before any roll-forward or potential roll-back. Then we indicate the desired version somewhere in a config system, like just in a simple flat file in this case. We need a slightly smarter version of sailfish.sh that knows how to find the app code in an appropriate subdirectory. If/when we need to revert, the old code is still around and reloading into the old rev is just as fast as it was to load the new rev.
  63. On the topic of simplifying the process, let’s revisit phased

    rollouts. The idea is that, after we’ve done everything else at our disposal to maximize our confidence in this new release, we start releasing it to production. We go gradually, in multiple steps, to again minimize exposing end users to potentially buggy code. Our confidence increases as we have success with larger and larger sets of servers until eventually it is deployed fully. Is this a simple process?
  64. If we take a plan like the one written down

    here (“deploy to 1 server, then 5%, then 20%, …”) and give that plan to 5 different engineers who are all experts with the overall system, we might end up with 5 different sets of commands to actually implement that plan. So if we want to know whether we have a simple plan, we need to ask a few questions: Are we using the same command for each step of the plan? How much redundant information has to be entered for each step? If we are deploying a new code version, do we have to mention that code version again in each of the 5 steps? What if we typo the code version 1 out of the 5 times? And each time we do a phased rollout, or for each person who executes a phased rollout, is it done the same way? We’d like these commands to be as cookie-cutter as possible. Why?
  65. If the commands they aren’t cookie cutter, then we are

    lying to ourselves with this picture. We think that each phase is buying us increased confidence in the success of the next phase.
  66. But if we’re using a new ad-hoc command each time,

    then what we really get is like this picture (blue graph), which has huge potential for frustration.
  67. So each step of phased rollout must use the same

    action. That isn’t to say that we can’t improvise using our expertise, especially when something unexpected happens; rather we want to at least have a plan that doesn’t require improvising.
  68. We aim to make as many of our changes be

    standard cookie-cutter changes as possible. But there are always going to be non-standard changes. And for those you need other ways to mitigate risk. The biggest leap is recognizing that you are dealing with a non-standard change in the first place. This can be easier said than done. Especially in one case, which is the deployment of new tools or infrastructure that you intend to use for your low-risk standard changes. It’s easy to look ahead to how much easier and safer your future standard changes will be once you have the new tools in place, and in doing so overlook the risk that might come from whatever it takes to set up your environment to work with those new tools. Here’s an example…
  69. This is a standard change, assuming you caught the earlier

    metaphor about preparing for deployments ahead of time, just like preflight checks.
  70. This is not a standard change. This is building a

    whole new runway. What you especially don't want to do, if you are a pilot, is stop in the middle of your takeoff and start poking around trying to upgrade the runway And I say that as someone who has tried upgrading the runway while in the middle of takeoff (metaphorically speaking).
  71. Here’s one last way to look at it. Use a

    simple tested process is safe (relatively speaking). Changing the process, even if it’s to make it simpler and safer, is risky. That doesn’t mean it shouldn’t be done, just you have to be prepared for the risk.
  72. Here’s one last message about simplifying: forget about portability. At

    least, forget about portability that you aren’t actually using.
  73. Here’s our example. We are deploying a new version of

    sailfish and we find this in our A/B comparisons. This is showing us that under the new sailfish version, our disks are about 20% busier. There isn’t an immediate performance impact, but we need to understand this. We go back and re-review all the code diffs that went into this release, looking for anything that could seem plausibly related to increased disk activity. And there’s nothing. Eventually we resort to brute force, and try a binary search through version control history to narrow down the candidate changes.
  74. And eventually that is fruitful, and leads us to this

    one line change. Obviously a really horrible line of code, right? This one change is somehow causing that change in disk activity. At this point we are reminded of the only valid measurement of code quality…
  75. The explanation turns out to be related to portability as

    you could have guessed from my section title. Again, that one line was a pound-include of fcntl.h.
  76. After more digging we realize we have this section of

    code that is ifdef’ed to only apply if autoconf has detected posix_fadvise (HAVE_POSIX_FADVISE), AND this other symbol (POSIX_FADV_WILLNEED) is pound-defined. Of course it turns out that symbol is defined in fcntl.h. We had unknowingly had this section of code turned off for as long as anyone could remember, and then unwittingly reactivated it by adding that pound-include of fcntl.h in some unrelated common header file. When reactivated, this posix_fadvise function was hinting to the operating system that it should do some extra read-ahead on the underlying files, which explains our observed increase in disk activity. We were actually happier with posix_fadvise turned off, and the bottom line was that this so-called portability was not buying us anything. posix_fadvise() has been around since 2001 and there’s no reason we would ever need to support pre-2001 linux, and we had no desire for a code base that could be built both ways. If for some reason posix_fadvise() isn’t present when we’re trying to compile, we’d rather get a compilation error.
  77. So we took this as a lesson to go through

    and remove some further similar cases of unnecessary portability in our code bases, like support for building without TLS. In general if you don’t feel the need to build+test your code once with the flag turned off and once with it turned on, then you probably don’t need that portability flag.