Upgrade to Pro
— share decks privately, control downloads, hide ads and more …
Speaker Deck
Features
Speaker Deck
PRO
Sign in
Sign up for free
Search
Search
Code profiling with Xdebug and Kcachegrind
Search
robertbasic
January 28, 2017
Programming
210
0
Share
Embed
Copy iframe code
Copy JS code
Copy link
Start on current slide
Code profiling with Xdebug and Kcachegrind
Slides for an uncon talk I gave at phpbnl17
robertbasic
January 28, 2017
More Decks by robertbasic
See All by robertbasic
All aboard the Service Bus!
robertbasic
1
1.8k
Build your career one contribution at a time
robertbasic
1
79
All aboard the Service Bus @ ZGPHP
robertbasic
0
410
All aboard the Service Bus
robertbasic
1
330
Build your career one contribution at a time
robertbasic
0
160
Profilisanje koda sa Xdebug i KCachegrind
robertbasic
1
220
Mockery
robertbasic
3
830
Zend Framework 2
robertbasic
4
350
Introduction to Zend Framework 1
robertbasic
2
280
Other Decks in Programming
See All in Programming
yield再入門 #phpcon
o0h
PRO
0
790
はてなアカウント基盤 State of the Union
cockscomb
1
1.3k
FDEが実現するAI駆動経営の現在地
gonta
2
230
今さら聞けない .NET CLI
htkym
0
140
全PRの83%がAIレビューだけでマージできるようになった開発組織はその後どうなったか
athug
0
500
AI がコードを書く時代における新卒エンジニアの仕事風景 (2026) / New Graduate Engineers in the Era of AI Coding (2026)
sushichan044
0
240
作るコストが小さくなった時代 幸せに働くために改めて考えたいこと 〜エンジニアとして価値を出し続けるために注視している二分野〜
yuppeeng
0
130
AI時代の仕事技芸論〜ソフトウェア開発で「遊ぶように働く」職人的熟達のすすめ(スクフェス仙台 2026バージョン)
kuranuki
0
730
関数型プログラミングのメリットって何だろう?
wanko_it
0
200
分散システム、なんですぐ死んでしまうん?耐障害性を高めたいあなたのためのレジリエンスパターン入門
mshibuya
7
7k
これからAgentCoreを触る方へ トレンドはGatewayです
har1101
6
510
Go言語とトイモデルで学ぶTransformerの気持ち / fukuokago23-transformer
monochromegane
0
140
Featured
See All Featured
Digital Projects Gone Horribly Wrong (And the UX Pros Who Still Save the Day) - Dean Schuster
uxyall
1
2.1k
Primal Persuasion: How to Engage the Brain for Learning That Lasts
tmiket
0
390
How to Get Subject Matter Experts Bought In and Actively Contributing to SEO & PR Initiatives.
livdayseo
0
160
職位にかかわらず全員がリーダーシップを発揮するチーム作り / Building a team where everyone can demonstrate leadership regardless of position
madoxten
64
56k
Raft: Consensus for Rubyists
vanstee
141
7.6k
Groundhog Day: Seeking Process in Gaming for Health
codingconduct
0
260
The Impact of AI in SEO - AI Overviews June 2024 Edition
aleyda
5
1.1k
The Straight Up "How To Draw Better" Workshop
denniskardys
239
140k
Chrome DevTools: State of the Union 2024 - Debugging React & Beyond
addyosmani
10
1.3k
The Curse of the Amulet
leimatthew05
2
13k
How to Build an AI Search Optimization Roadmap - Criteria and Steps to Take #SEOIRL
aleyda
1
2.1k
My Coaching Mixtape
mlcsv
0
180
Transcript
Robert Basic ~ phpbenelux17 Code profiling with Xdebug and KCachegrind
Robert Basic https://robertbasic.com/ @robertbasic
Robert Basic ~ phpbenelux17 Tools of the trade Xdebug •
Not just for debugging KCachegrind • Visualizing profiling data
Robert Basic ~ phpbenelux17 What’s the fastest code?
Robert Basic ~ phpbenelux17 The code that’s not called!
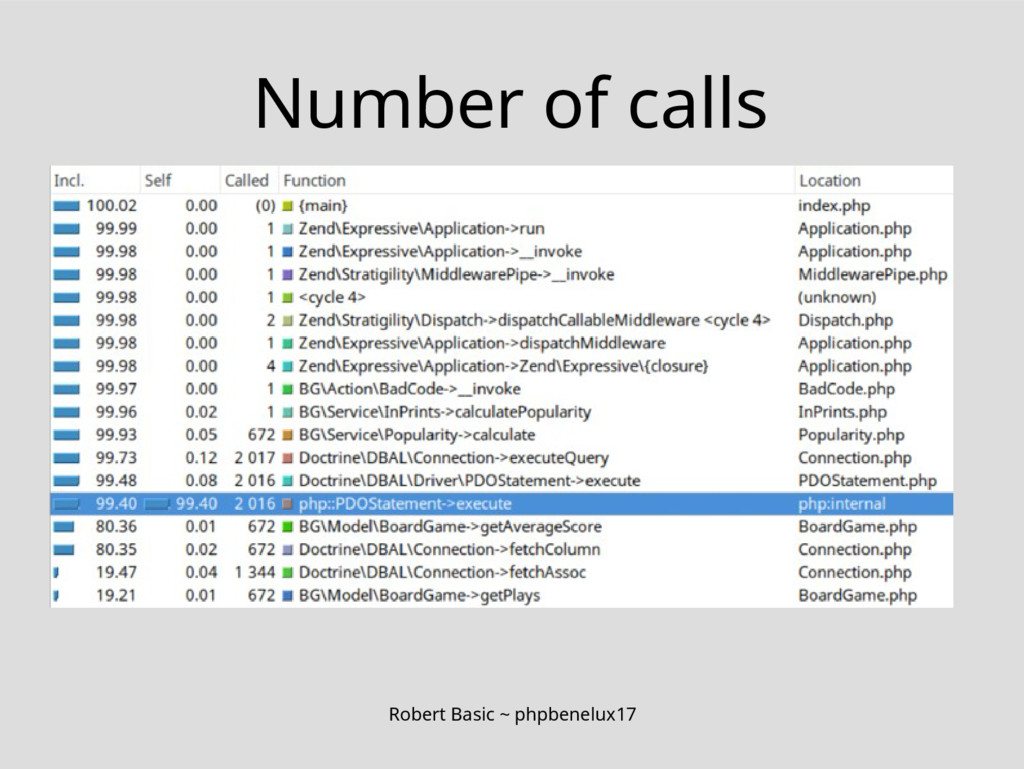
Robert Basic ~ phpbenelux17 Number of calls
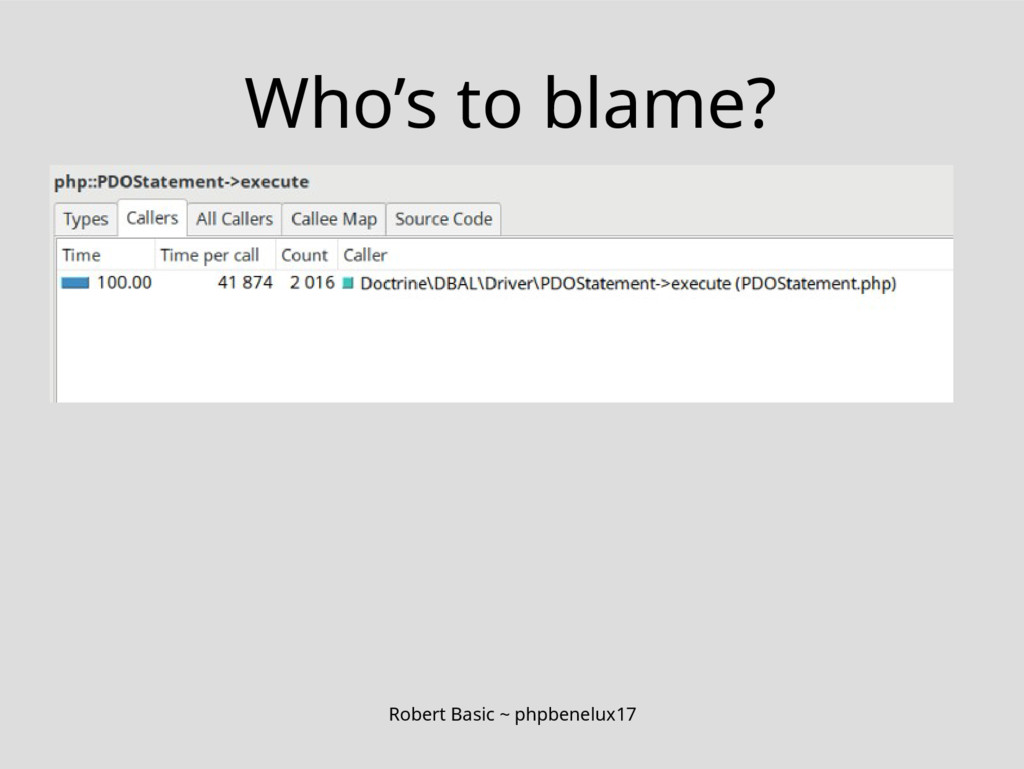
Robert Basic ~ phpbenelux17 Who’s to blame?
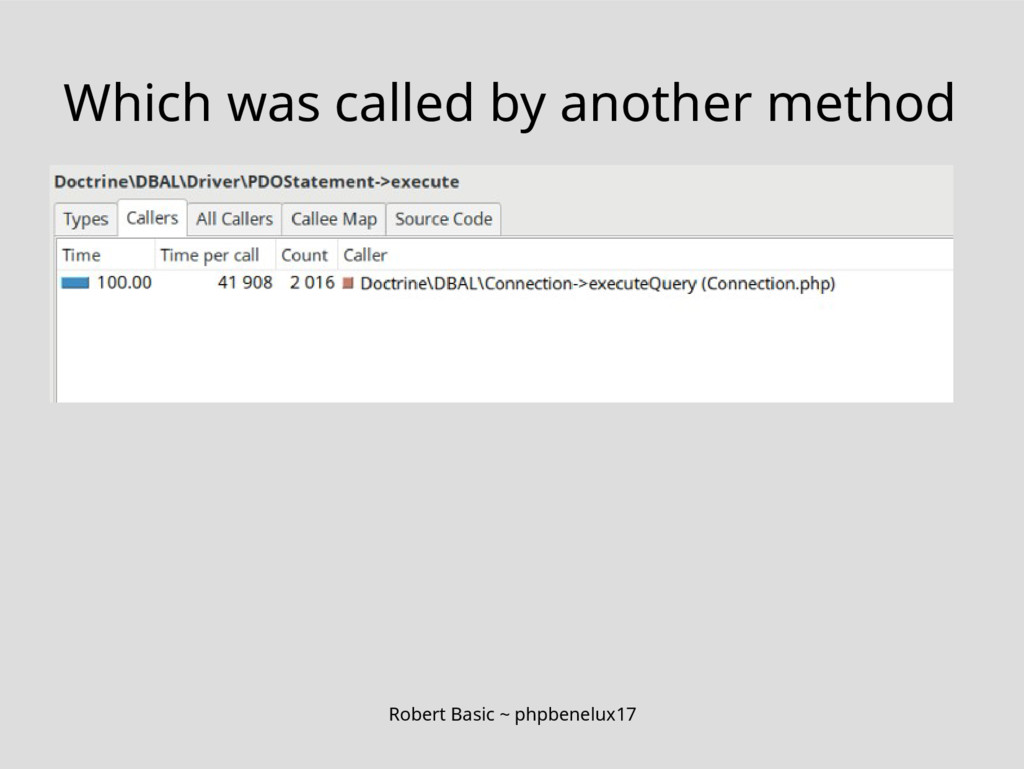
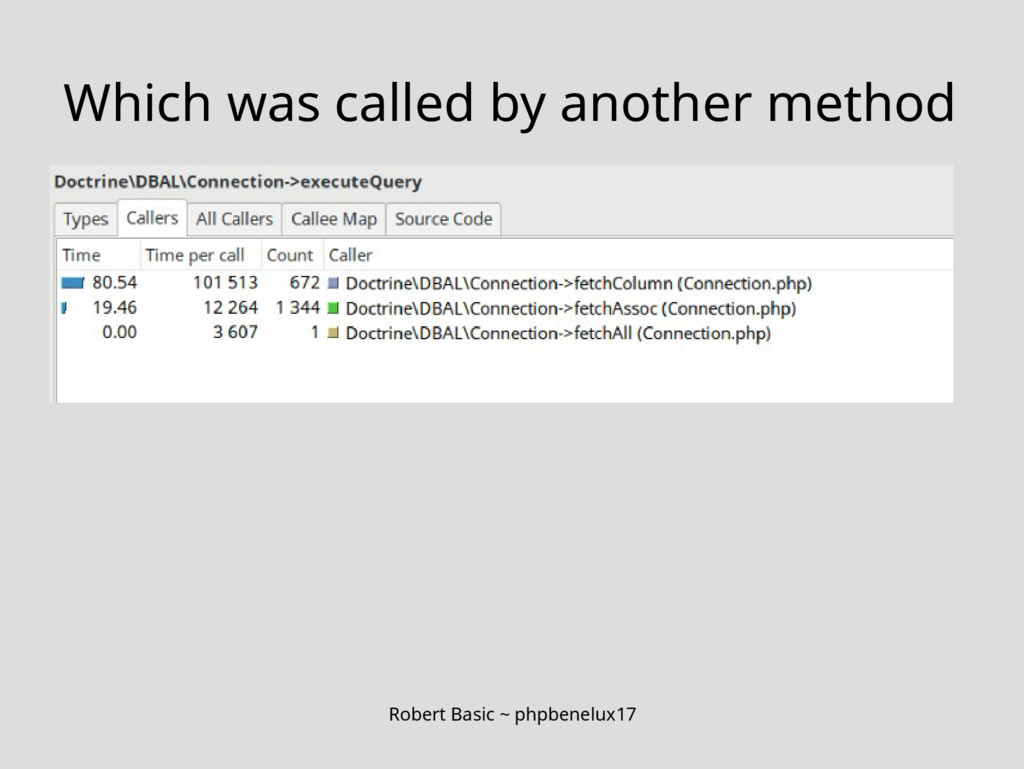
Robert Basic ~ phpbenelux17 Which was called by another method
Robert Basic ~ phpbenelux17 Which was called by another method
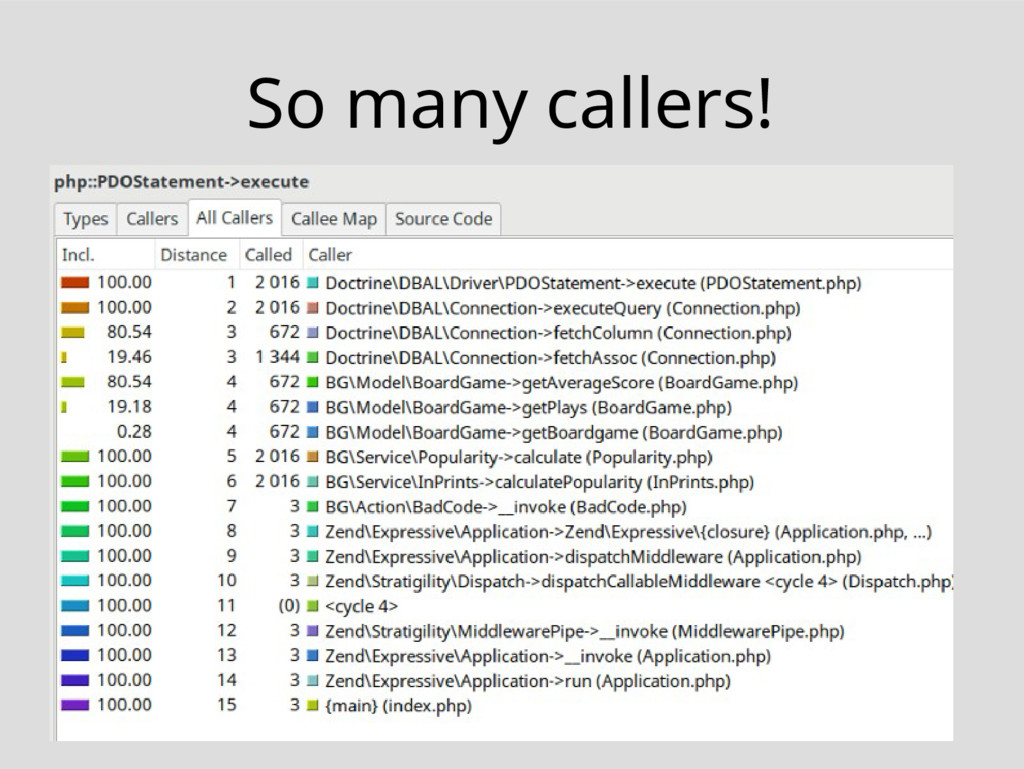
Robert Basic ~ phpbenelux17 So many callers!
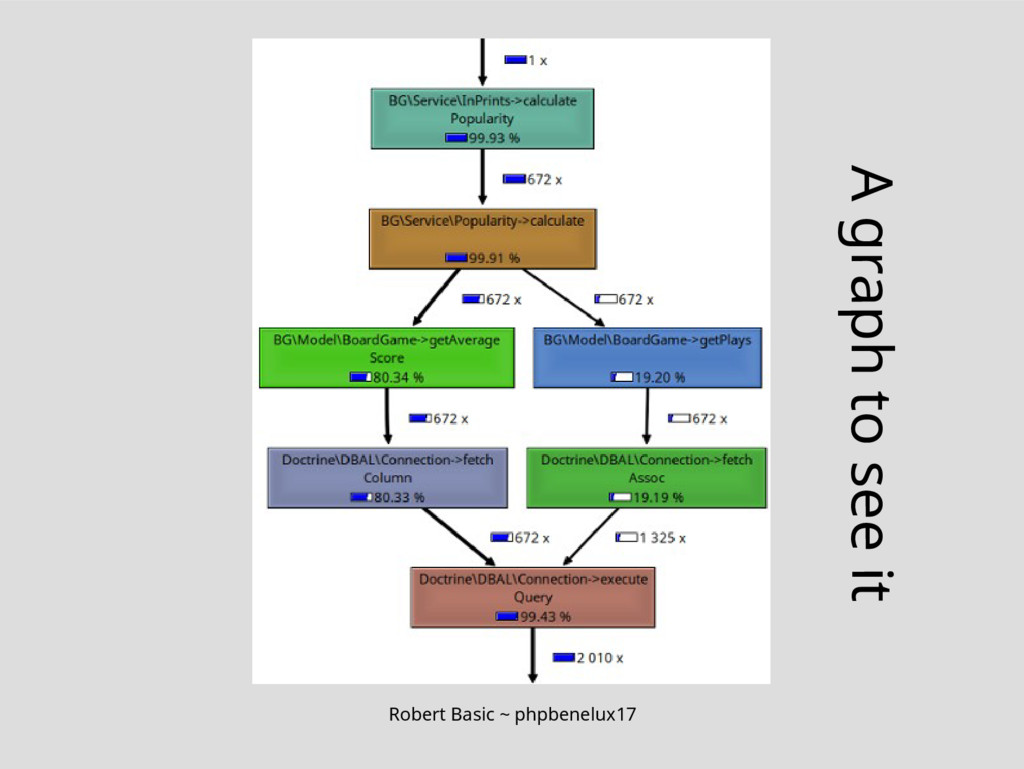
Robert Basic ~ phpbenelux17 A graph to see it
Robert Basic ~ phpbenelux17 Context to understand it
Robert Basic ~ phpbenelux17 Fix it This is really up
to you
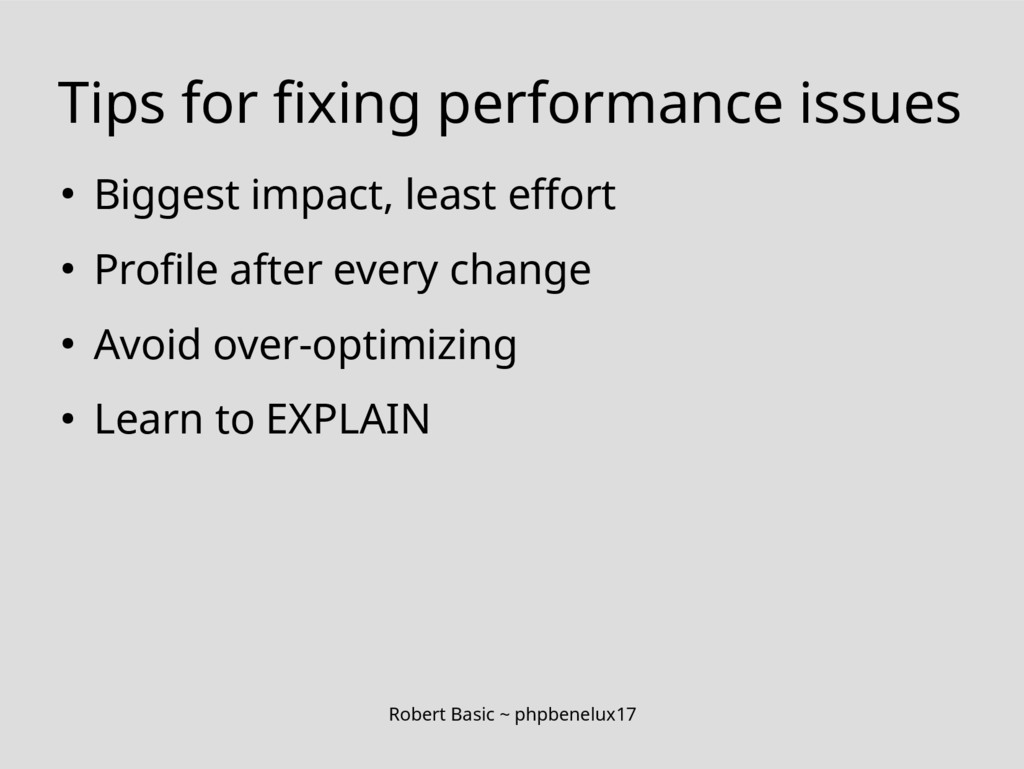
Robert Basic ~ phpbenelux17 Tips for fixing performance issues •
Biggest impact, least effort • Profile after every change • Avoid over-optimizing • Learn to EXPLAIN
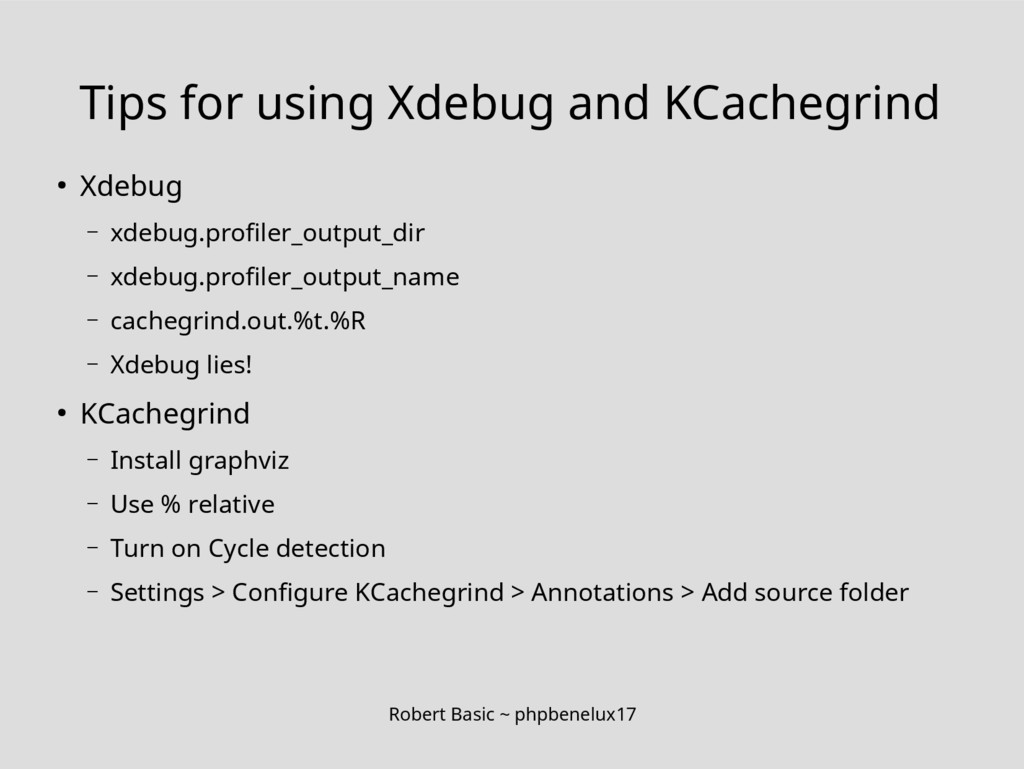
Robert Basic ~ phpbenelux17 Tips for using Xdebug and KCachegrind
• Xdebug – xdebug.profiler_output_dir – xdebug.profiler_output_name – cachegrind.out.%t.%R – Xdebug lies! • KCachegrind – Install graphviz – Use % relative – Turn on Cycle detection – Settings > Configure KCachegrind > Annotations > Add source folder
Robert Basic ~ phpbenelux17 Other tools • WinCacheGrind, Webgrind •
XHProf • Blackfire.io
Robert Basic ~ phpbenelux17 Thanks! Questions?