and risks Robin Lovelace, University of Leeds 5th June, Daytime Population Movements Workshop @ University of Leeds. Slides Available: robinlovelace.net
revolution More data than ever before Most growth in 'big data' Or rather 'V data': • High Volume • High Velocity • Highly Variable Continuing rush to access this data
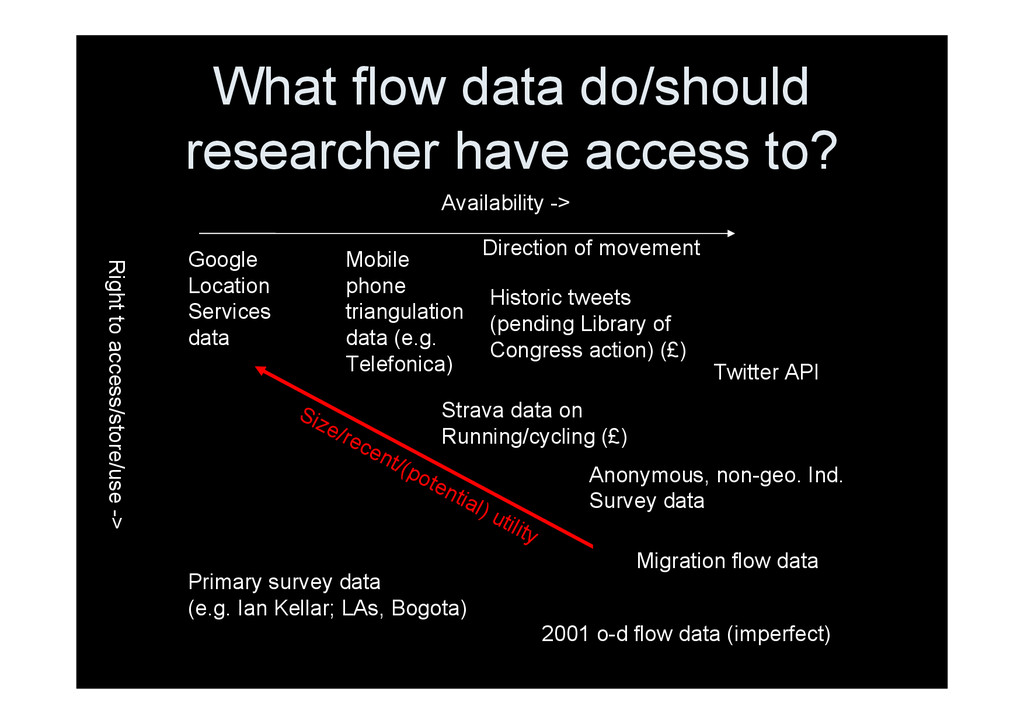
Right to access/store/use -> 2001 o-d flow data (imperfect) Twitter API Historic tweets (pending Library of Congress action) (£) Mobile phone triangulation data (e.g. Telefonica) Strava data on Running/cycling (£) Migration flow data Anonymous, non-geo. Ind. Survey data Google Location Services data Primary survey data (e.g. Ian Kellar; LAs, Bogota) Size/recent/(potential) utility Direction of movement
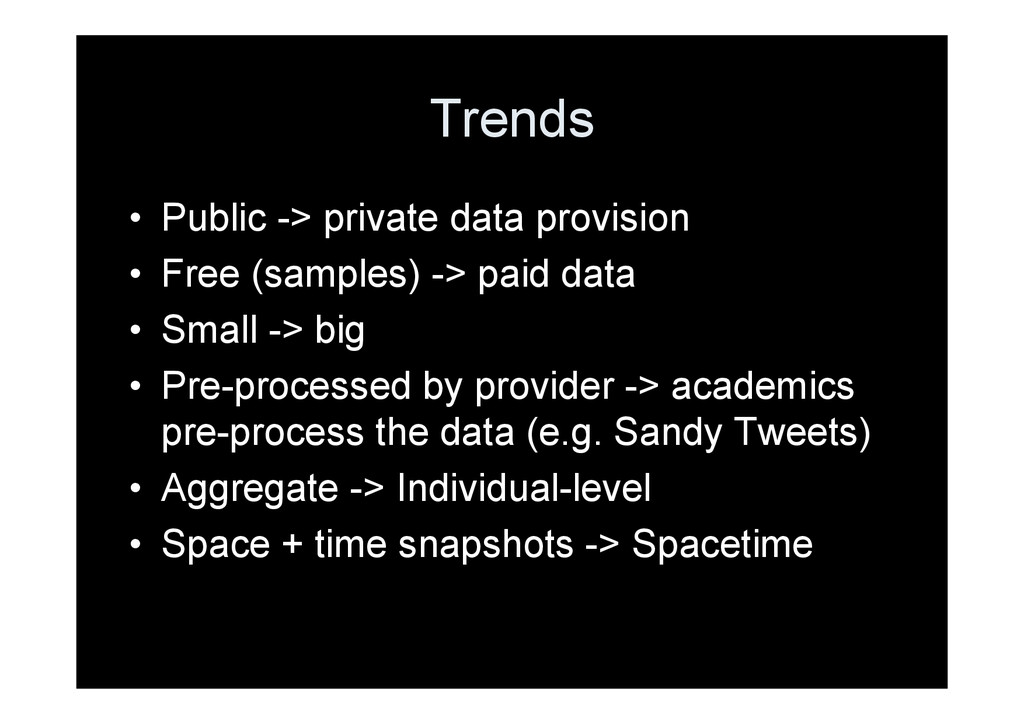
-> paid data • Small -> big • Pre-processed by provider -> academics pre-process the data (e.g. Sandy Tweets) • Aggregate -> Individual-level • Space + time snapshots -> Spacetime
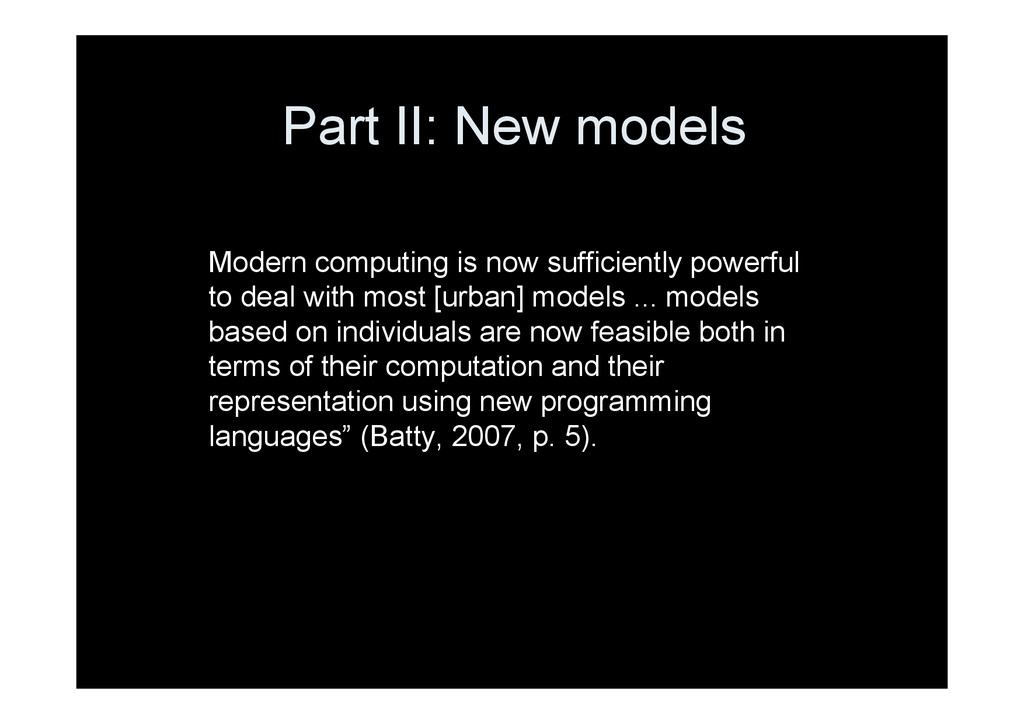
to deal with most [urban] models ... models based on individuals are now feasible both in terms of their computation and their representation using new programming languages” (Batty, 2007, p. 5).
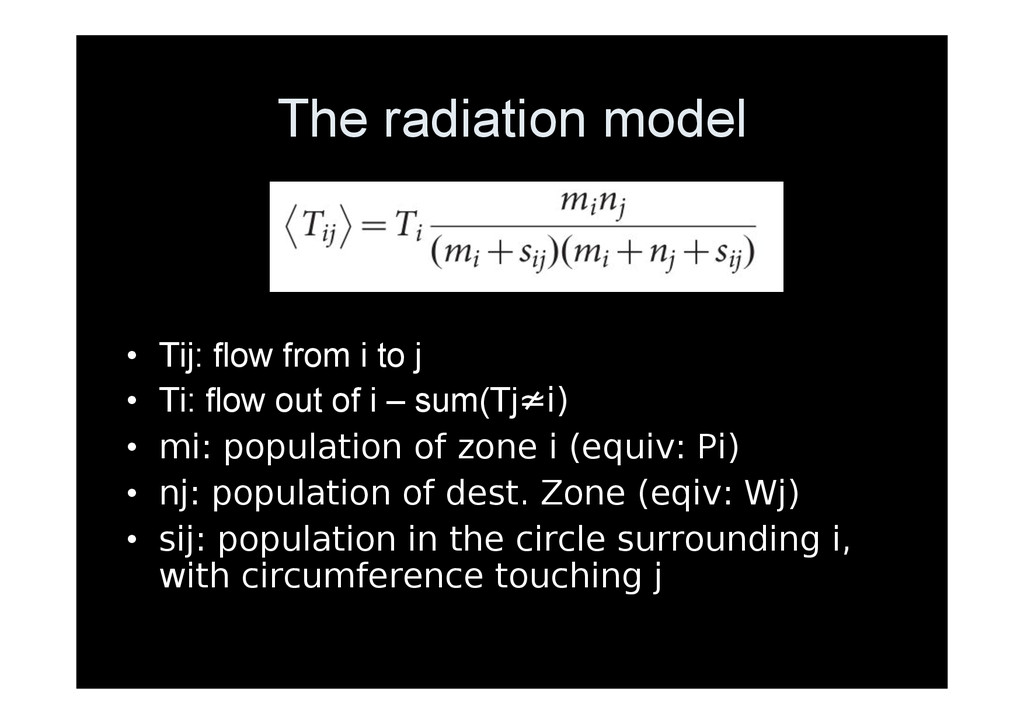
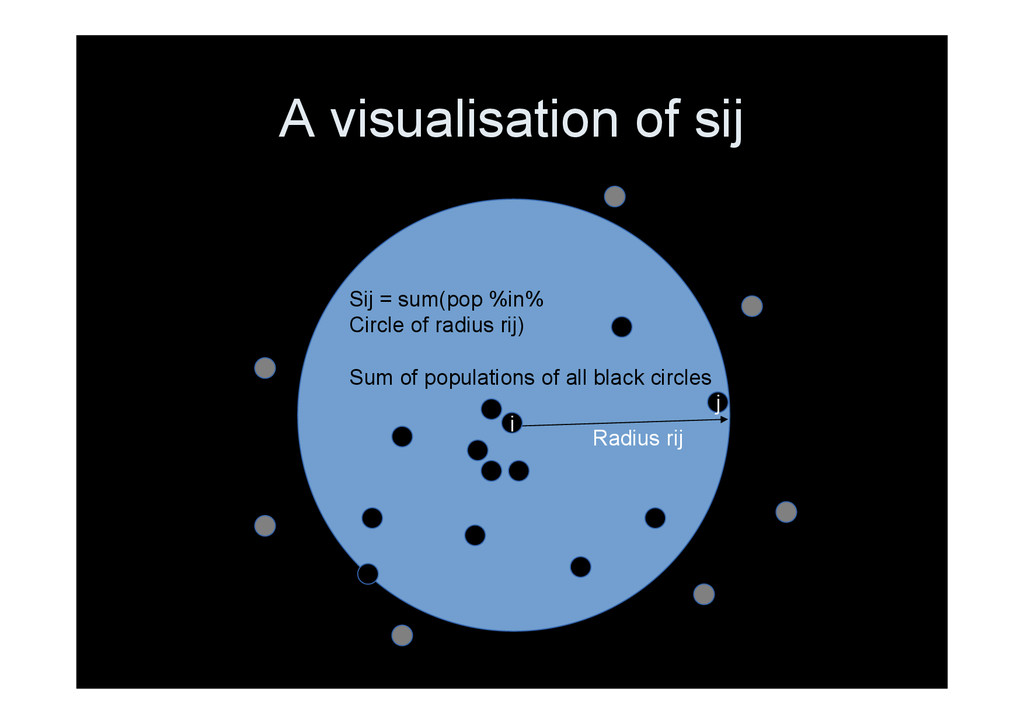
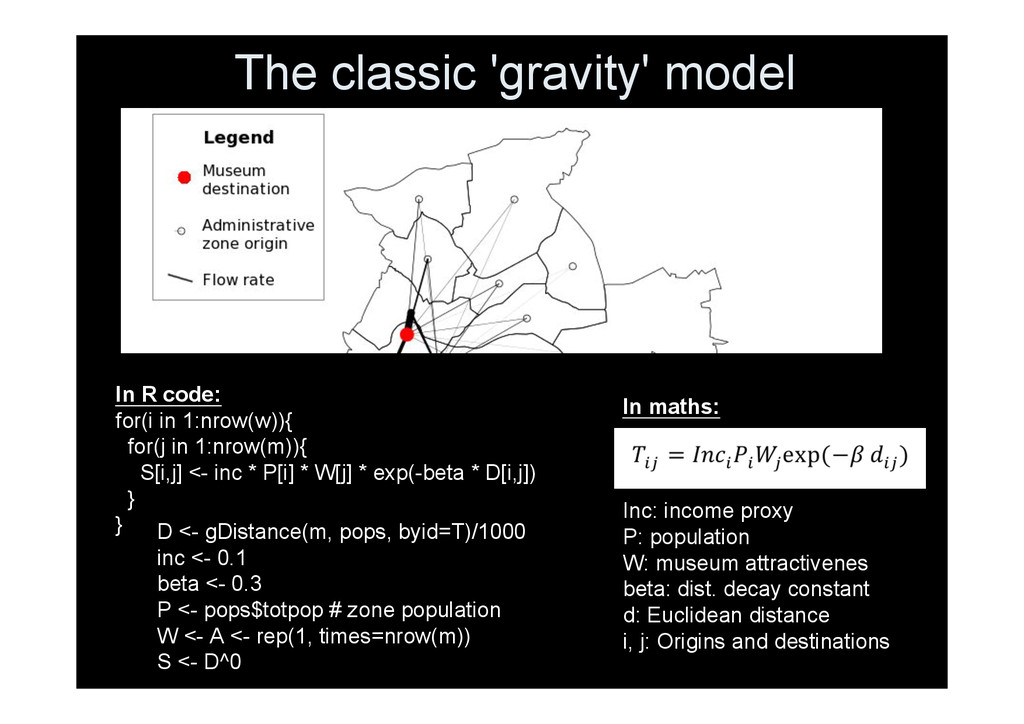
• Ti: flow out of i – sum(Tj≄i) • mi: population of zone i (equiv: Pi) • nj: population of dest. Zone (eqiv: Wj) • sij: population in the circle surrounding i, with circumference touching j
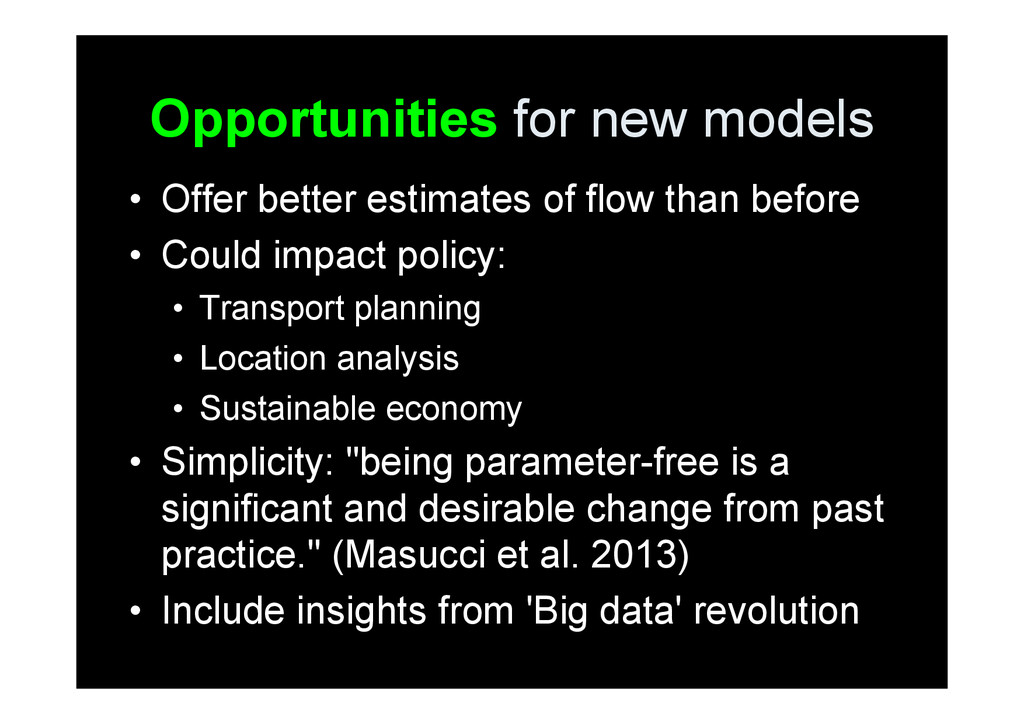
than before • Could impact policy: • Transport planning • Location analysis • Sustainable economy • Simplicity: "being parameter-free is a significant and desirable change from past practice." (Masucci et al. 2013) • Include insights from 'Big data' revolution
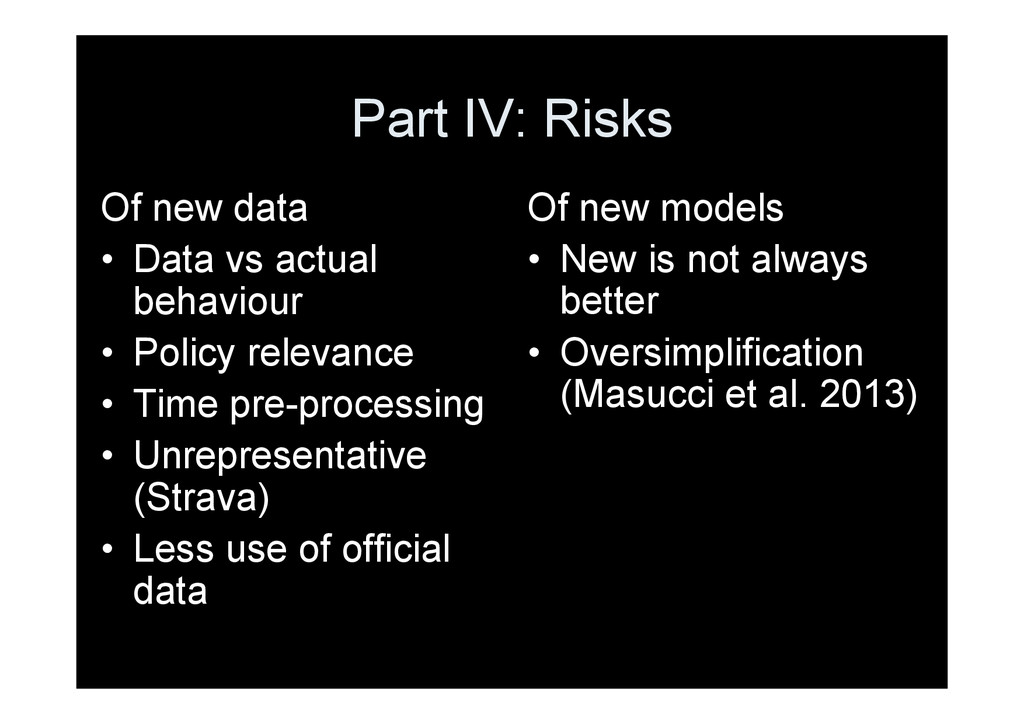
behaviour • Policy relevance • Time pre-processing • Unrepresentative (Strava) • Less use of official data Of new models • New is not always better • Oversimplification (Masucci et al. 2013)
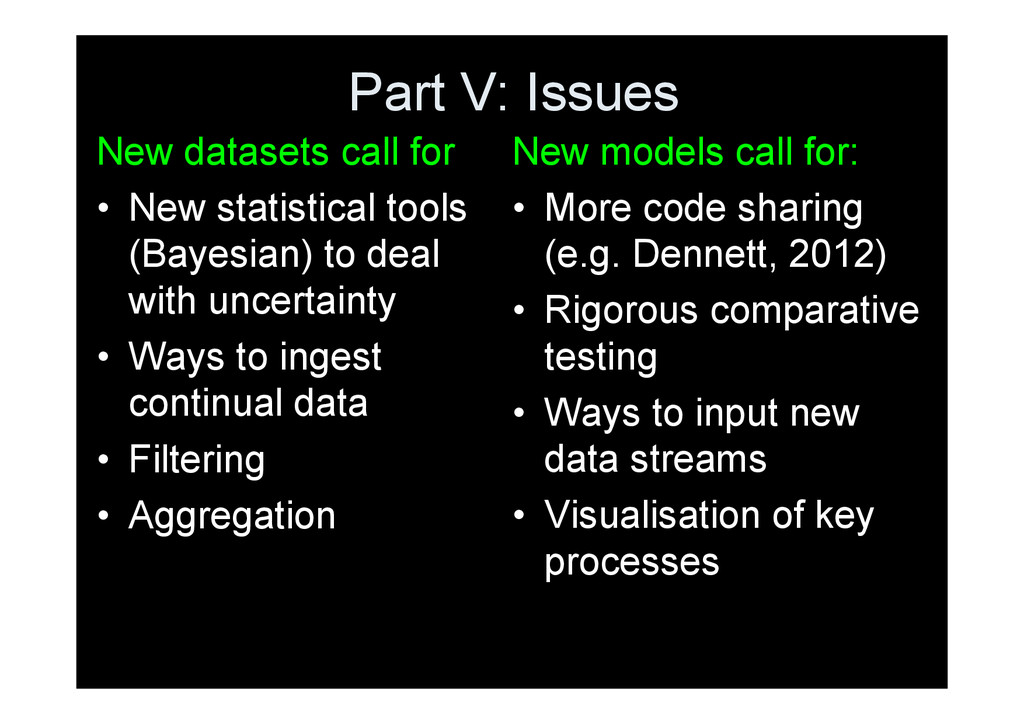
tools (Bayesian) to deal with uncertainty • Ways to ingest continual data • Filtering • Aggregation New models call for: • More code sharing (e.g. Dennett, 2012) • Rigorous comparative testing • Ways to input new data streams • Visualisation of key processes
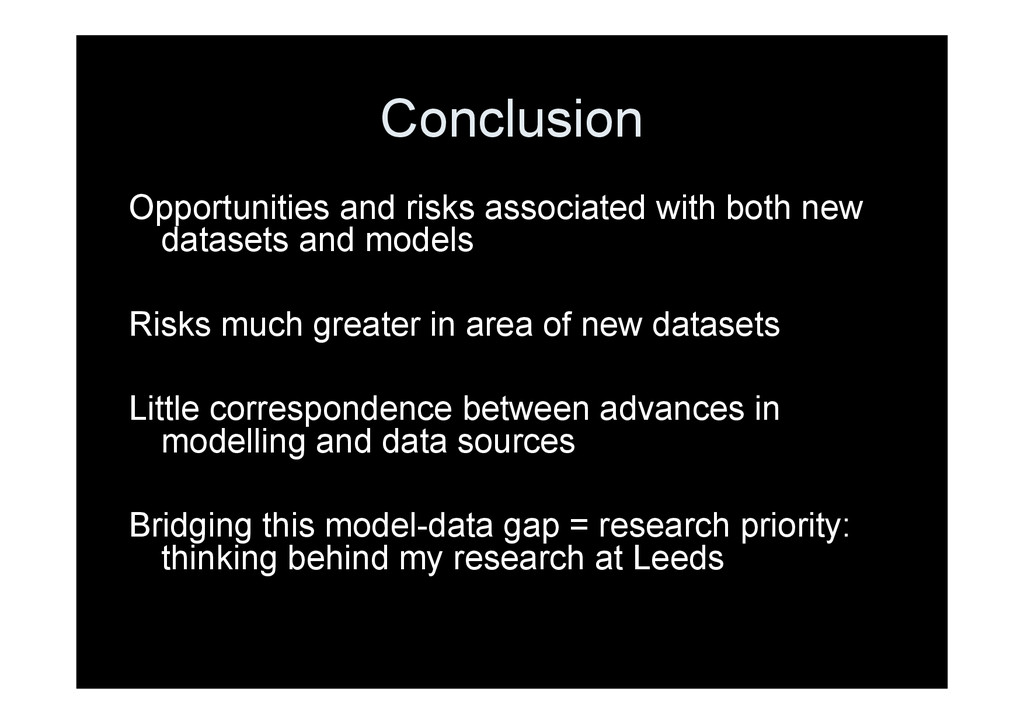
models Risks much greater in area of new datasets Little correspondence between advances in modelling and data sources Bridging this model-data gap = research priority: thinking behind my research at Leeds
locations:’get me started in'spatial interaction modelling. UCL Working Papers Series, 44(0), 0–24. • Lovelace, R., Malleson, N., Harland, K., & Birkin, M. (2014). Geotagged tweets to inform a spatial interaction model: a case study of museums. arXiv preprint arXiv:1403.5118. • Masucci, a. P., Serras, J., Johansson, A., & Batty, M. (2013). Gravity versus radiation models: On the importance of scale and heterogeneity in commuting flows. Physical Review E, 88(2). • Simini, F., González, M. C., Maritan, A., & Barabási, A. L. (2012). A universal model for mobility and migration patterns. Nature, 484(7392), 96-100.
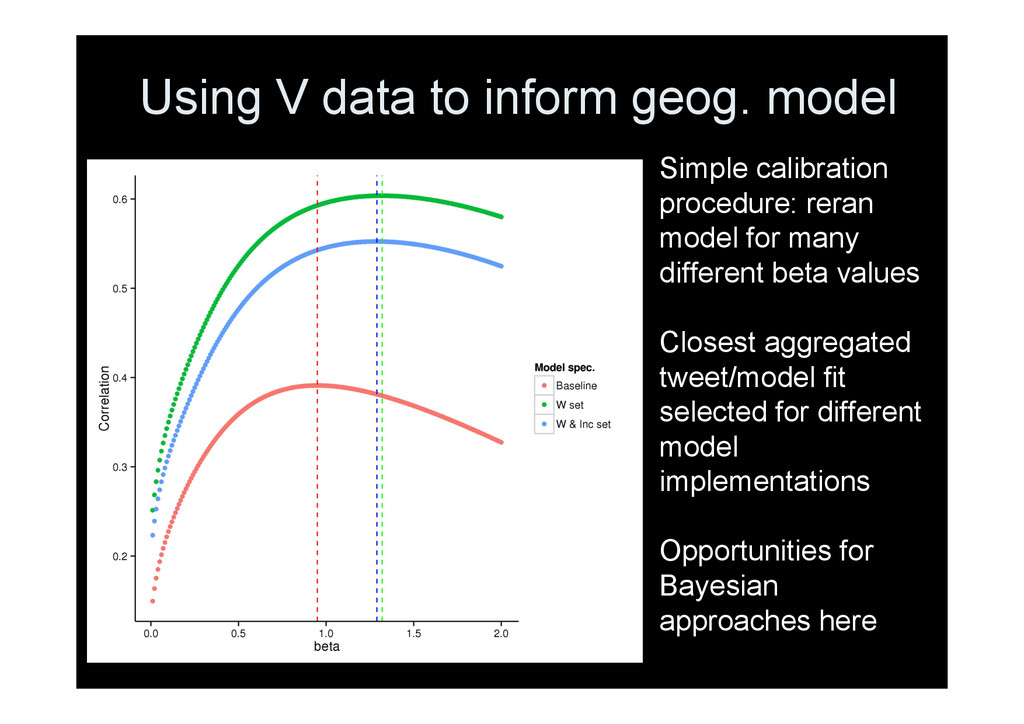
reran model for many different beta values Closest aggregated tweet/model fit selected for different model implementations Opportunities for Bayesian approaches here
for(j in 1:nrow(m)){ S[i,j] <- inc * P[i] * W[j] * exp(-beta * D[i,j]) } } In maths: Inc: income proxy P: population W: museum attractivenes beta: dist. decay constant d: Euclidean distance i, j: Origins and destinations D <- gDistance(m, pops, byid=T)/1000 inc <- 0.1 beta <- 0.3 P <- pops$totpop # zone population W <- A <- rep(1, times=nrow(m)) S <- D^0