mutually reinforcing structures and processes to persist in the presence of disturbance and stresses (Holling, 1973; Gunderson, 2000)" Why has it replaced sustainability? Luers, A. et al. (2003). A method for quantifying vulnerability, applied to the agricultural system of the Yaqui Valley, Mexico. Global Environmental Change, 13(4), 255–267. doi:10.1016/S0959-3780(03)00054-2
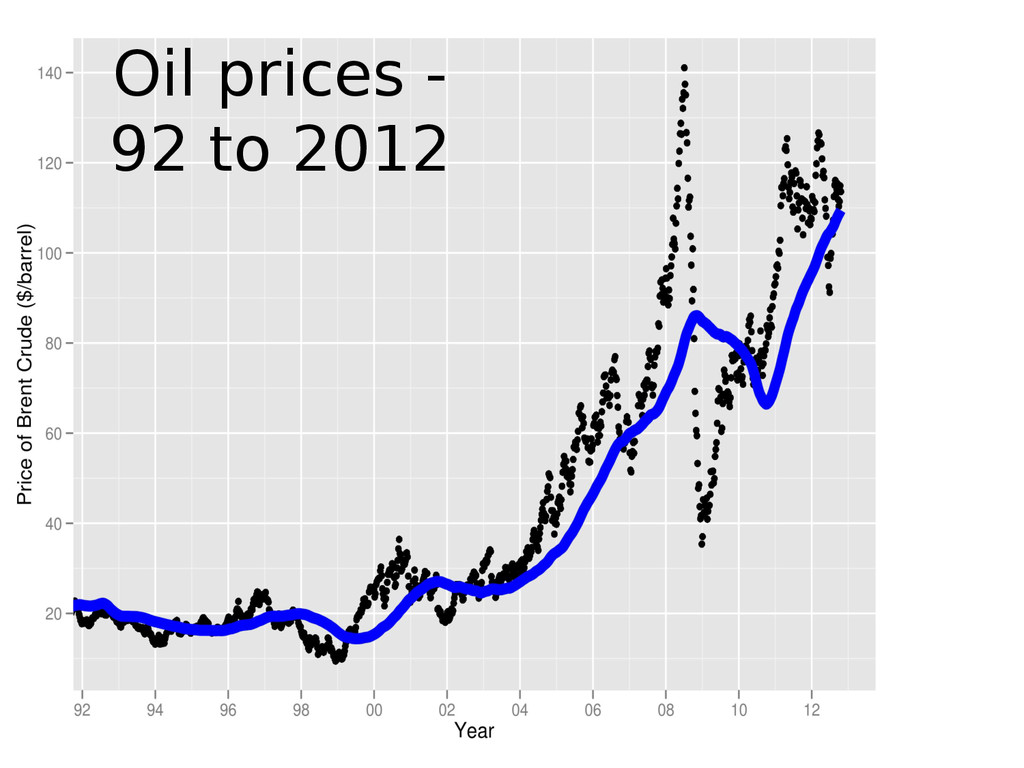
and spatial distribution of oil vulnerability depends on how an energy-constrained future is envisioned" (Lovelace and Philips, 2014). • Objective and quantifiable (like GDP) • Flexible enough for local contexts • Not so flexible as to become meaningless • Compatible with change
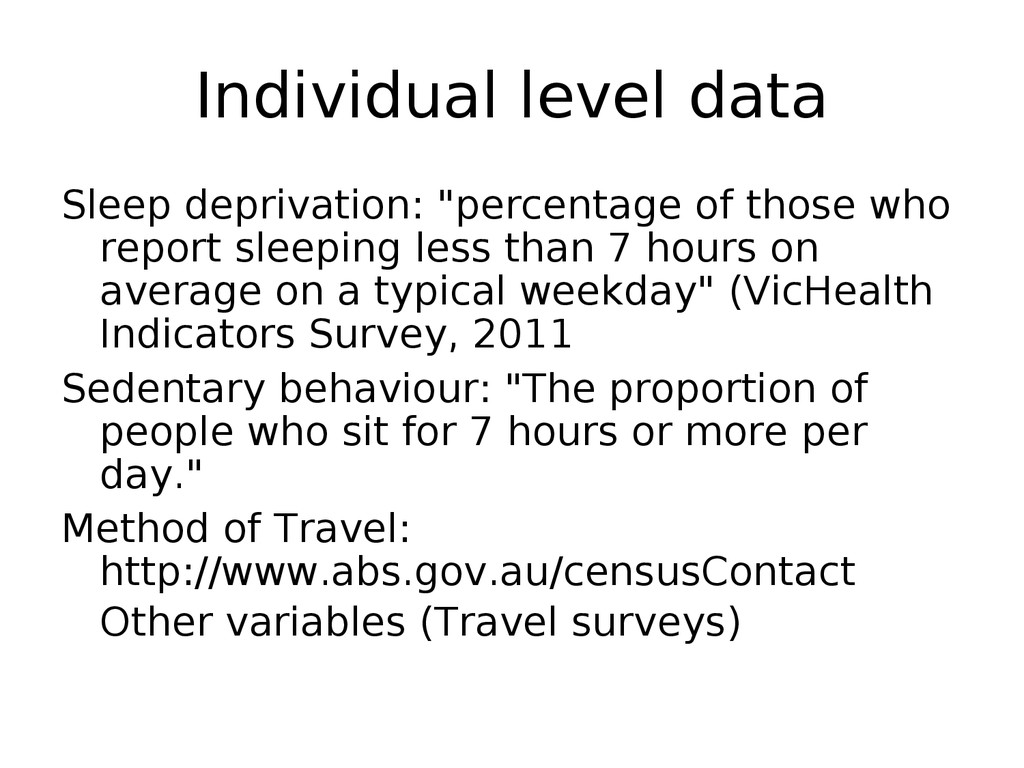
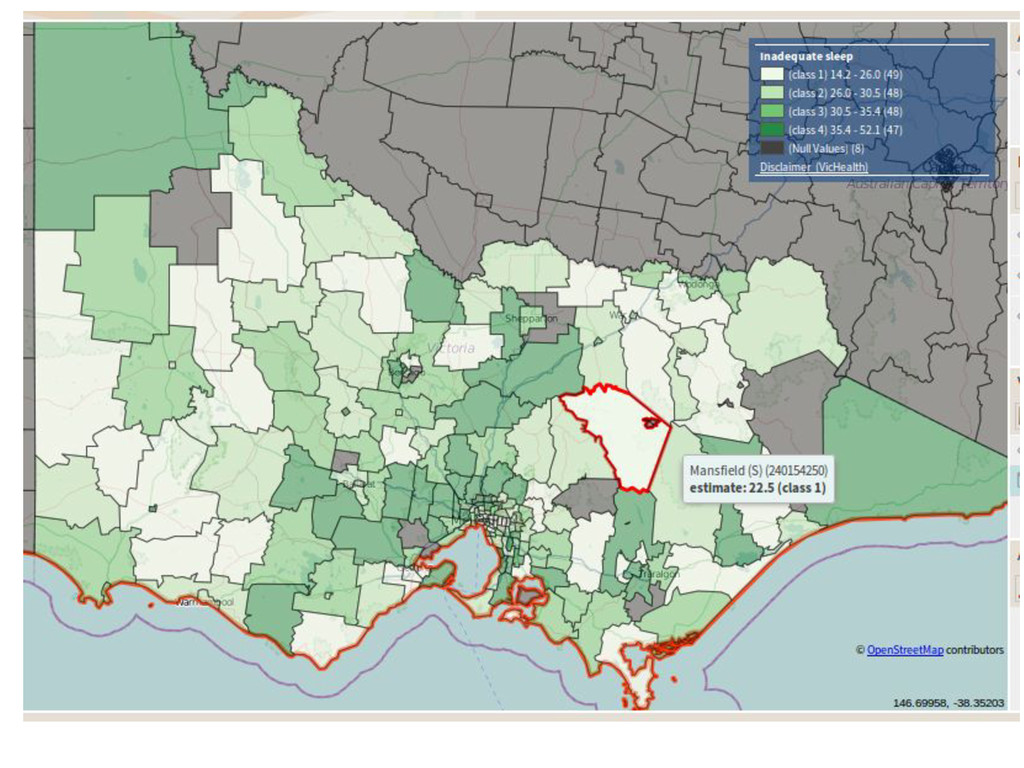
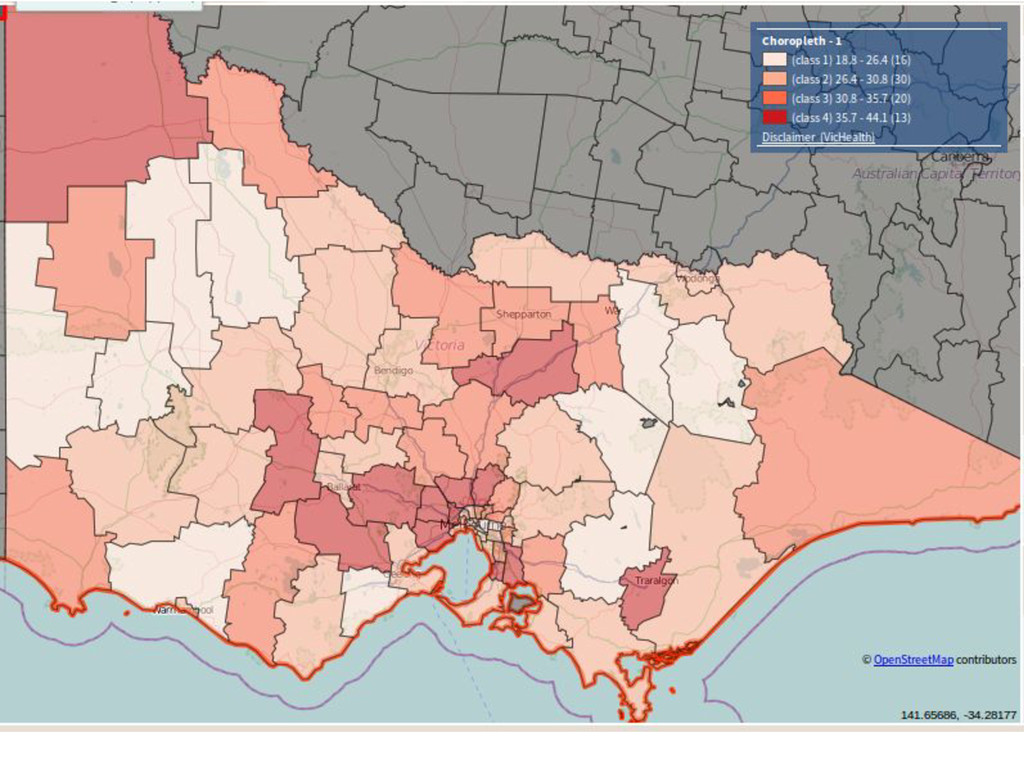
sleeping less than 7 hours on average on a typical weekday" (VicHealth Indicators Survey, 2011 Sedentary behaviour: "The proportion of people who sit for 7 hours or more per day." Method of Travel: http://www.abs.gov.au/censusContact Other variables (Travel surveys)
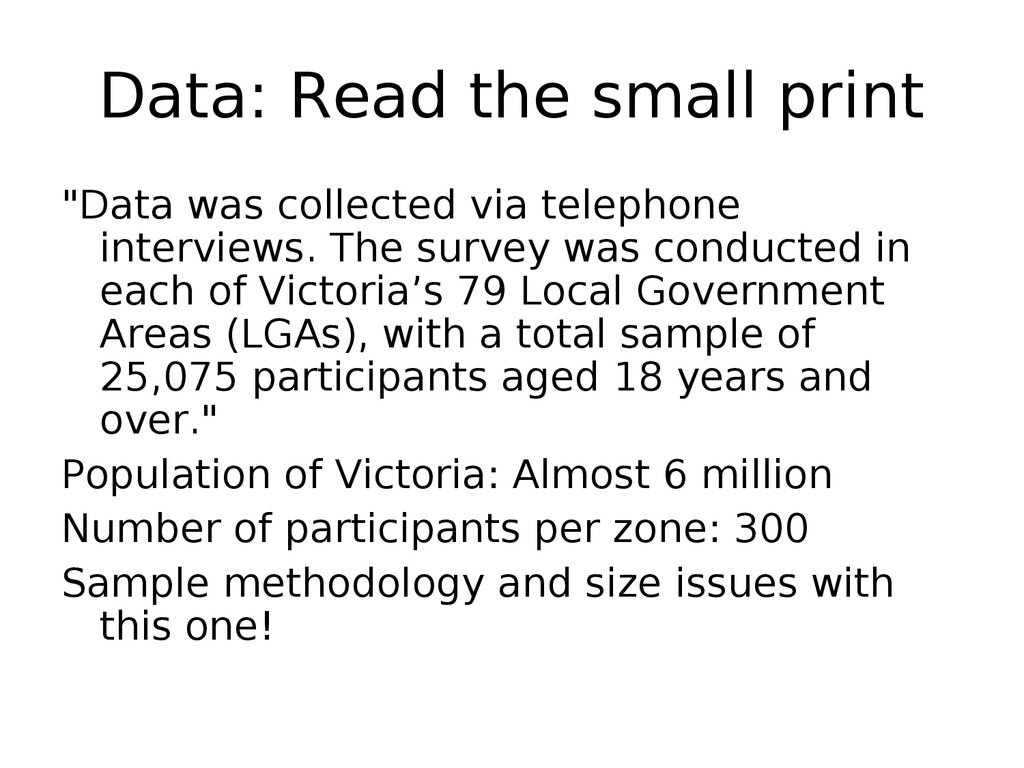
interviews. The survey was conducted in each of Victoria’s 79 Local Government Areas (LGAs), with a total sample of 25,075 participants aged 18 years and over." Population of Victoria: Almost 6 million Number of participants per zone: 300 Sample methodology and size issues with this one!
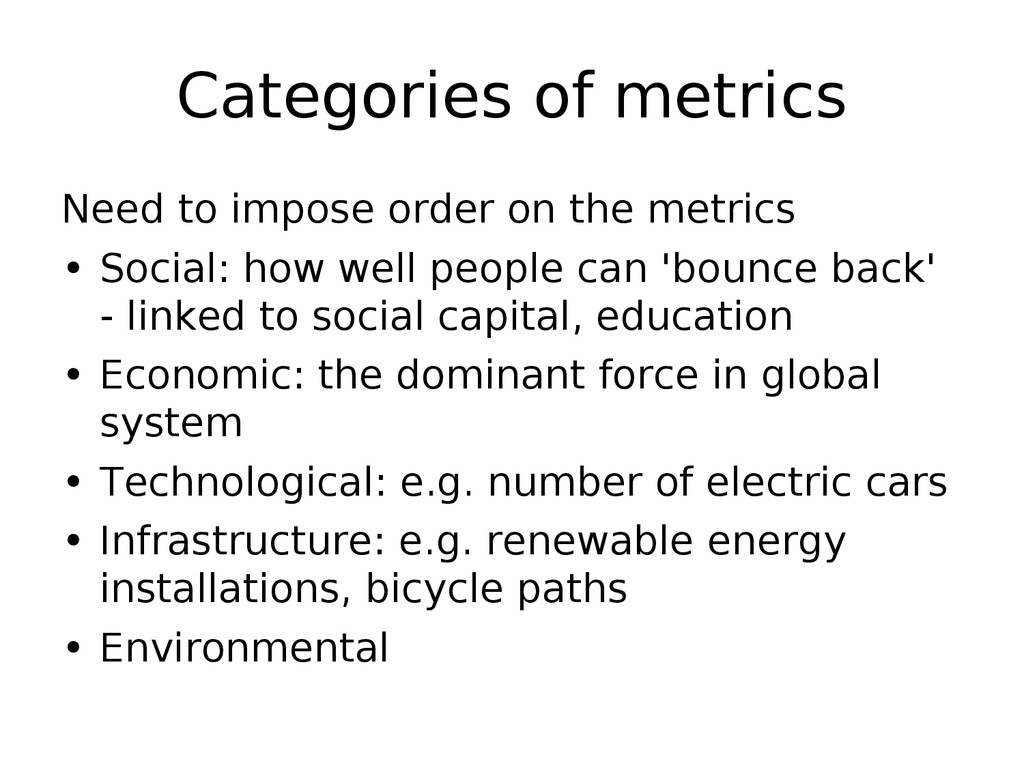
• Social: how well people can 'bounce back' - linked to social capital, education • Economic: the dominant force in global system • Technological: e.g. number of electric cars • Infrastructure: e.g. renewable energy installations, bicycle paths • Environmental
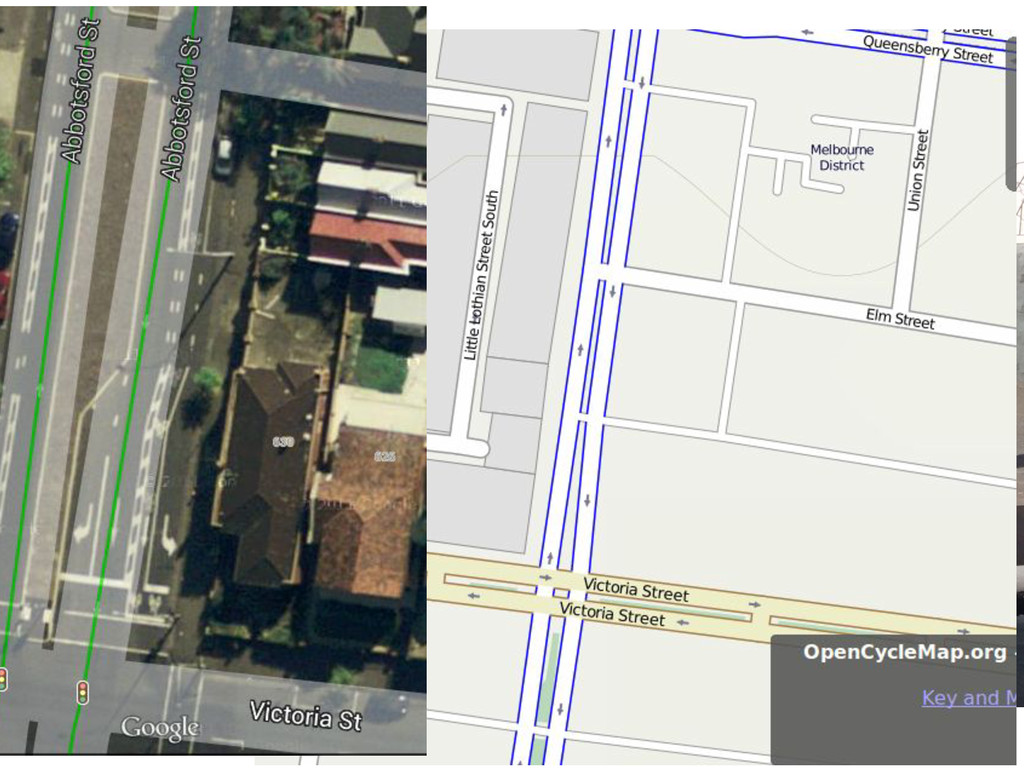
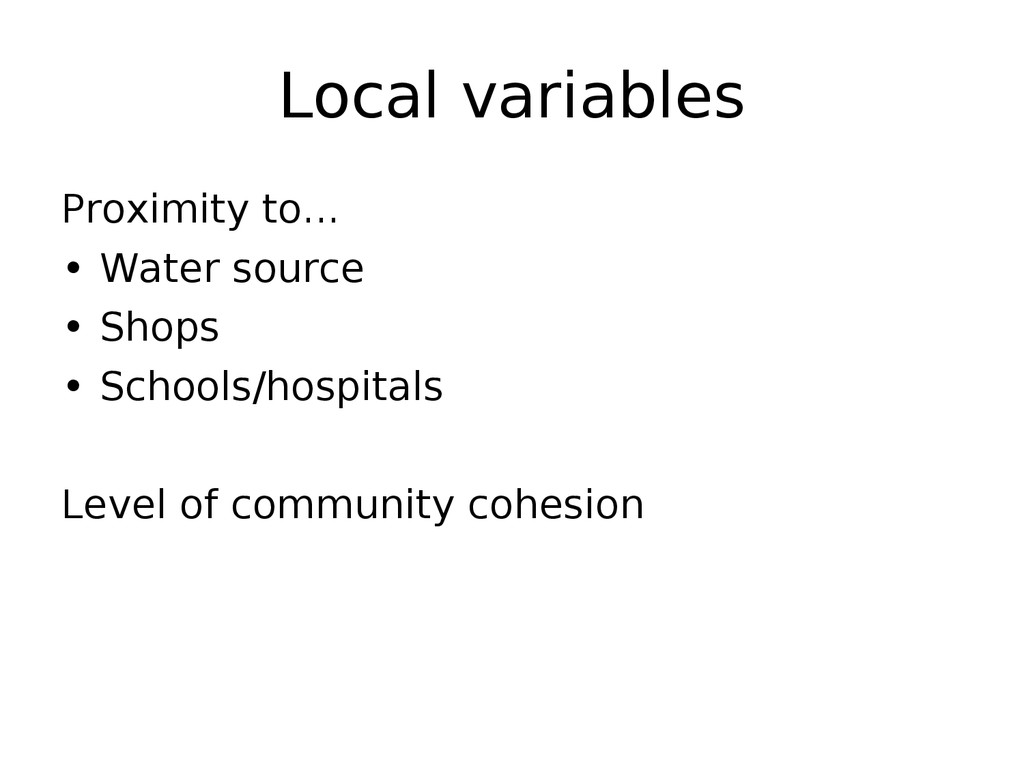
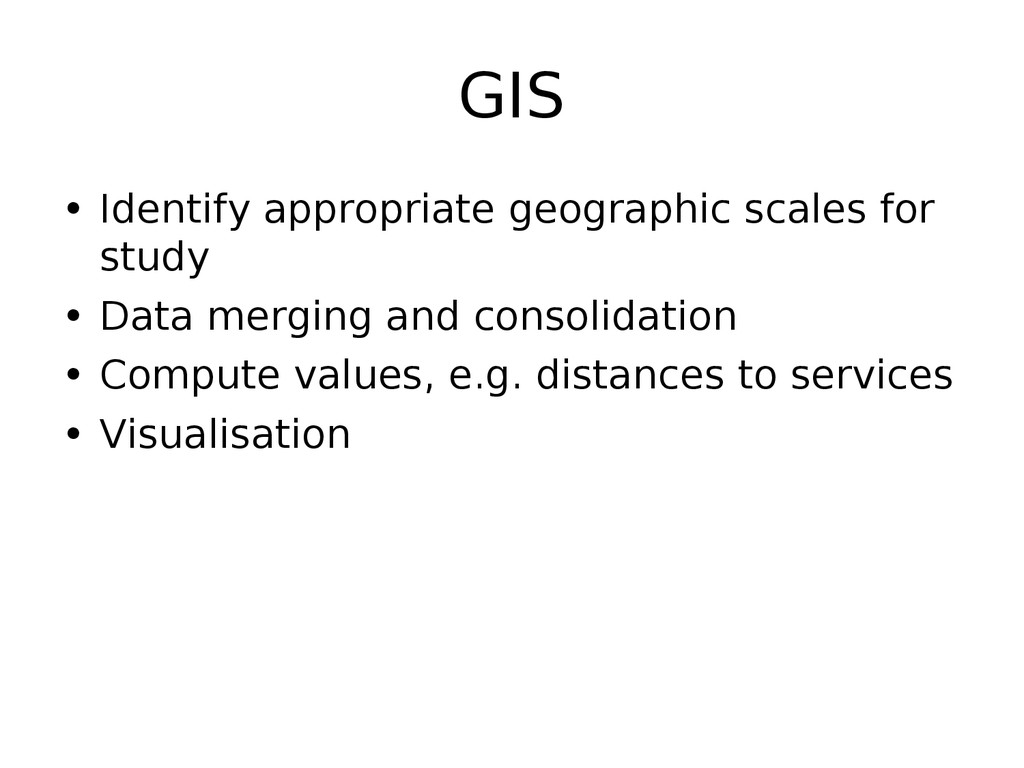
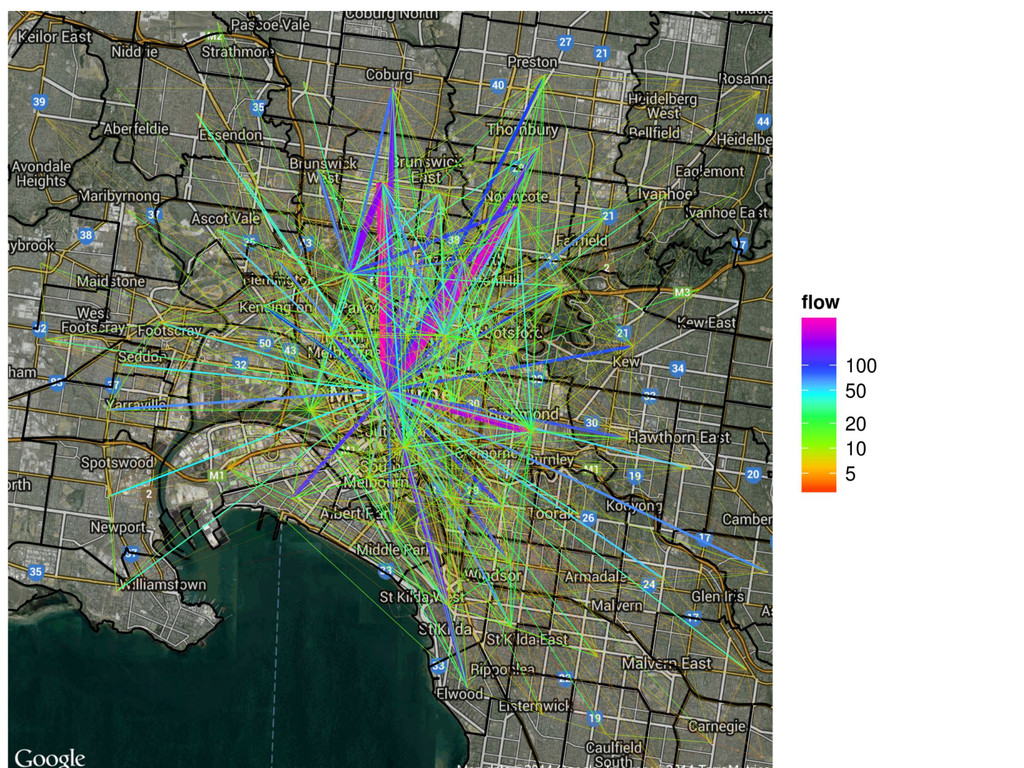
• Australian travel dataset • Long-distance commute (Victoria) • Social variables (Victoria) • Likelihood of flooding (altitude) Variables to be calculated • Proximity to key services (OSM + GIS) • Distance of commute (ABS statistics)
approach is not prescriptive, should be more attractive politically • But most use probably local urban planners and decision makers • Make discussion of future more realistic
going to be able to burn it all. Over the course of the next several decades, we’re going to have to build a ramp from how we currently use energy to where we need to use energy. And we’re not going to suddenly turn off a switch and suddenly we’re no longer using fossil fuels, but we have to use this time wisely, so that you have a tapering off of fossil fuels replaced by clean energy sources" (Obama, 2014)