Upgrade to Pro — share decks privately, control downloads, hide ads and more …

Using Ext JS Components to Turn Big Data into Actionable Intelligence

Using Ext JS Components to Turn Big Data into Actionable Intelligence

Sencha

June 05, 2017
Tweet

More Decks by Sencha

Other Decks in Technology

Transcript

  1. Using Ext JS Components to Turn Big Data into Actionable

    Intelligence Olga Petrova Sales Engineer @ Sencha
  2. Agenda • Common problems and pitfalls • Ext JS solution

    • Benefits • Sample BI application
  3. UI Disadvantages of Popular Solutions • Performance problems by visualization

    of huge datasets • Pure user interactions • Difficult customization • Difficult integration with current applications
  4. Advantages of Ext JS UI • Robust out-of-box components for

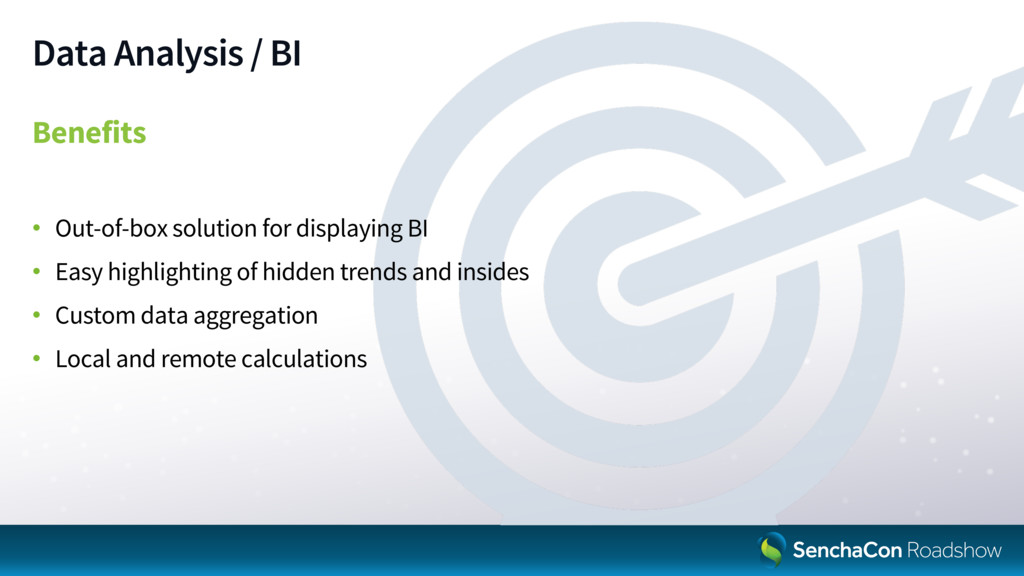
    visualization of data analysis results • Optimized for huge datasets, extreme performance • Easy customization and integration with current applications
  5. Use Case Data • 2.276.839 people and 1.476.313 houses •

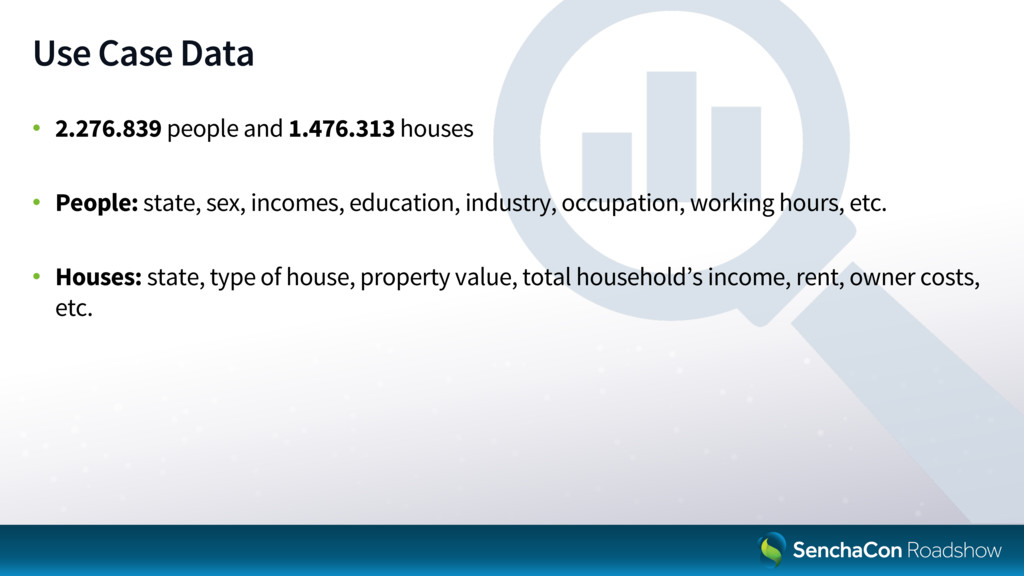
    People: state, sex, incomes, education, industry, occupation, working hours, etc. • Houses: state, type of house, property value, total household’s income, rent, owner costs, etc.
  6. “Purchasing Power” Concept Purchasing power is the number of goods

    or services that can be purchased with a unit of currency. http://www.bea.gov/newsreleases/regional/rpp/rpp_newsrelease.htm
  7. Application Functionality • Display of original data sources • Display

    of data analysis results: highlight hidden trends and insides • Data visualization
  8. Data Sources Possible solutions • Load dataset in a browser:

    at least 6 Million DOM elements (for 5 columns) • Use pagination: 1000 pages if page size is 1000
  9. Data Sources Ext JS Solution • Ext JS Grid with

    buffered rendering: only part of the dataset is rendered at a time • Ext Speeder backend: server-side smart cache
  10. Data Analysis / BI Problem How to aggregate data to

    highlight hidden trends and insides?
  11. Data Analysis / BI Possible solutions • Third-party solution: problems

    with integration, pure interactivity • Self-made solution: manual data aggregation and visualization with tables or lists
  12. Data Analysis / BI Ext JS Solution Sencha Pivot Grid:

    aggregate data per several dimensions and highlight hidden trends and insides
  13. Data Analysis / BI Benefits • Out-of-box solution for displaying

    BI • Easy highlighting of hidden trends and insides • Custom data aggregation • Local and remote calculations
  14. Data Visualization Possible solutions • Develop a custom chart component

    manually: take time • Use third-party solution: integration problems
  15. Data Visualization Benefits • Any kind of custom visualization: huge

    examples gallery • Canvas and SVG engine support • Rich user interactions • Easy data binding to Ext JS store • Integration into Ext JS layouting system
  16. Used Ext JS Components • Ext JS Buffered Grid •

    Ext Speeder back-end • Ext JS Pivot Grid • D3.js Adapter
  17. Conclusion Ext JS offers a robust and flexible UI for

    enterprise data analysis applications, visualize big datasets in grids and charts with high performance