understanding, analysing, reasoning, and making decisions • It is something we do everyday: • Plan a holiday, buy a house, understand an illness, … • Defence, policing, investment, medical diagnosis, … • Scientific research (from conception to paper) • How is it different from data analysis? • While the goal may be clear, how to get there is often not • Exploratory and takes a long time
is the best camera for £500? Pixel number Sensor size Image quality chromatic aberration?! Noise reduction What does experts say? Online reviews What does my friend say? Smart phone Compact Full frame? Micro 4/3? Sony RX100 Nikon D750 Samsung Galaxy S7 What are the price? How do I compare? Panasonic LX100 Form factor Models Camera Lens Aperture
is not? • Where is the information about ‘chromatic aberration’? • What are the factors important to image quality? • How to compare the models? • Where did I left off two days ago? • How do I explain to my wife?
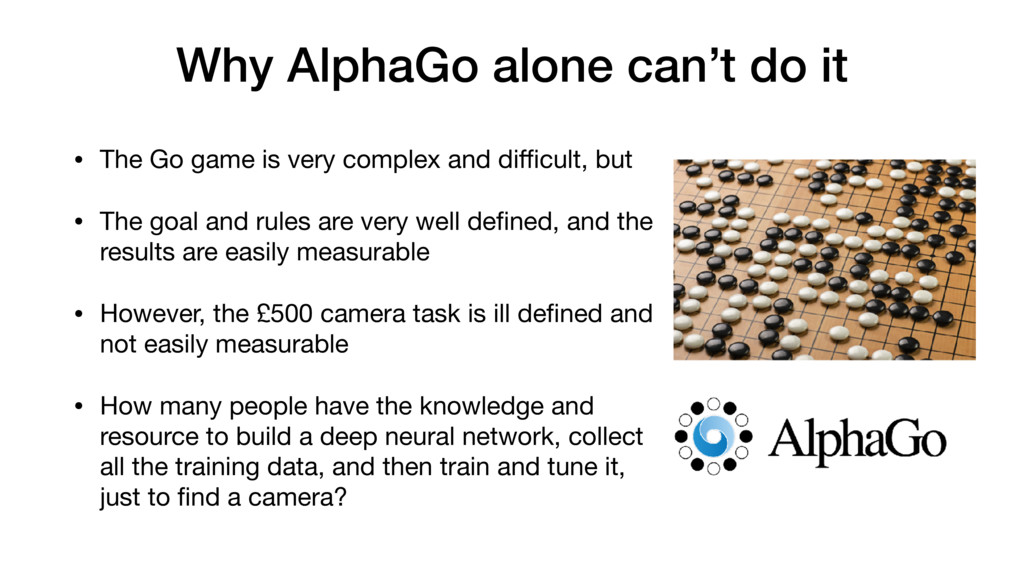
is very complex and difficult, but • The goal and rules are very well defined, and the results are easily measurable • However, the £500 camera task is ill defined and not easily measurable • How many people have the knowledge and resource to build a deep neural network, collect all the training data, and then train and tune it, just to find a camera?
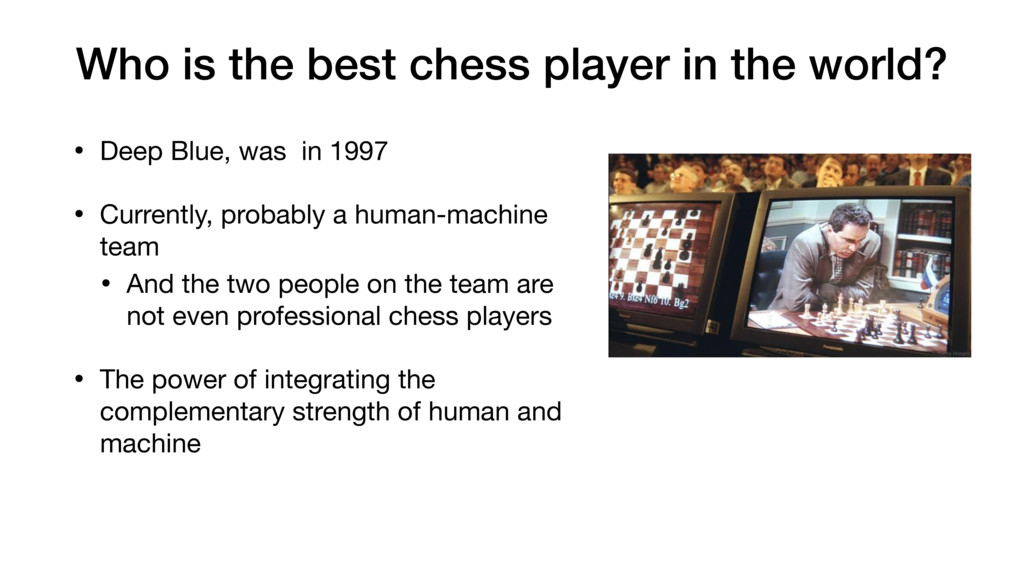
Deep Blue, was in 1997 • Currently, probably a human-machine team • And the two people on the team are not even professional chess players • The power of integrating the complementary strength of human and machine
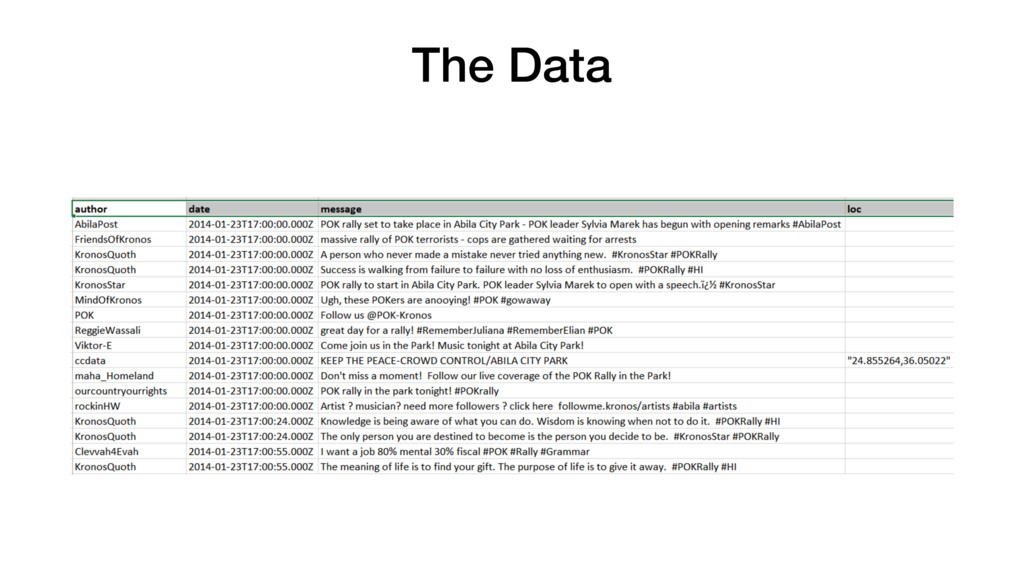
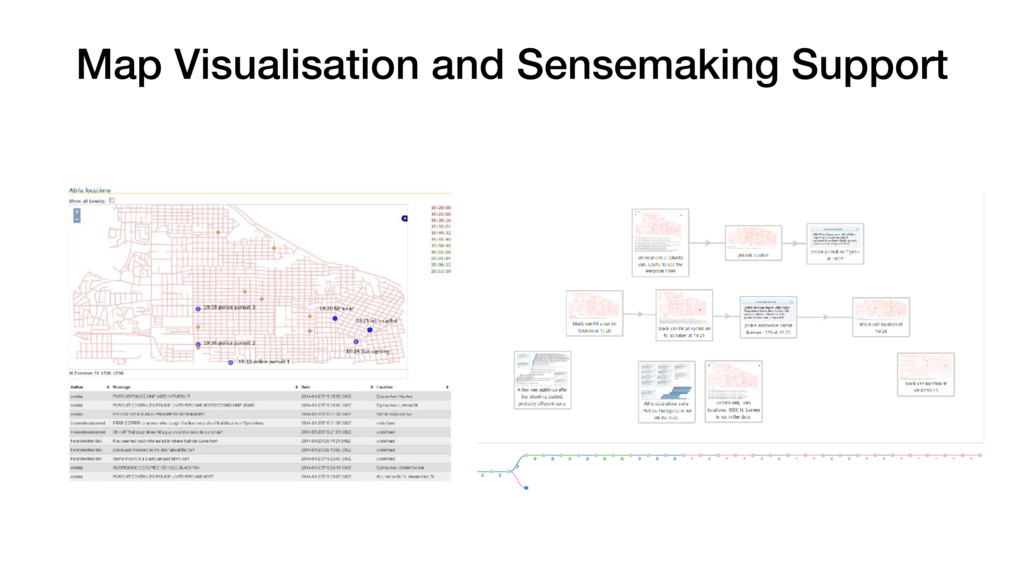
Science & Technology (VAST) Challenge • Provide dataset and analysis tasks • Entry: visual analytics systems • Leading research groups and companies • VAST Challenge 2014 – Mini Challenge 3 • Data: tweets • Task: detect and describe a crime
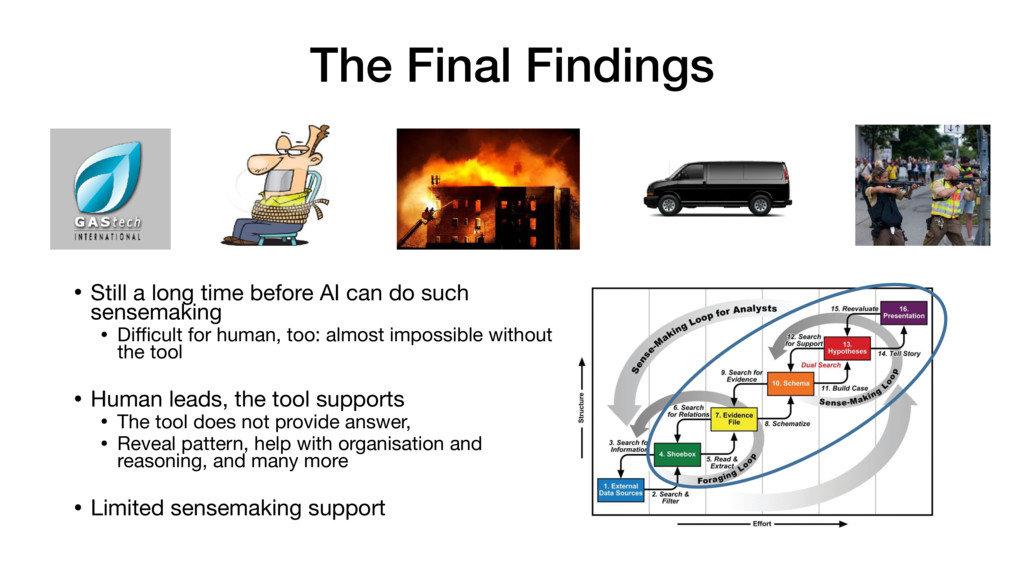
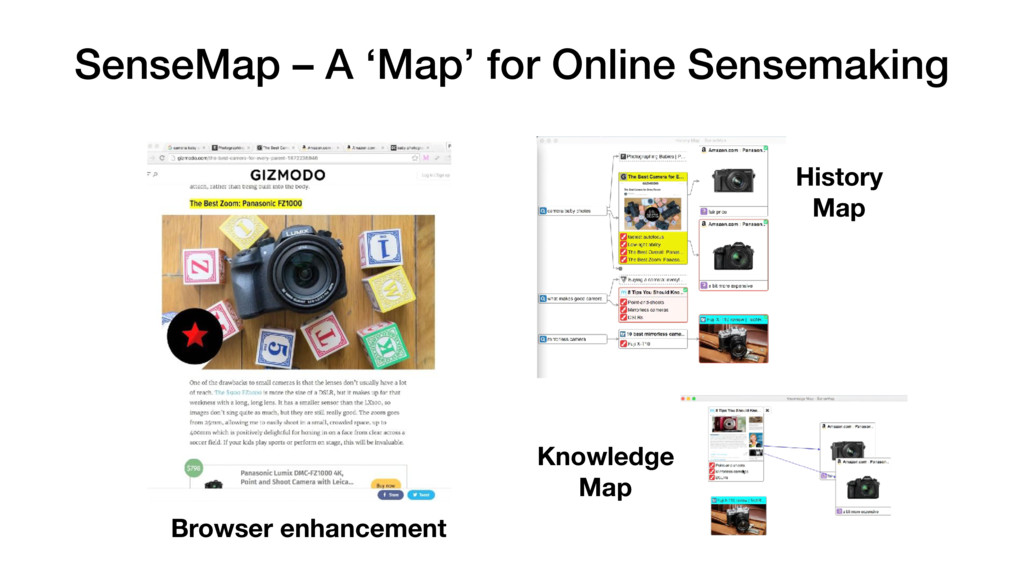
can do such sensemaking • Difficult for human, too: almost impossible without the tool • Human leads, the tool supports • The tool does not provide answer, • Reveal pattern, help with organisation and reasoning, and many more • Limited sensemaking support
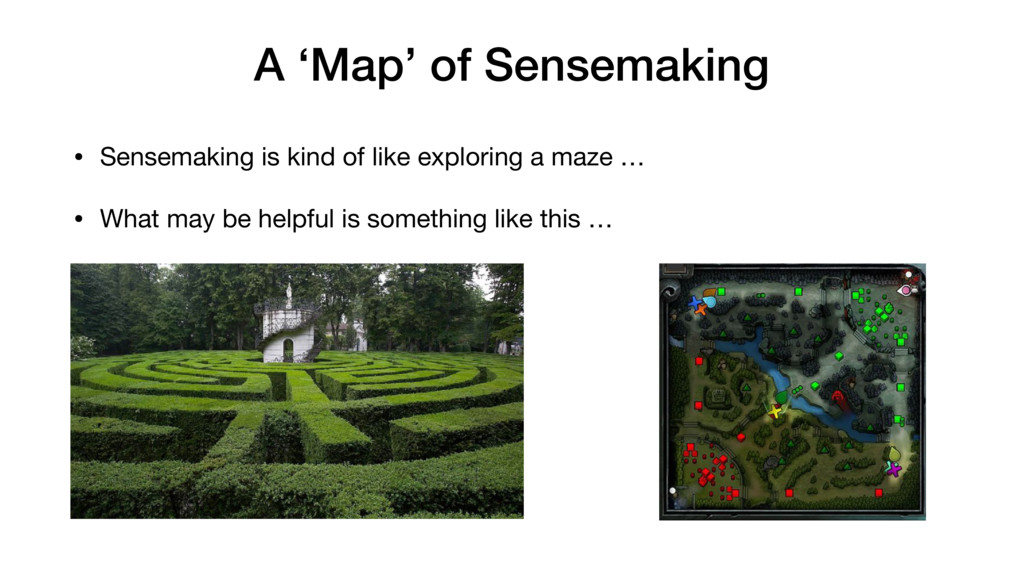
lower stages of sensemaking so far • How (machine learning) algorithm can help • Understand sensemaking actions from the relatively lower level data (provenance) • And then provide better support • A ‘coverage map’ for data and solution space.
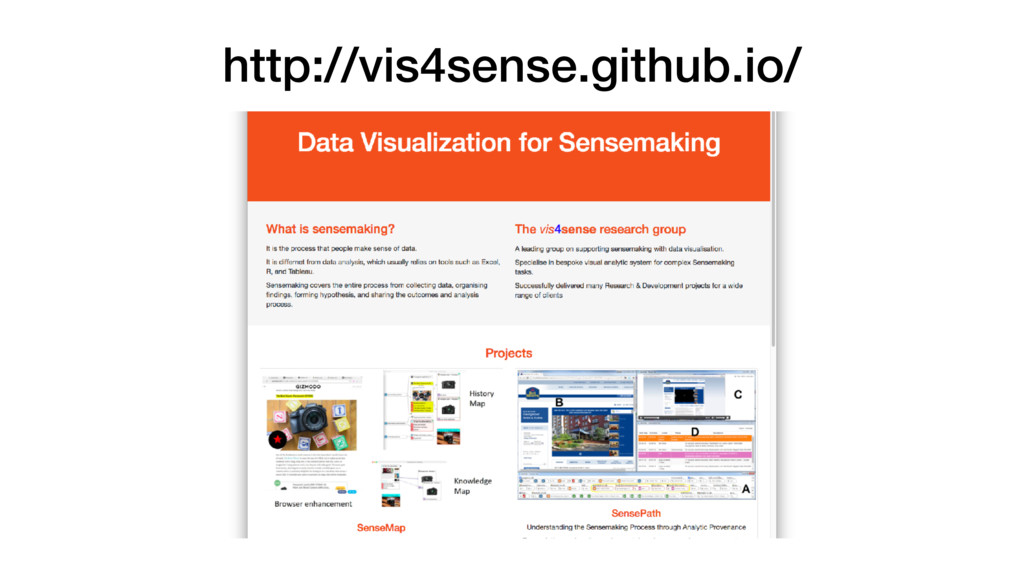
make decisions with data • It is important to Big Data, but there is limited support available • Visual Analytics combines data visualisation with analytics • A promising approach for sensemaking support More details on github.com: http://vis4sense.github.io/