Upgrade to Pro — share decks privately, control downloads, hide ads and more …

7 Levels of Web Performance Journey

Sponsored · Ship Features Fearlessly Turn features on and off without deploys. Used by thousands of Ruby developers. →

7 Levels of Web Performance Journey

The path to understanding the data around Web Performance, its value and business decisions surrounding this topic can be long. It is hard to see the whole journey when you and your organization are at any particular step, but it can be helpful to understand where to go next. Eric Goldstein, Sergey Chernyshev and Alexander Chernyshev joined forces to describe and visualize this path to help make it more understandable and give you some bearings on your overall trip through various levels of this complex game.

Avatar for Sergey Chernyshev

Sergey Chernyshev

October 07, 2026

More Decks by Sergey Chernyshev

Other Decks in Technology

Transcript

  1. 7 Levels of a Web Performance Journey How Focused Performance

    Metrics Can Improve User Experience Eric Goldstein & Sergey Chernyshev & Alexander Chernyshev New Jersey Code & Coffee Meetup September 19, 2026
  2. Eric Goldstein Sergey Chernyshev Alexander Chernyshev Principal Engineer @ Babbel

    Speed Engineer @ Cloudflare Web Developer & Designer About Us
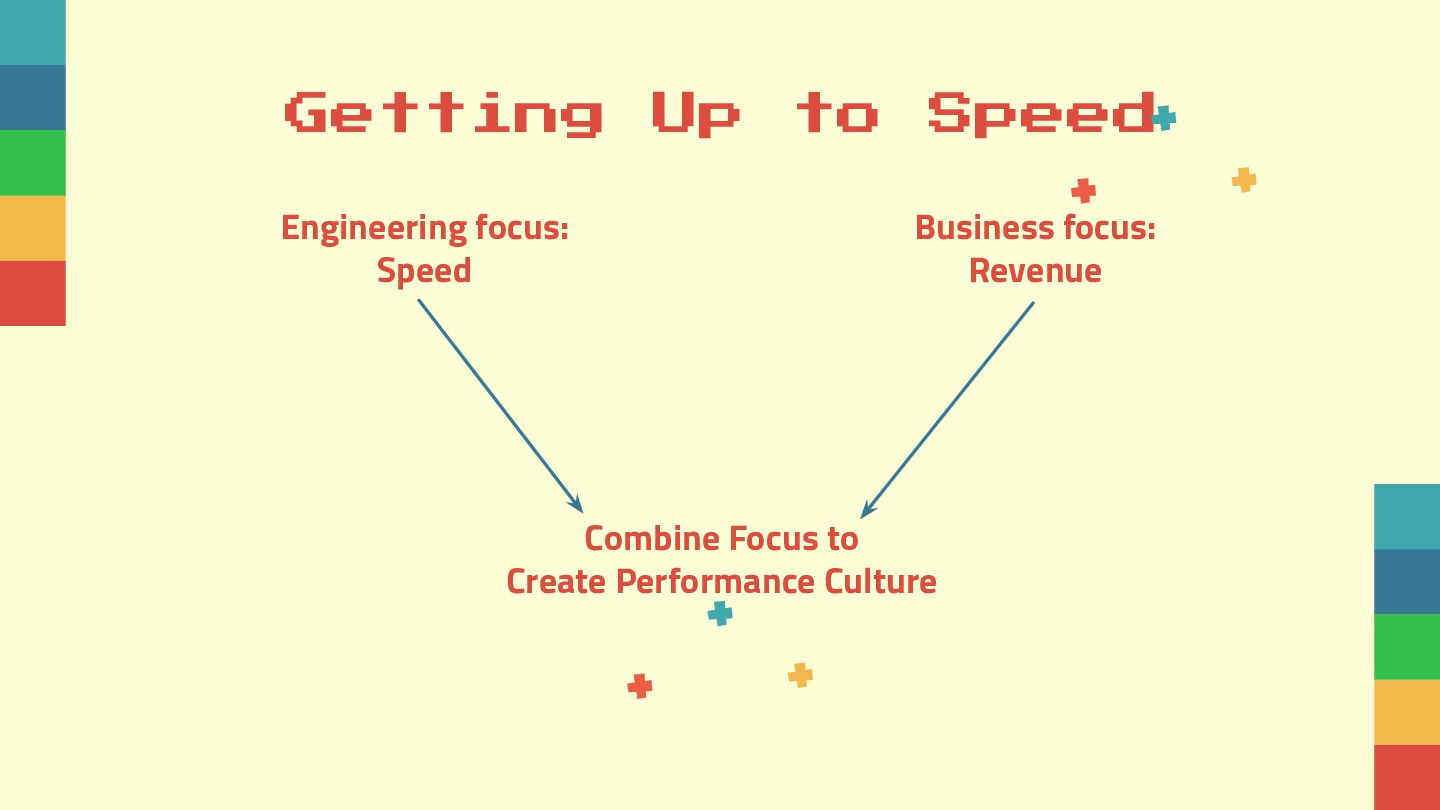
  3. Getting Engineering focus: Speed Up to Speed Business focus: Revenue

    Combine Focus to Create Performance Culture
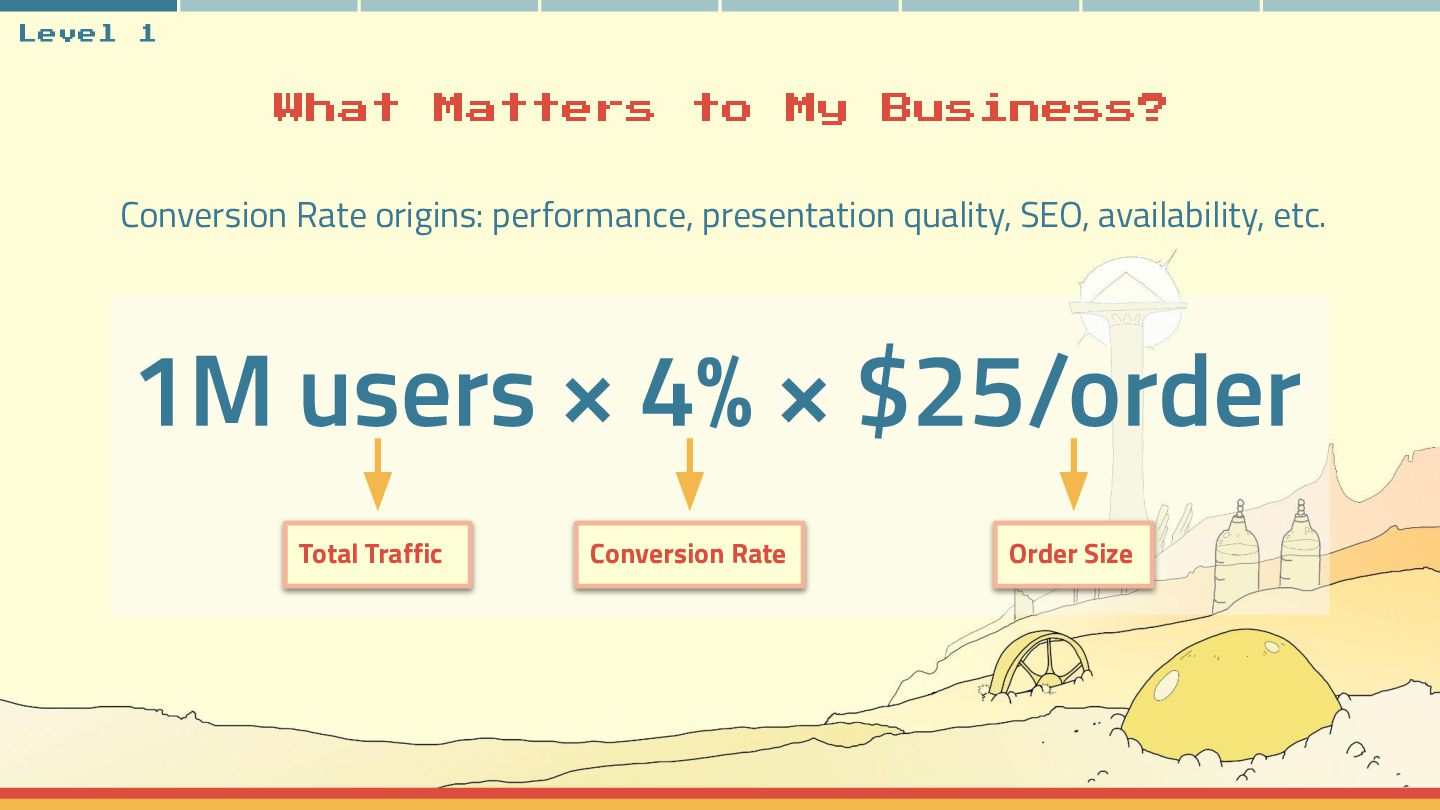
  4. Level 1 What Matters to My Business? Conversion Rate origins:

    performance, presentation quality, SEO, availability, etc. Total Traffic Conversion Rate Order Size
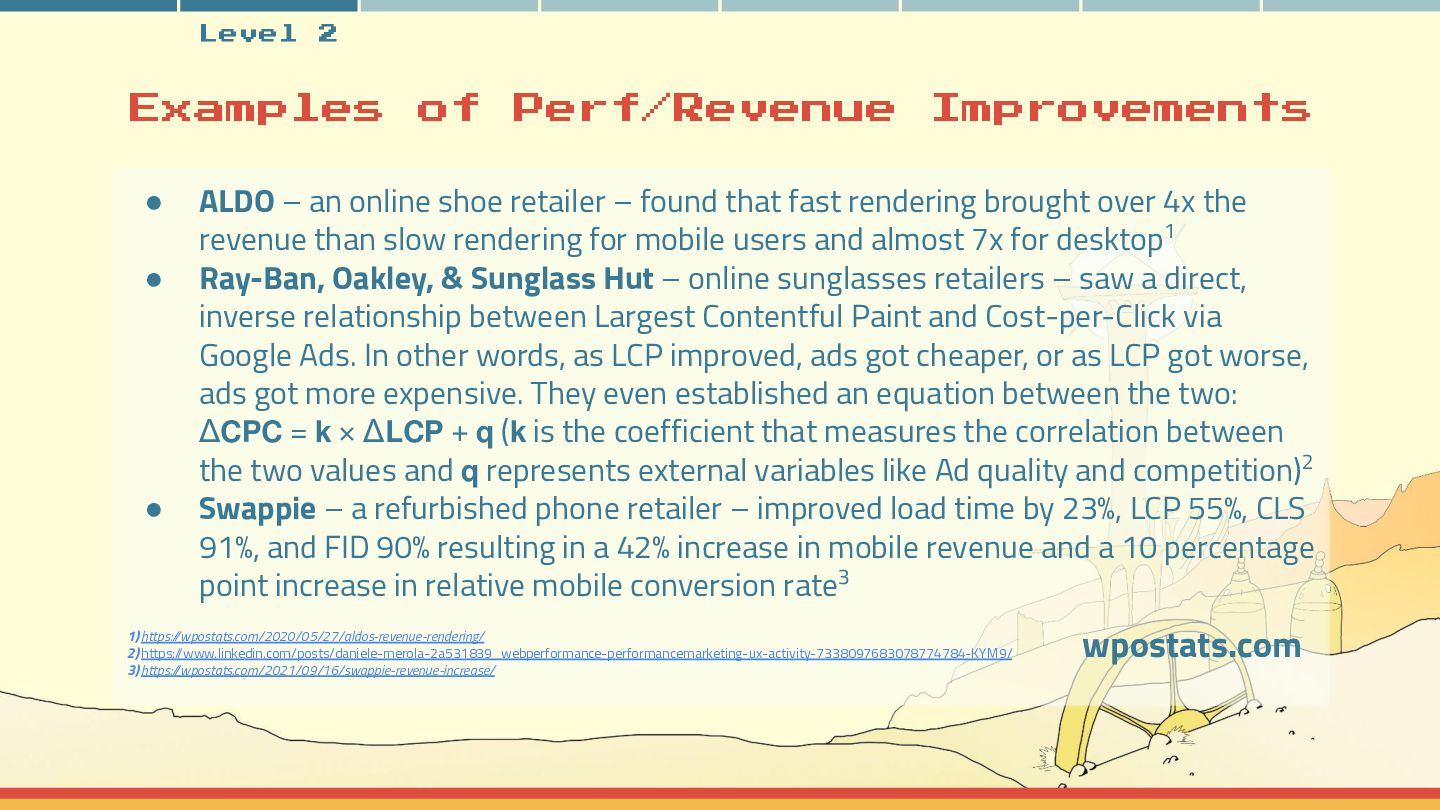
  5. Level 2 Examples of Perf/Revenue • • • Improvements ALDO

    – an online shoe retailer – found that fast rendering brought over 4x the revenue than slow rendering for mobile users and almost 7x for desktop1 Ray-Ban, Oakley, & Sunglass Hut – online sunglasses retailers – saw a direct, inverse relationship between Largest Contentful Paint and Cost-per-Click via Google Ads. In other words, as LCP improved, ads got cheaper, or as LCP got worse, ads got more expensive. They even established an equation between the two: Δ𝗖𝗣𝗖 = 𝗸 × Δ𝗟𝗖𝗣 + 𝗾 (𝗸 is the coefficient that measures the correlation between the two values and 𝗾 represents external variables like Ad quality and competition)2 Swappie – a refurbished phone retailer – improved load time by 23%, LCP 55%, CLS 91%, and FID 90% resulting in a 42% increase in mobile revenue and a 10 percentage point increase in relative mobile conversion rate3 1) https://wpostats.com/2020/05/27/aldos-revenue-rendering/ 2) https://www.linkedin.com/posts/daniele-merola-2a531839_webperformance-performancemarketing-ux-activity-7338097683078774784-KYM9/ 3) https://wpostats.com/2021/09/16/swappie-revenue-increase/ wpostats.com
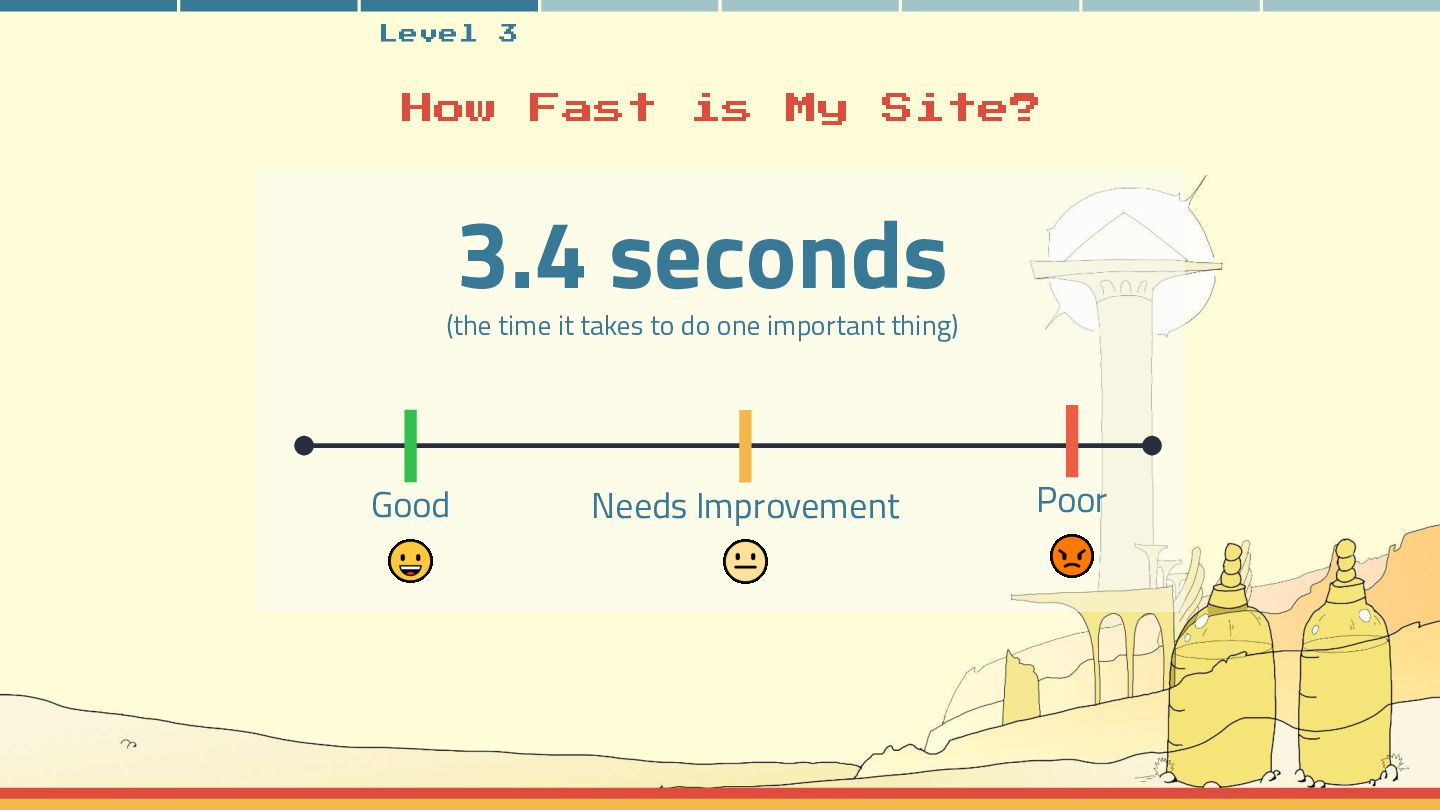
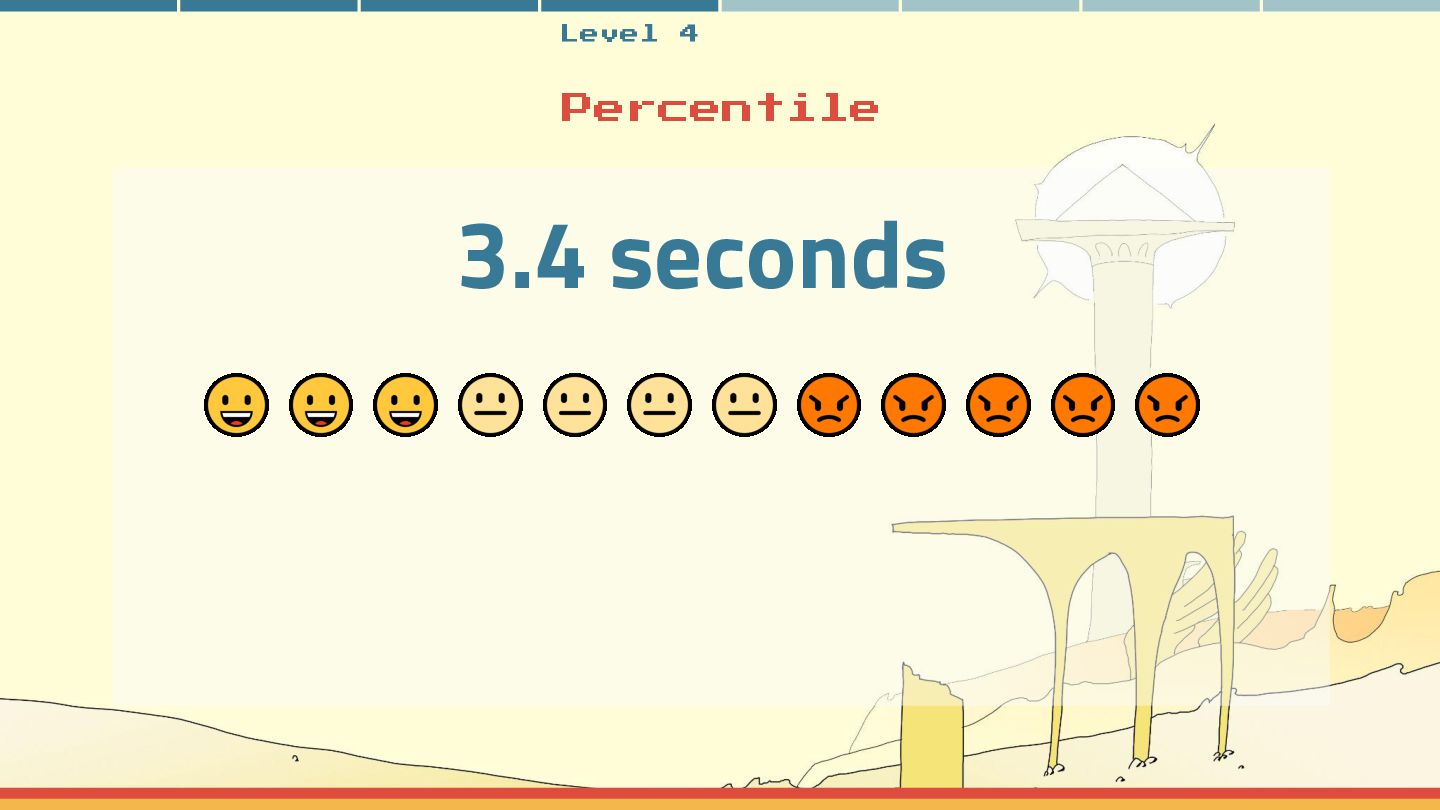
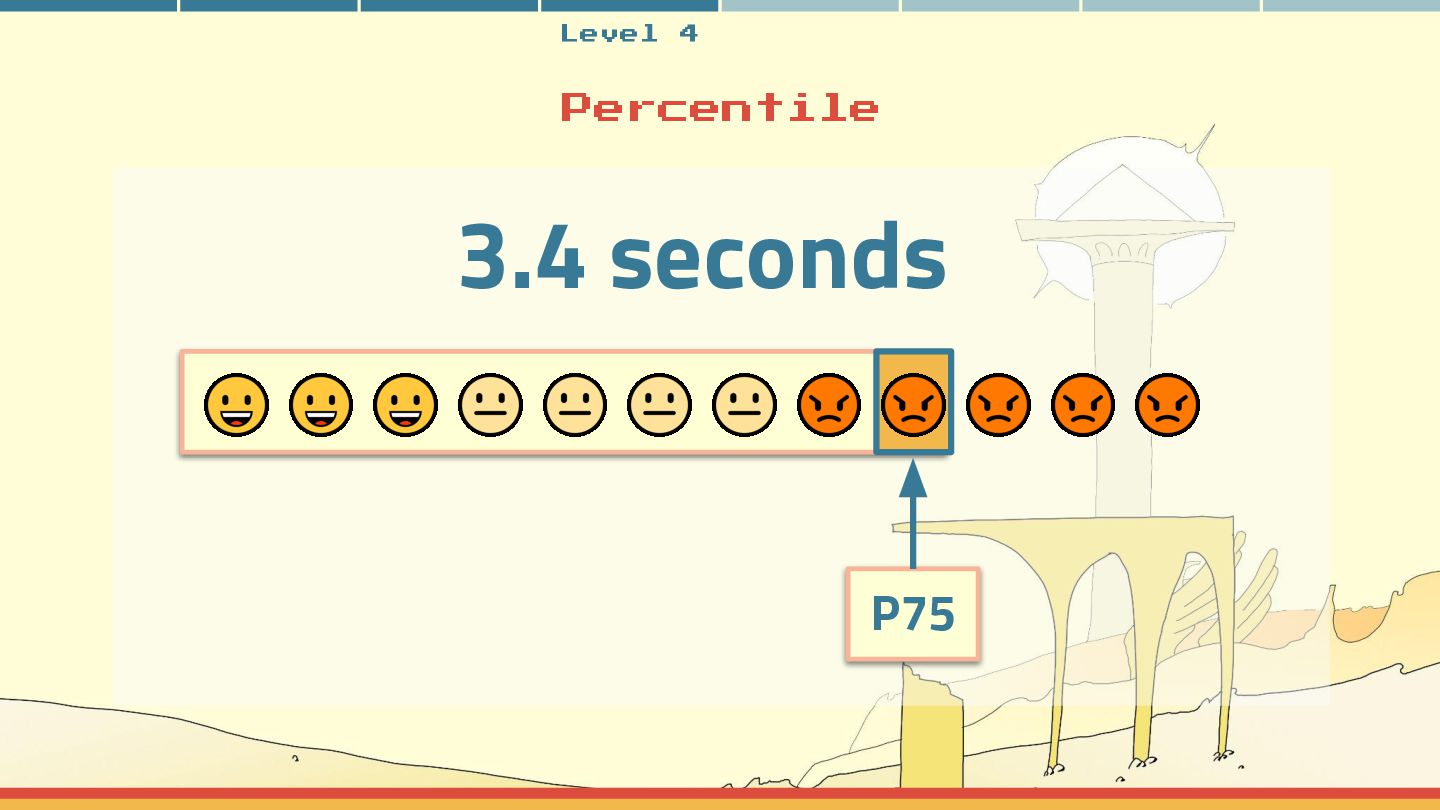
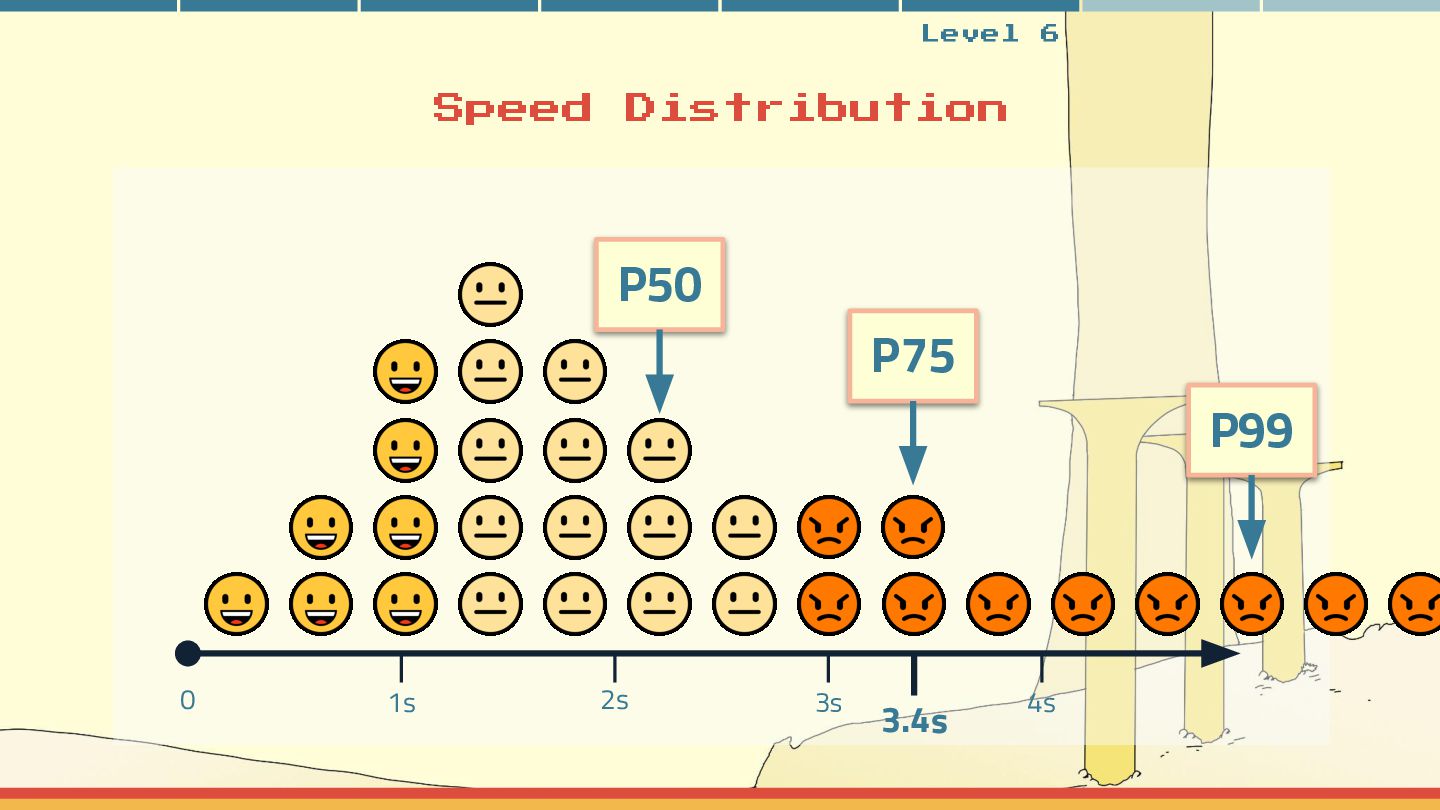
  6. Level 3 How Fast is My Site? 3.4 seconds (the

    time it takes to do one important thing) Good Needs Improvement Poor
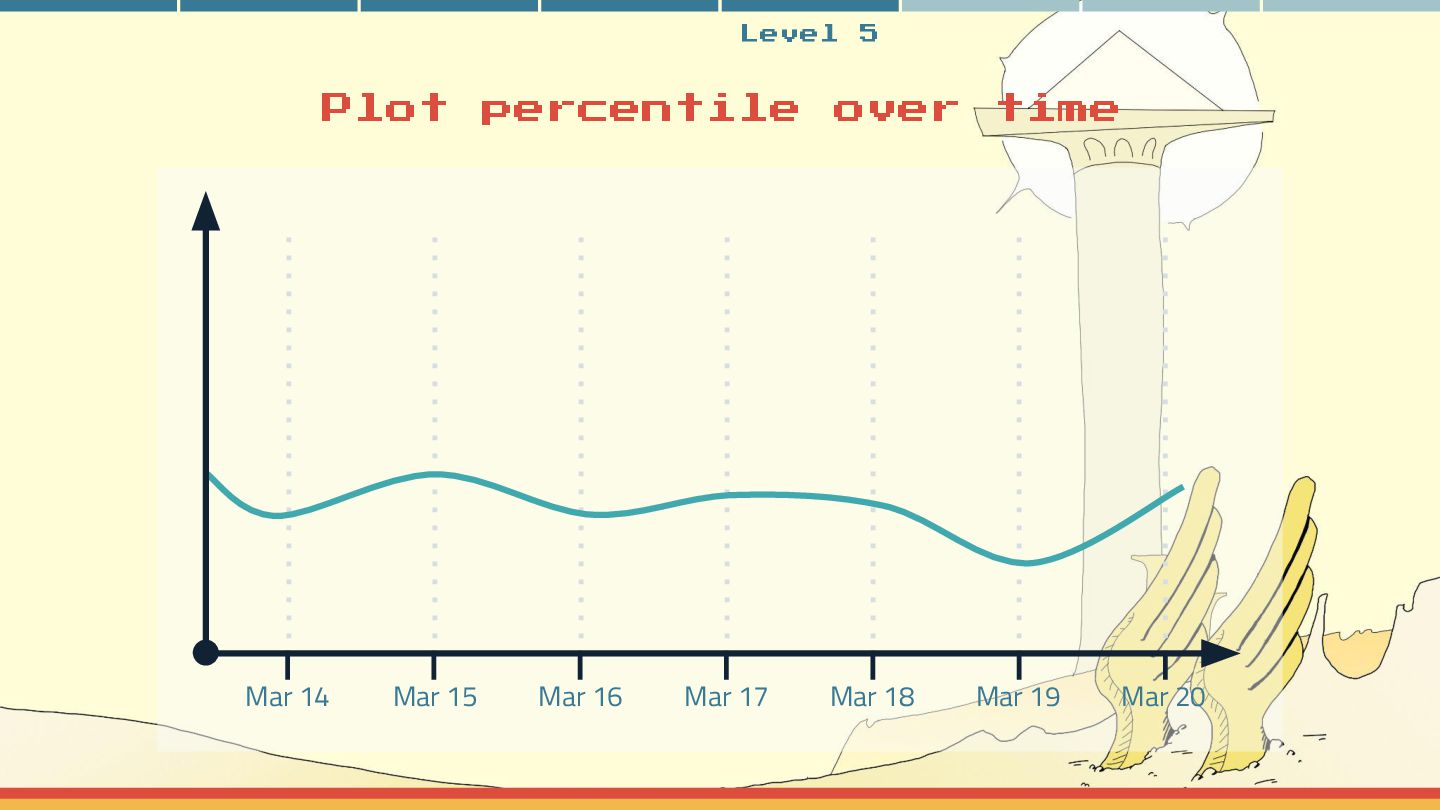
  7. Level Plot Mar 14 Mar 15 5 percentile over Mar

    16 Mar 17 Mar 18 time Mar 19 Mar 20
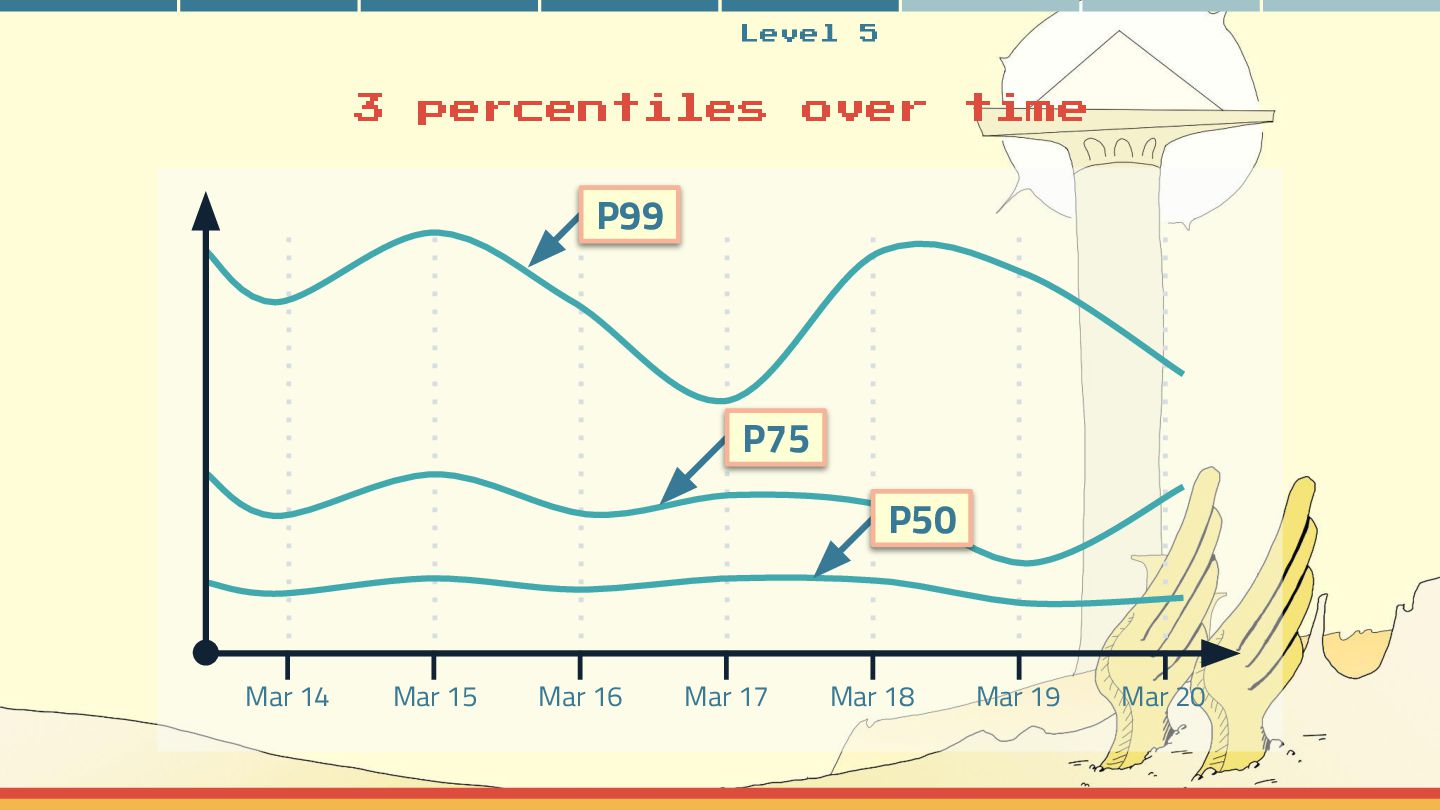
  8. Level 5 3 percentiles over time P99 P75 P50 Mar

    14 Mar 15 Mar 16 Mar 17 Mar 18 Mar 19 Mar 20