Upgrade to Pro — share decks privately, control downloads, hide ads and more …

Introduction to UX Speed

Sponsored · Ship Features Fearlessly Turn features on and off without deploys. Used by thousands of Ruby developers.

Introduction to UX Speed

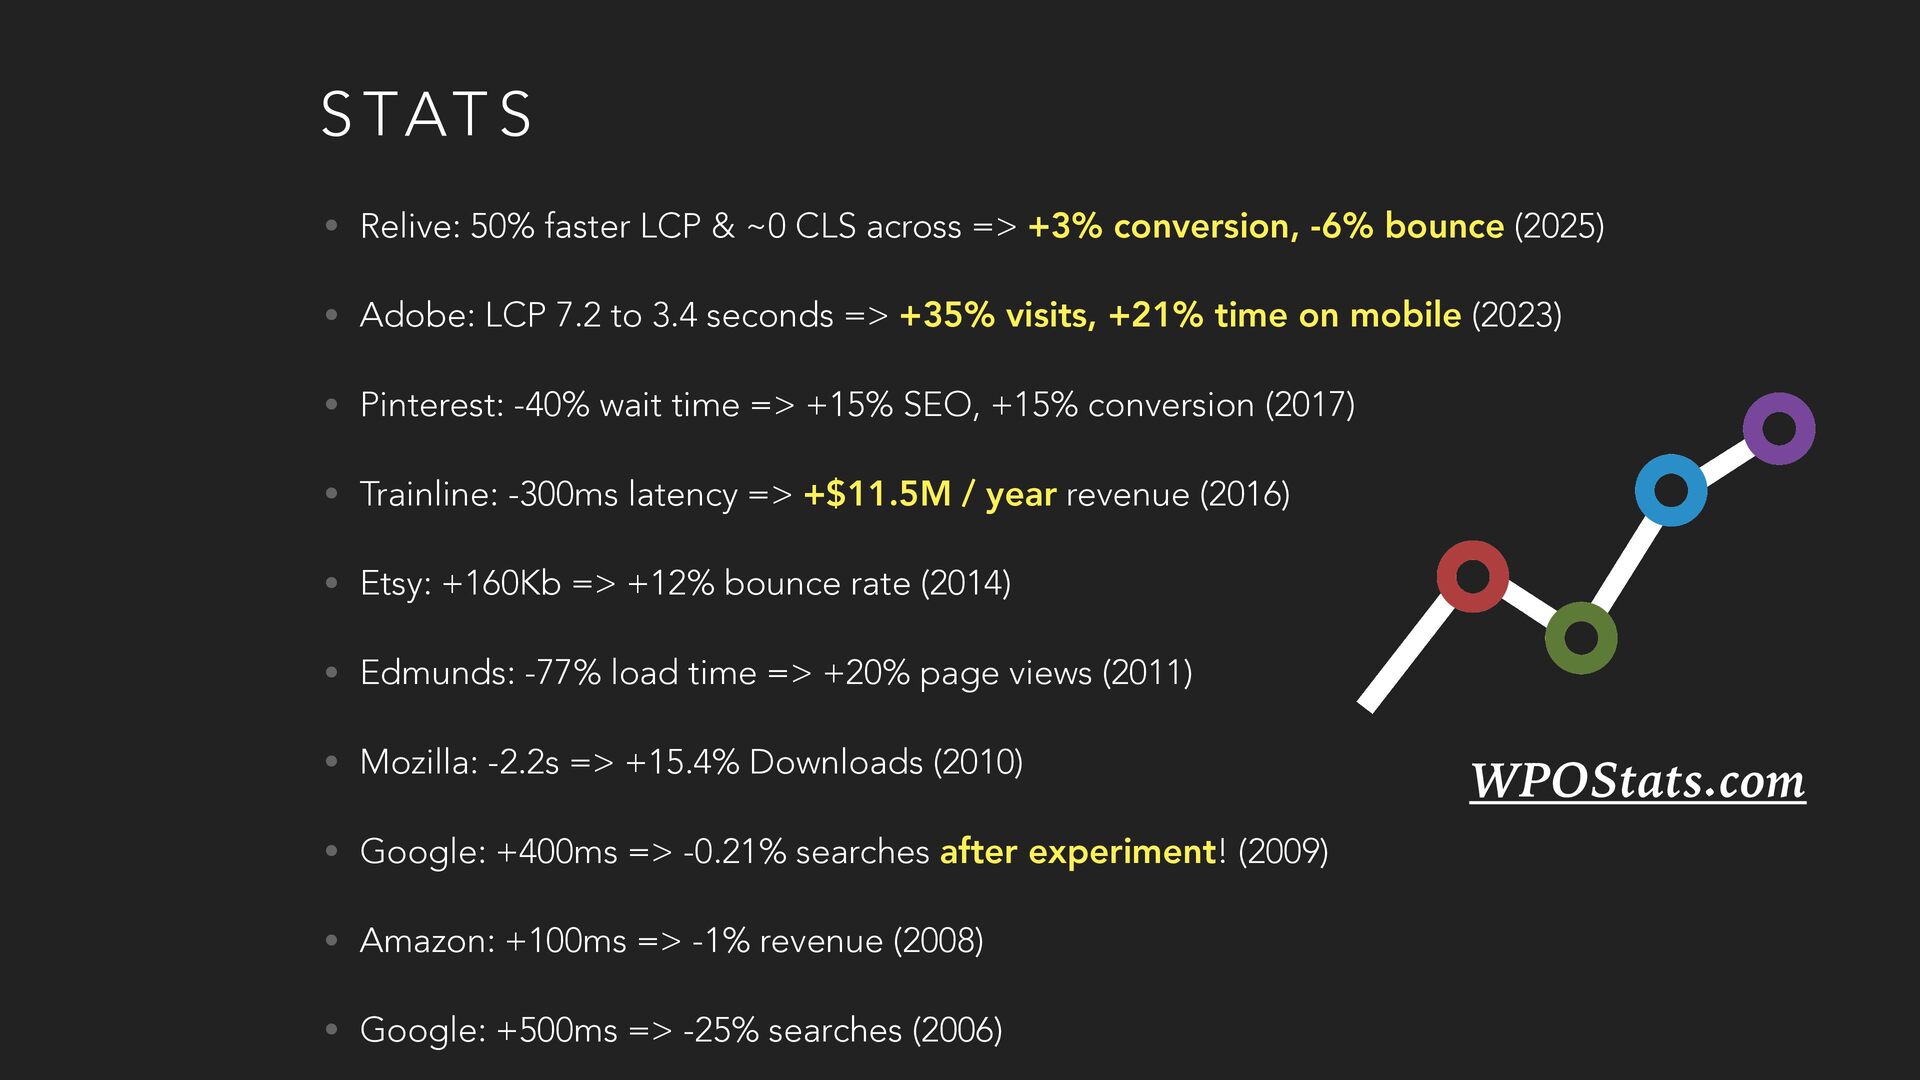
In this short workshop, Sergey Chernyshev will discuss why the Speed of User Experience matters and how to determine if your site is fast or slow.

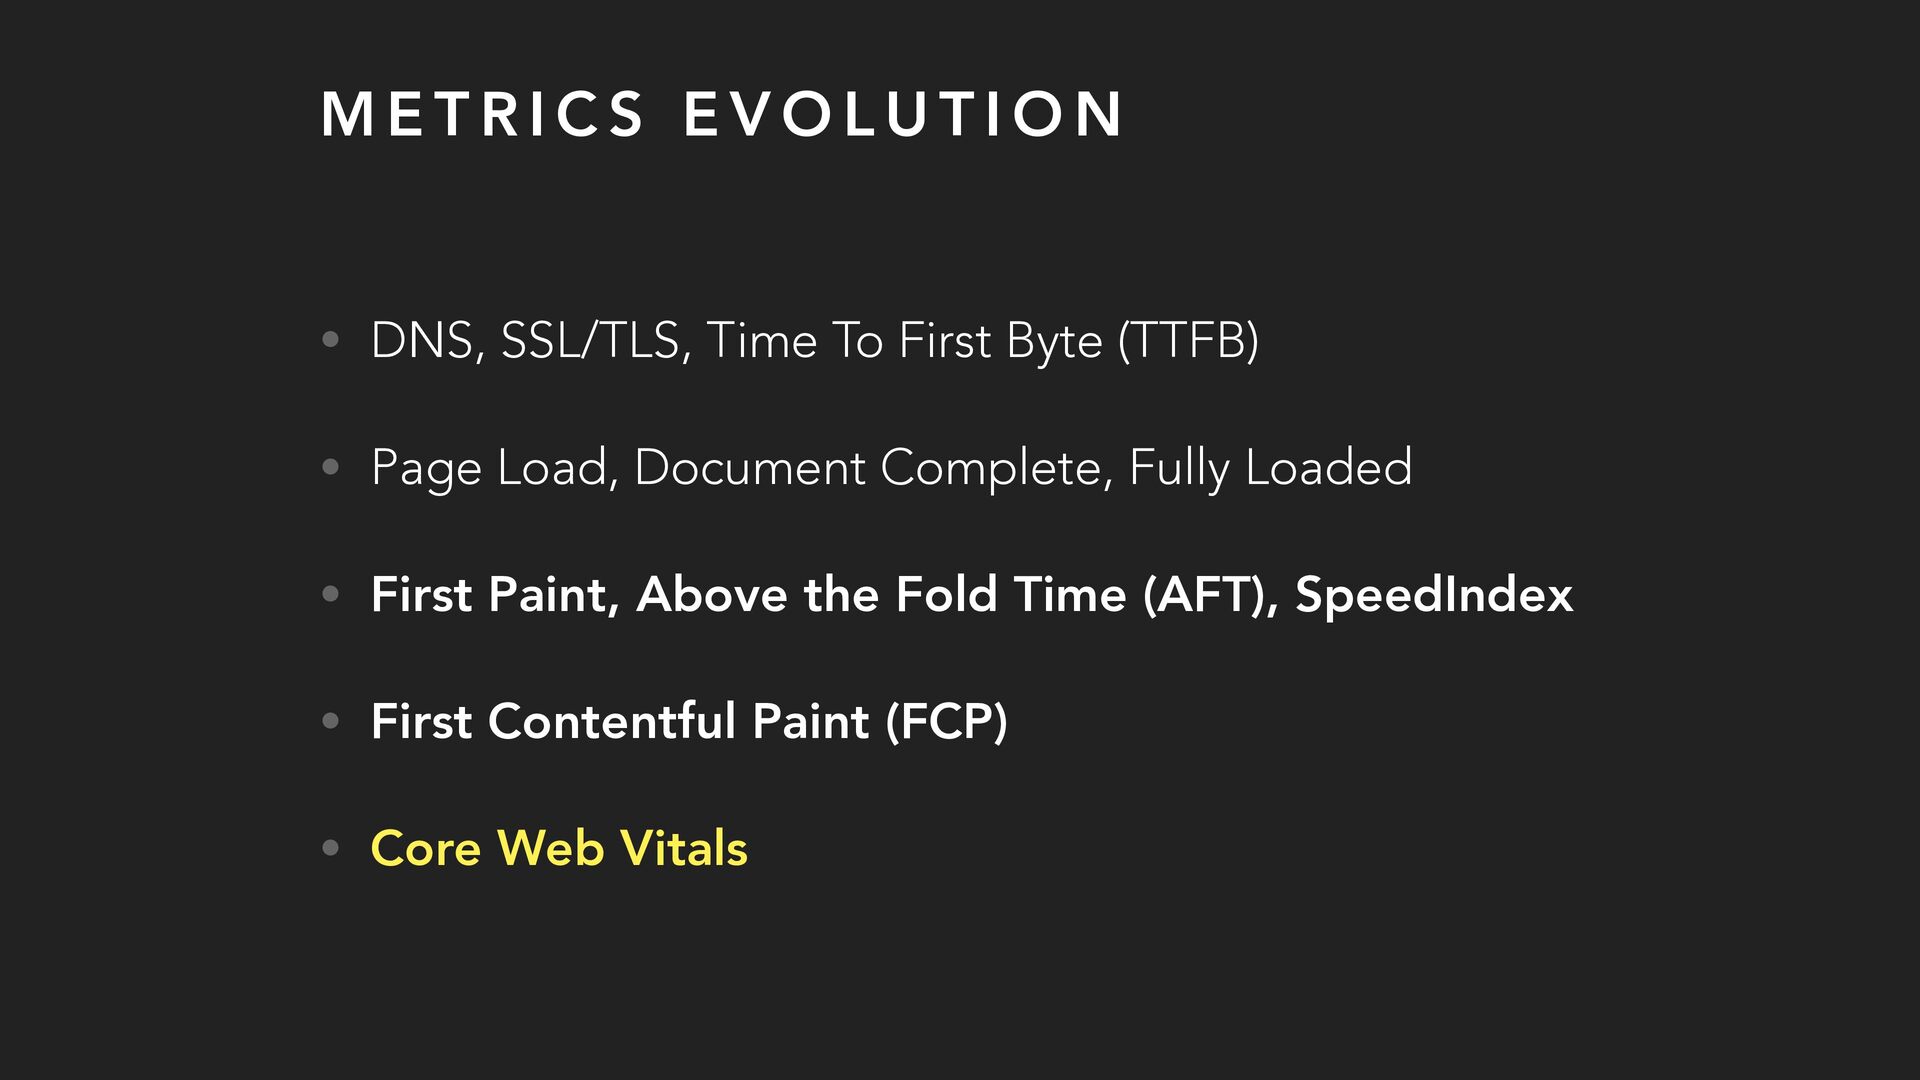
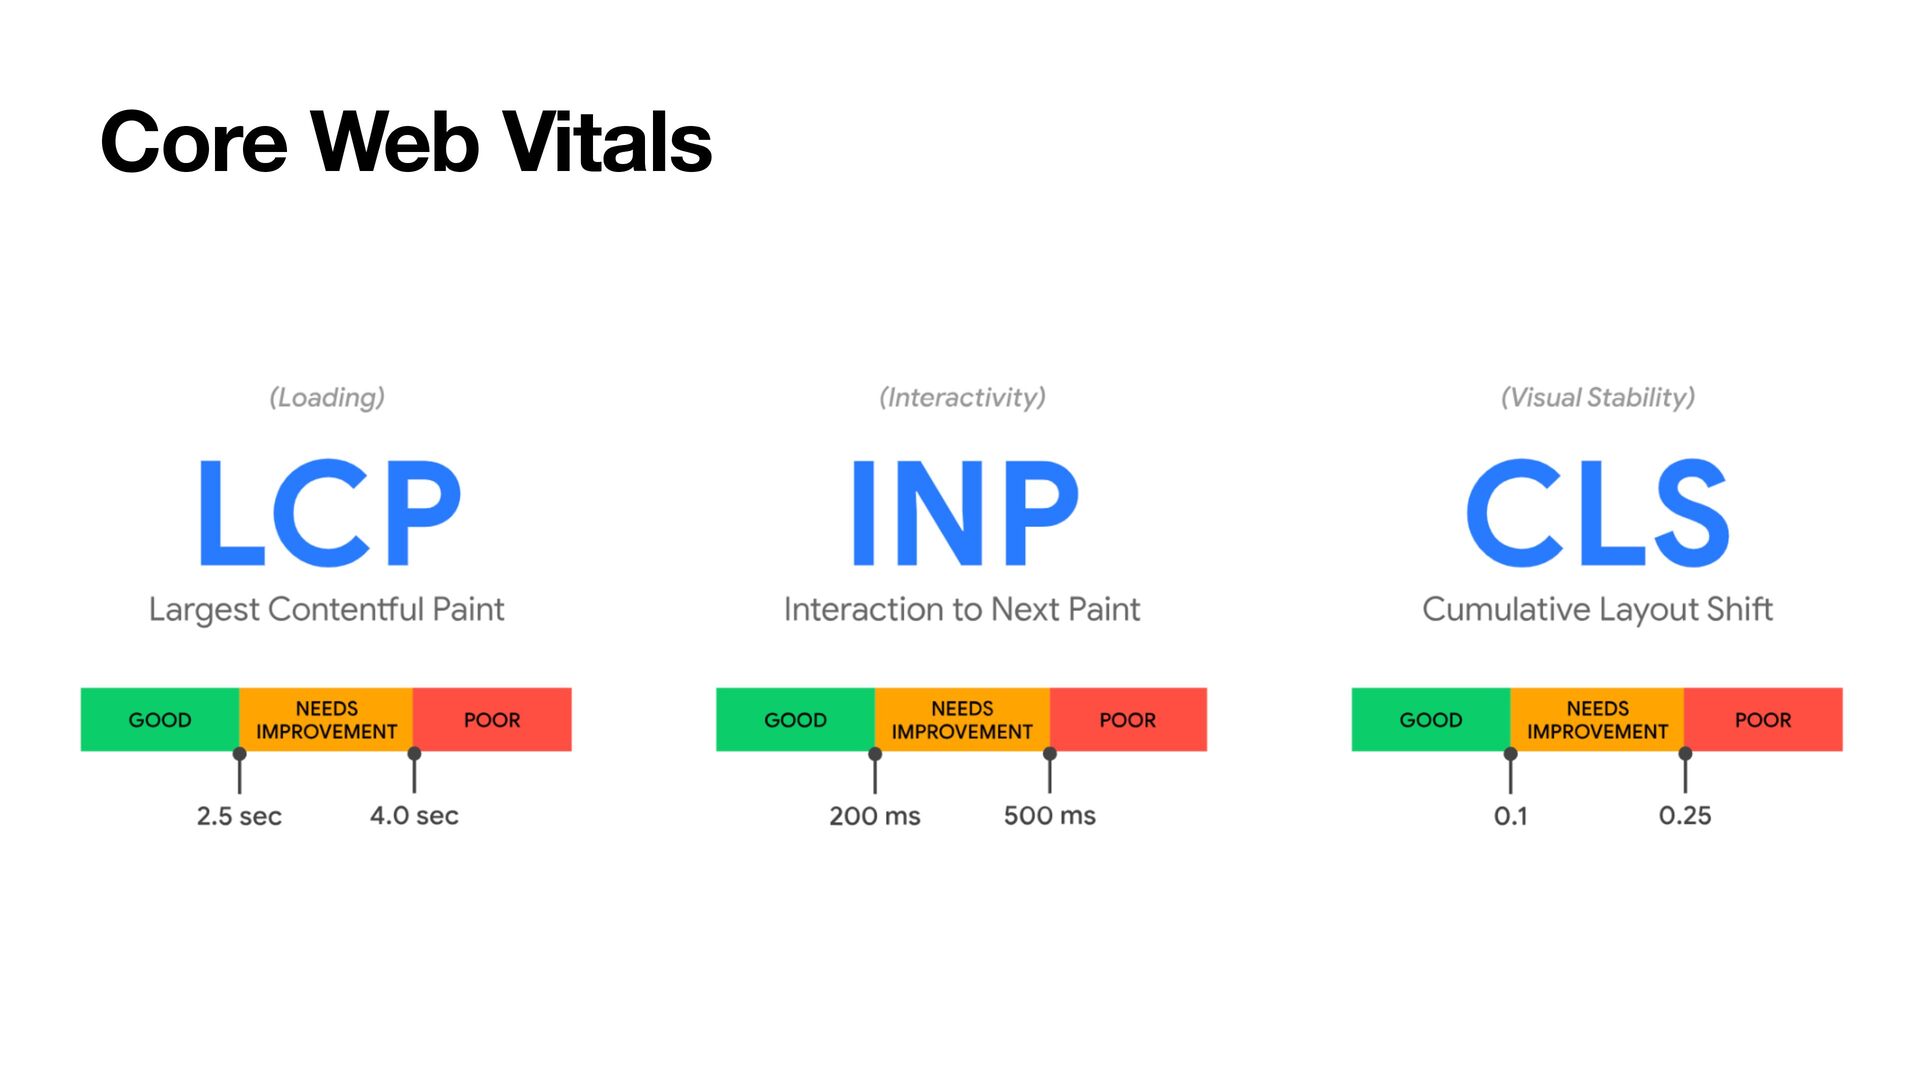
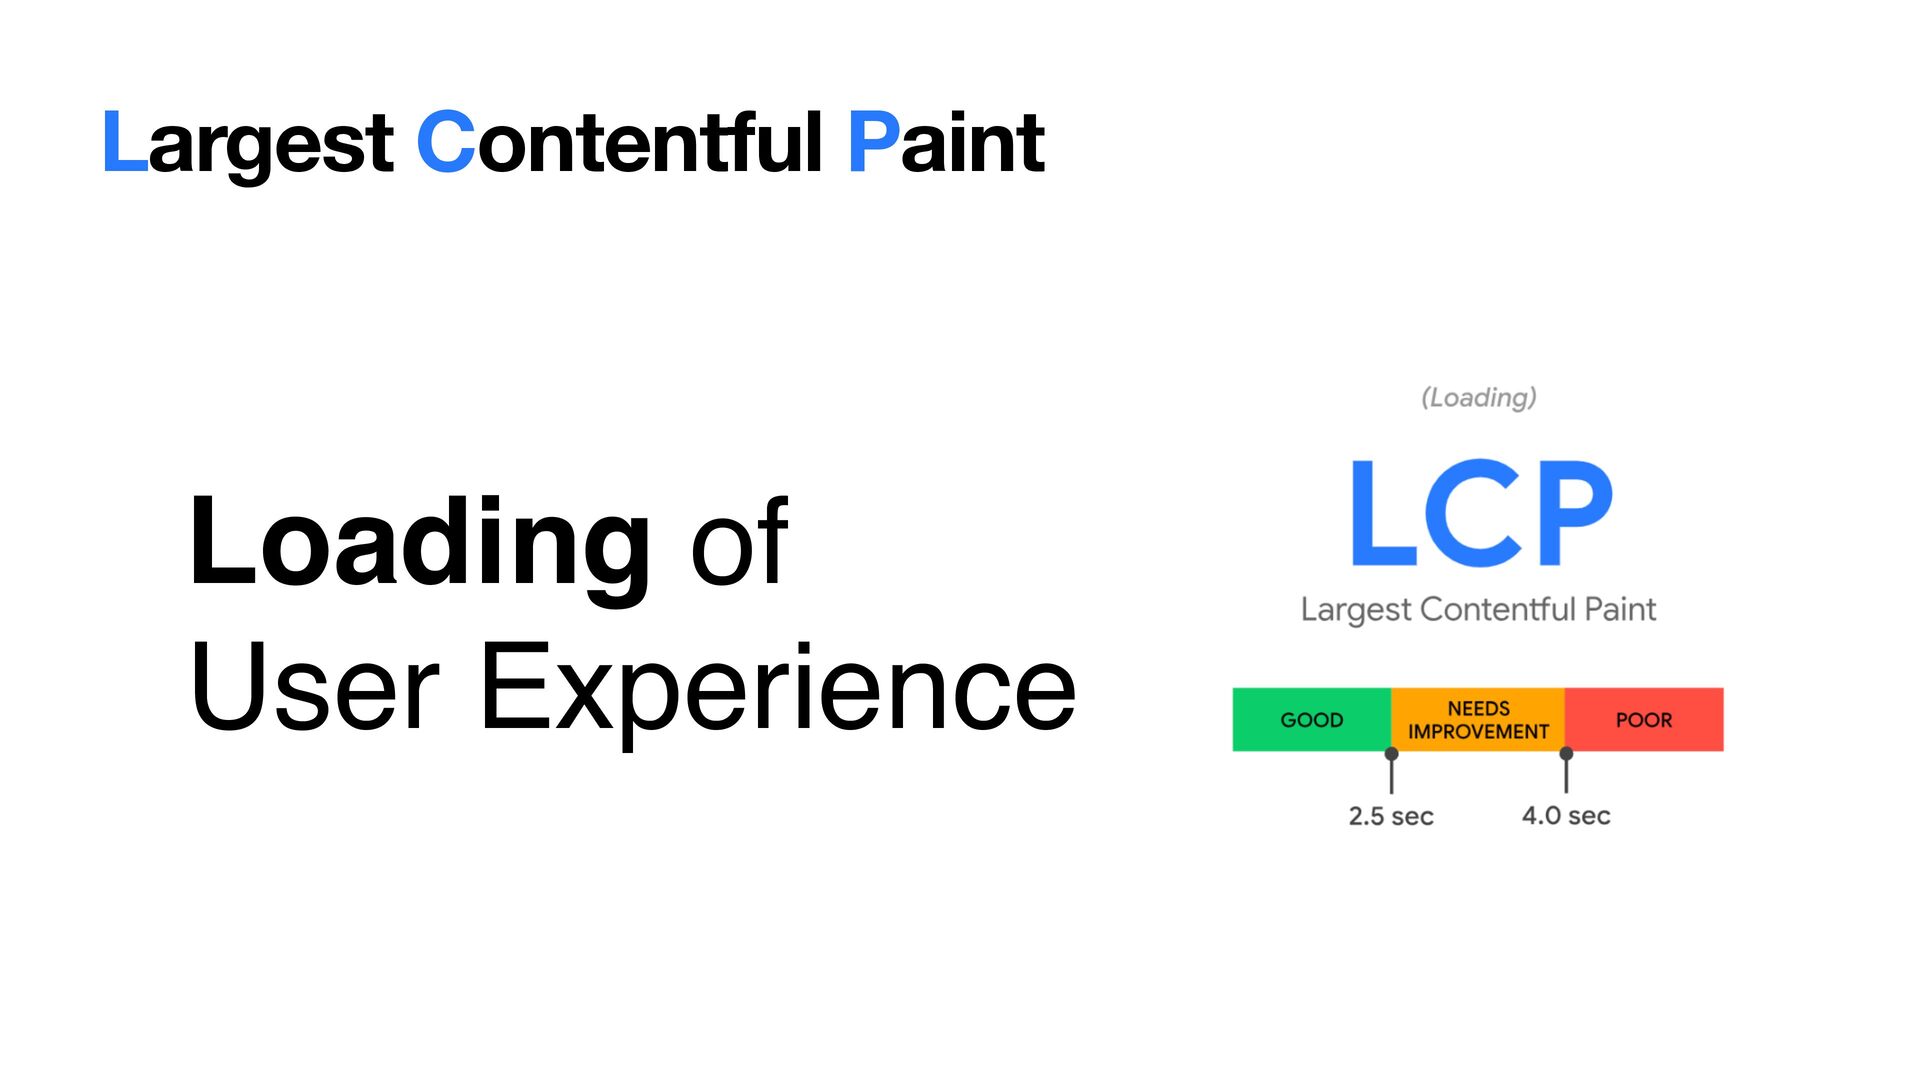
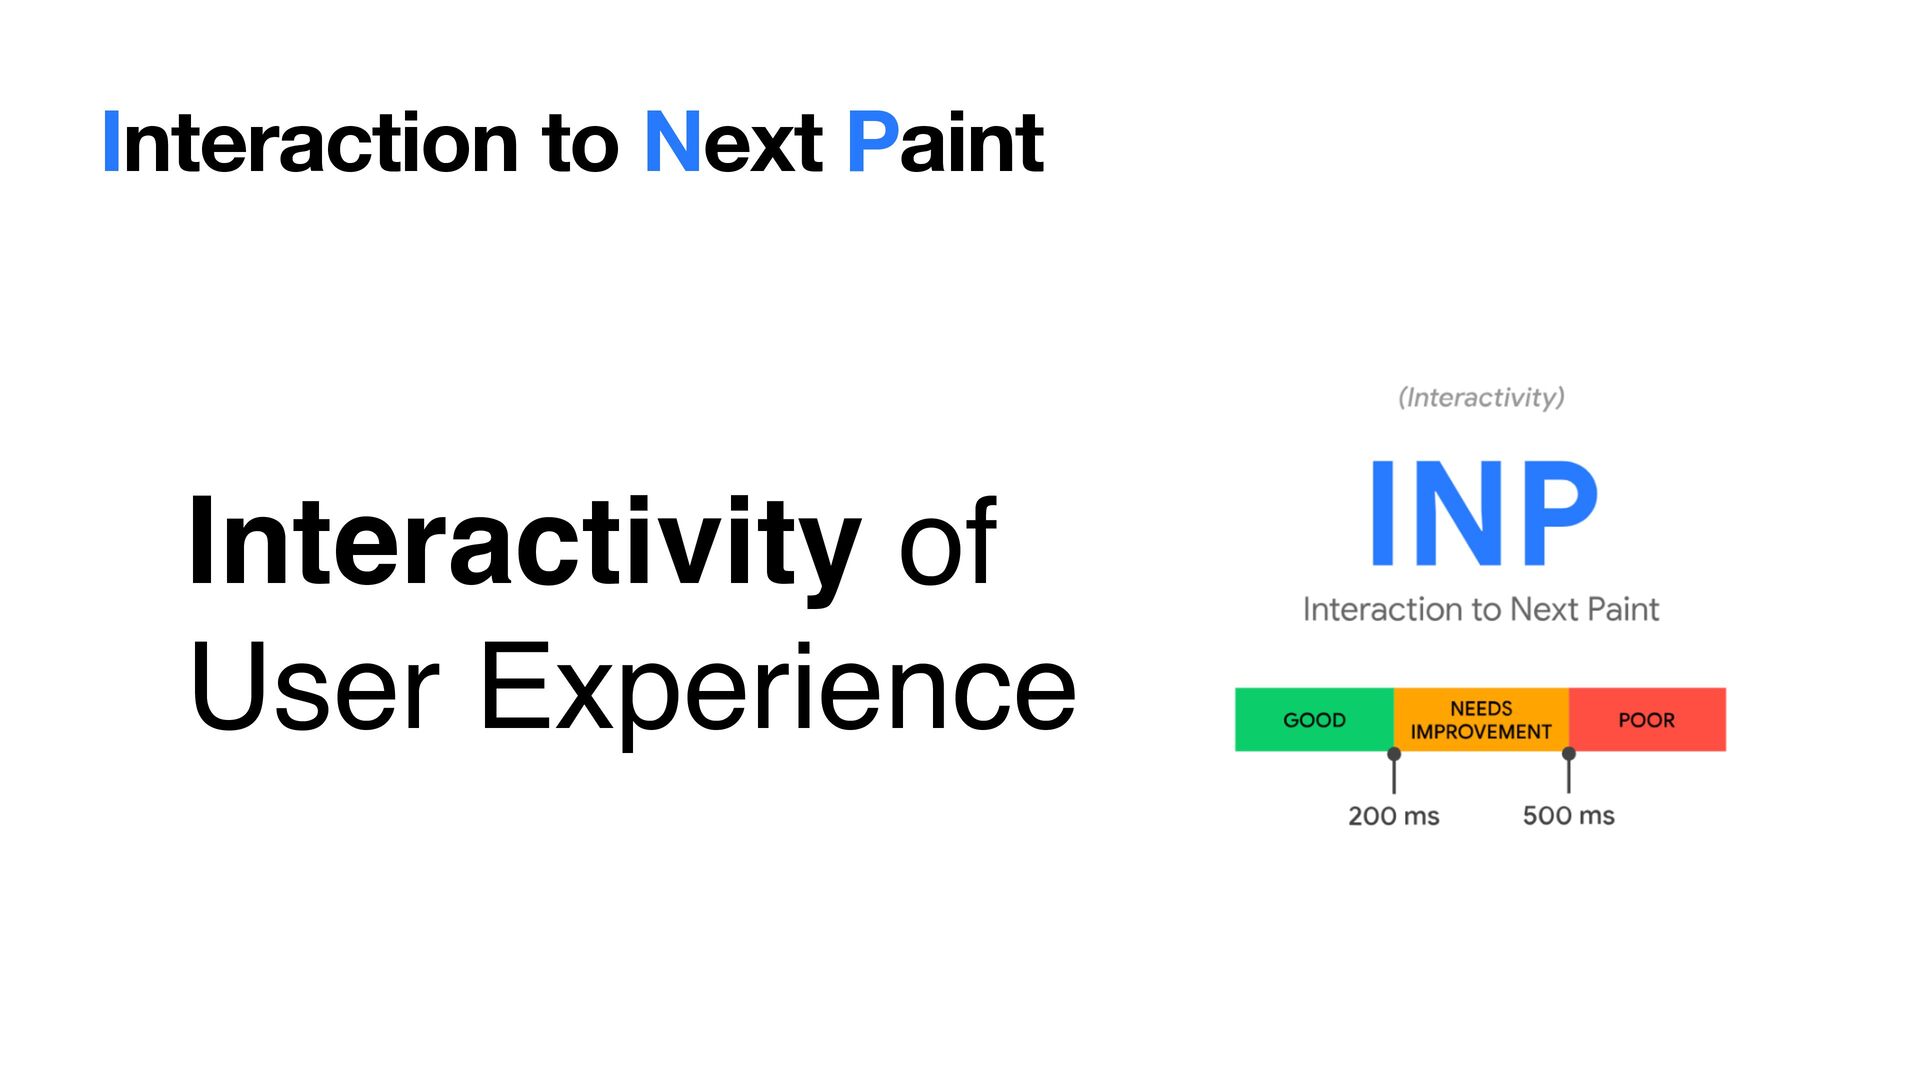
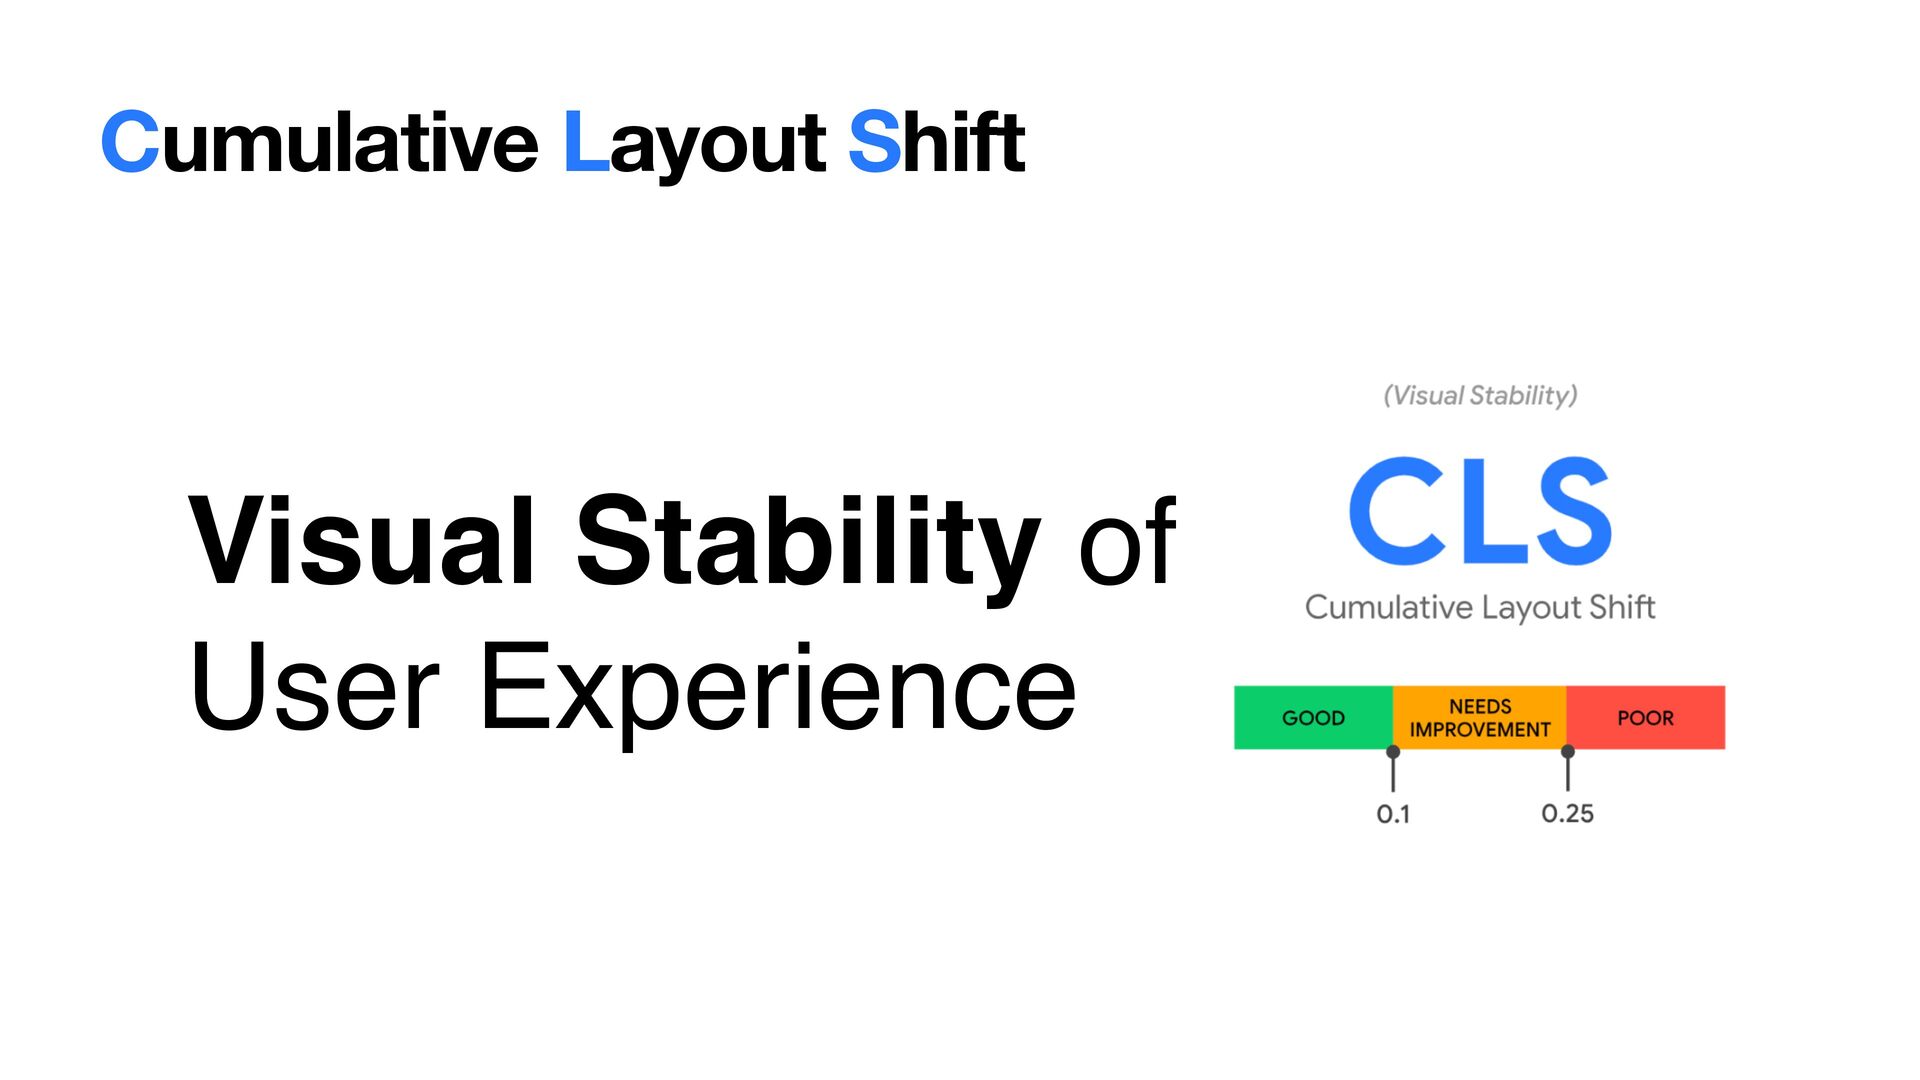
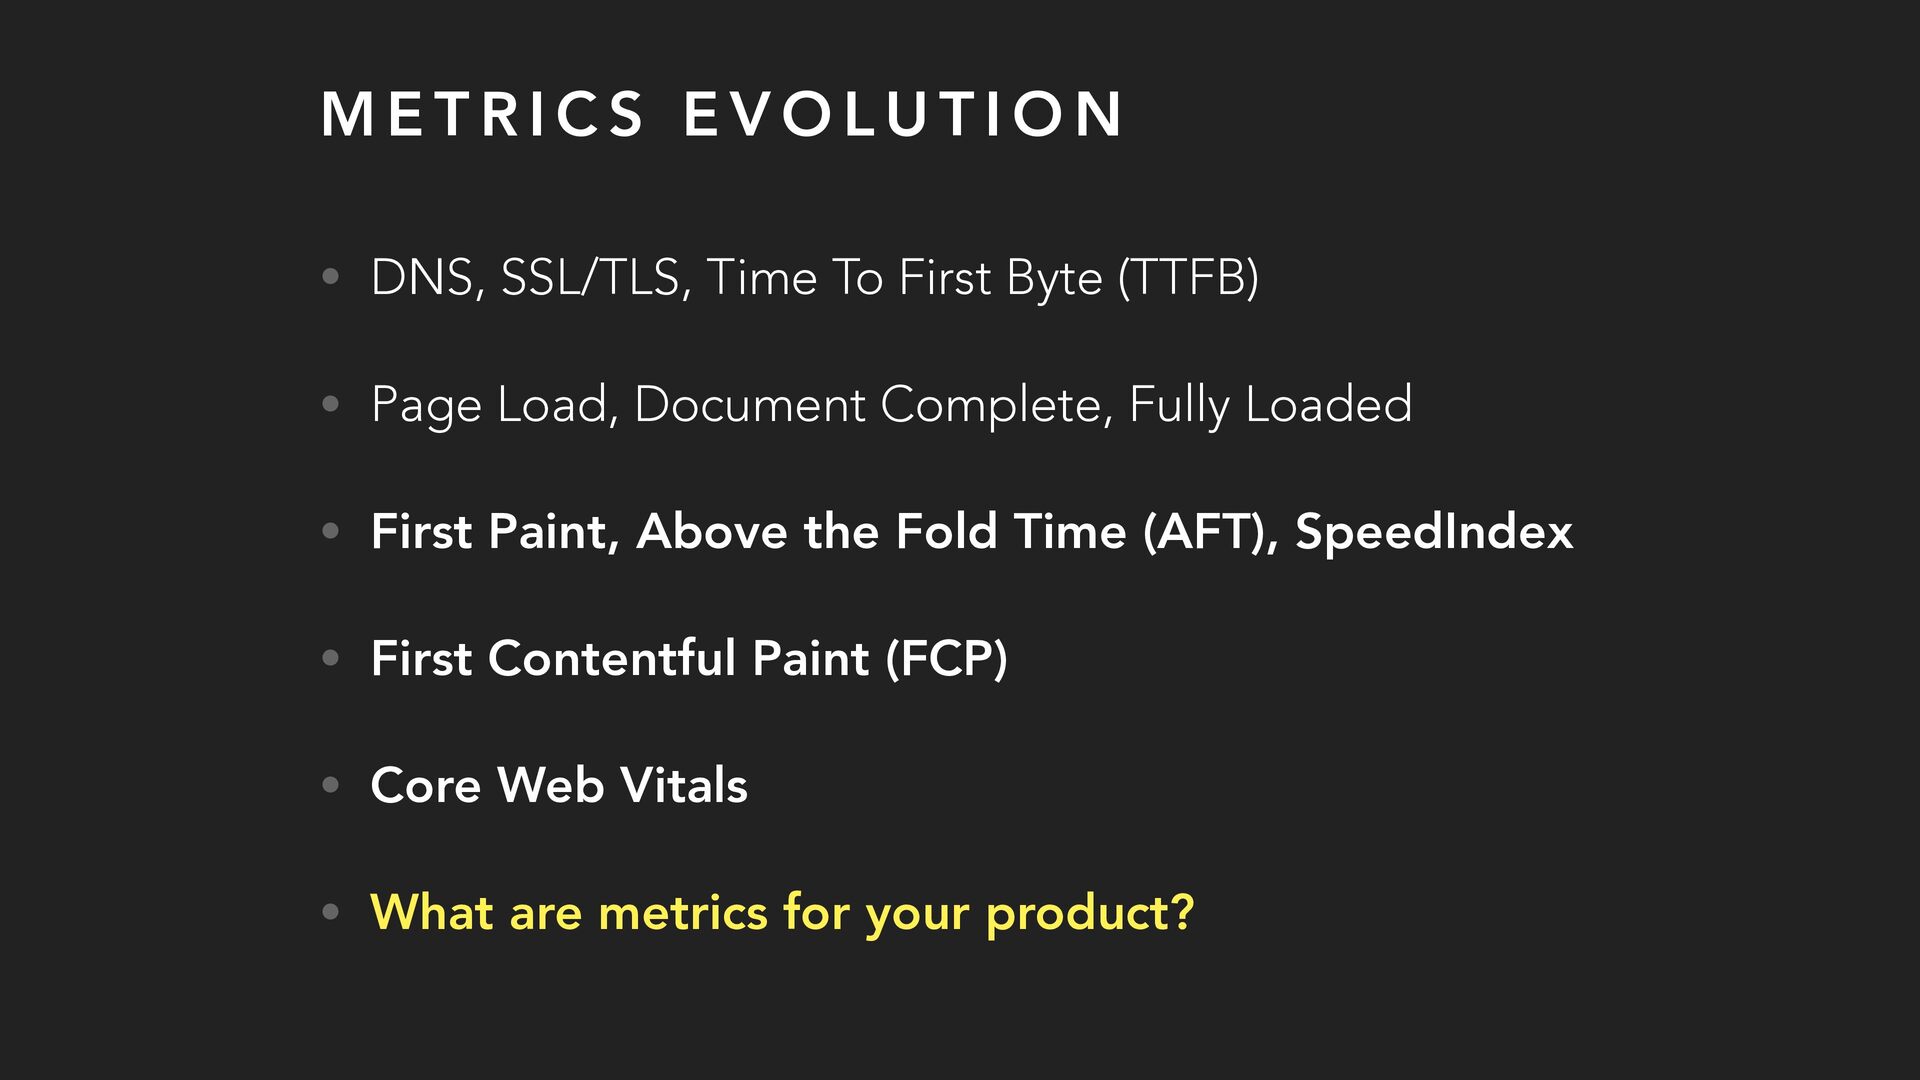
He will talk about web performance metrics in general and introduce Core Web Vitals - a set of metrics most commonly used to measure UX Speed.

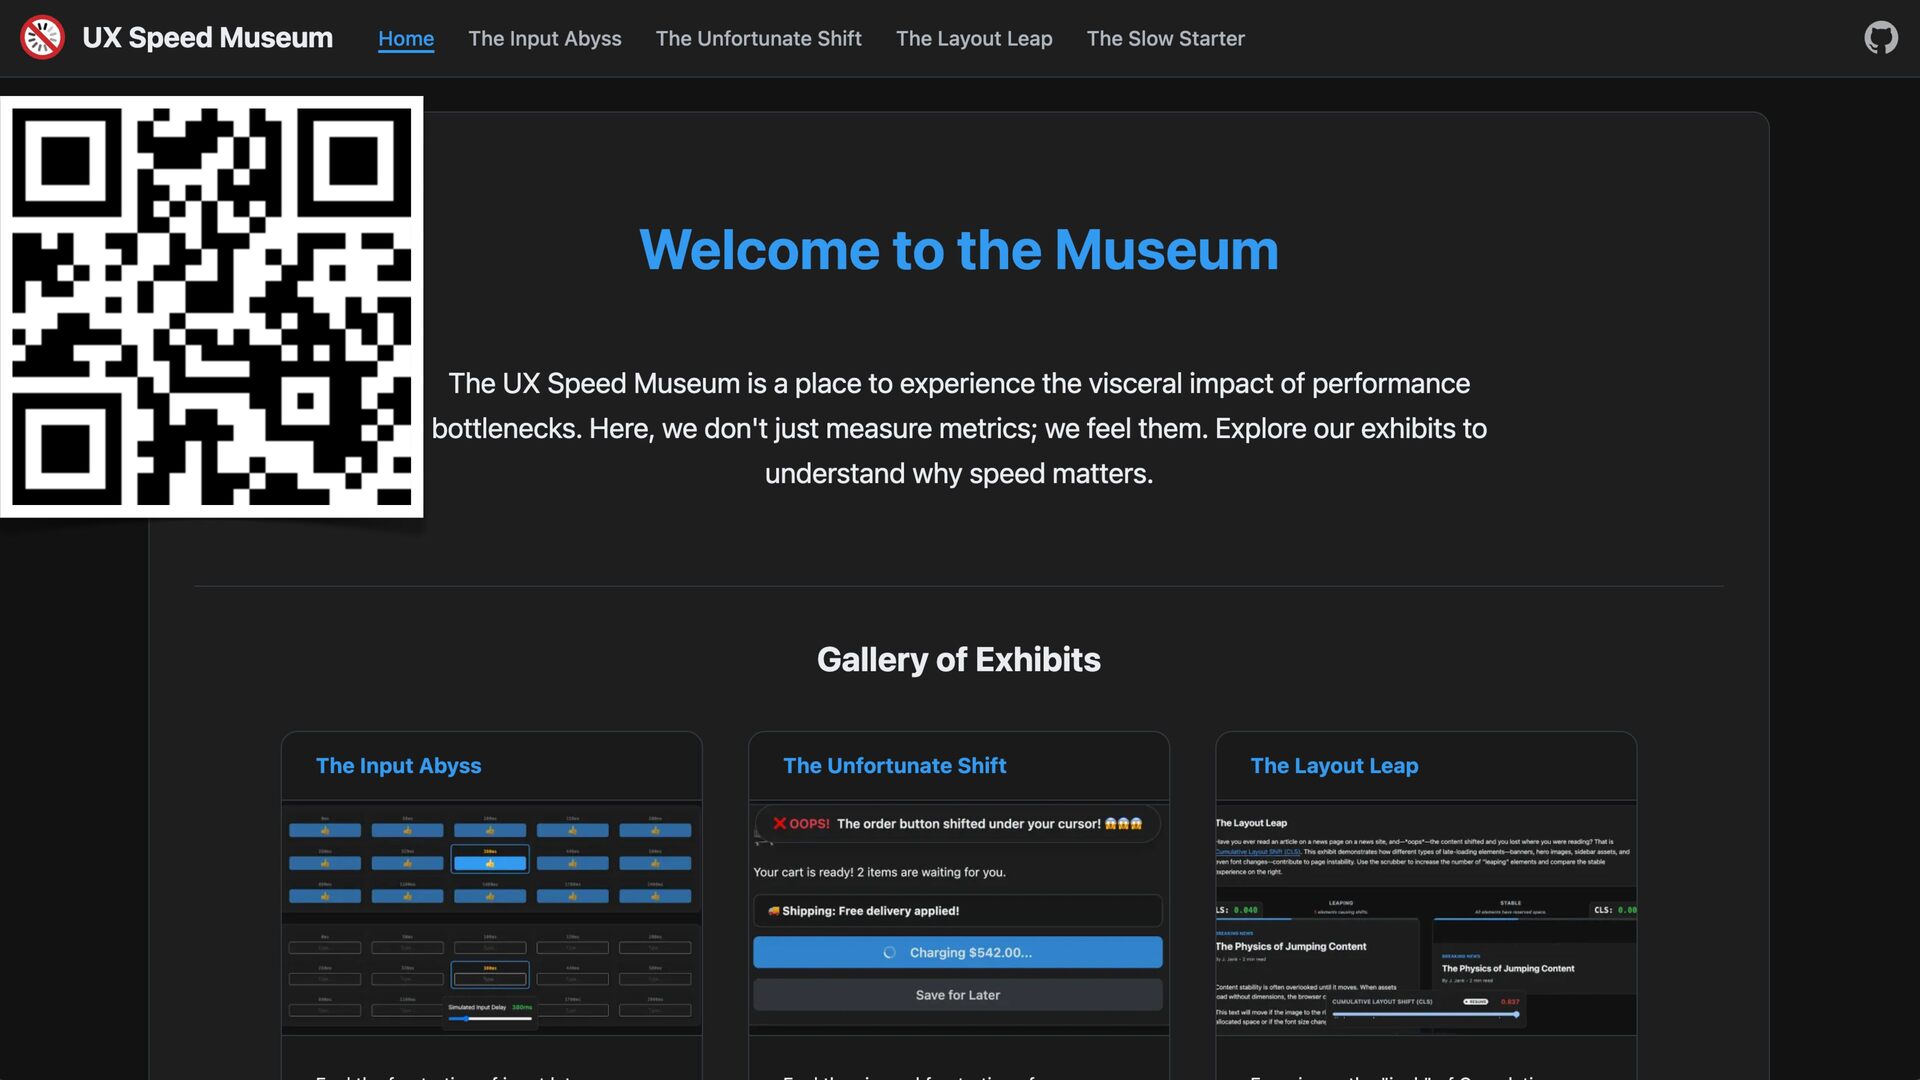
Sergey will then show a few most common problems causing slowdowns, and how to fix them. Don’t miss out on making your web experience speedier and better!

Avatar for Sergey Chernyshev

Sergey Chernyshev

May 19, 2026

More Decks by Sergey Chernyshev

Other Decks in Technology

Transcript

  1. Sergey Chernyshev — May 19, 2026 Introduction to UX Speed

    FKA Web Performance NY UX Speed & Web Performance Meetup
  2. Speed Engineer Designer • Web Performance engineer • Cloud fl

    are • Open Source developer • Organizer of NY UX Speed
 & Web Performance Meetup • Google Developer Expert
 in Web Performance • RUM-CG Member Sergey Chernyshev
  3. S TAT S • Relive: 50% faster LCP & ~0

    CLS across => +3% conversion, -6% bounce (2025) • Adobe: LCP 7.2 to 3.4 seconds => +35% visits, +21% time on mobile (2023) • Pinterest: -40% wait time => +15% SEO, +15% conversion (2017) • Trainline: -300ms latency => +$11.5M / year revenue (2016) • Etsy: +160Kb => +12% bounce rate (2014) • Edmunds: -77% load time => +20% page views (2011) • Mozilla: -2.2s => +15.4% Downloads (2010) • Google: +400ms => -0.21% searches after experiment! (2009) • Amazon: +100ms => -1% revenue (2008) • Google: +500ms => -25% searches (2006) WPOStats.com
  4. W H Y D O W E M E A

    S U R E S P E E D ? • Monitor for degradations (Ops) • Analyze code for perf issues (Devs) • Verify improvements (Devs, QA) • Prioritize improvements (Business) • Budget for WPO initiatives (Business)
  5. S Y N T H E T I C T

    E S T I N G & A N A LY S I S • From particular location • Tester controls instrumentation • One metric value • Data can have lots of details for analysis
  6. R E A L U S E R M E

    A S U R E M E N T • Real users (a lot of them) • A lot of data (need to store it) • All noise you can get, requires filtering • Metrics are distributions • Can correlate to business KPIs
  7. M E T R I C S E V O

    L U T I O N • DNS, SSL/TLS, Time To First Byte (TTFB) • Page Load, Document Complete, Fully Loaded • First Paint, Above the Fold Time (AFT), SpeedIndex • First Contentful Paint (FCP) • Core Web Vitals
  8. M E T R I C S E V O

    L U T I O N • DNS, SSL/TLS, Time To First Byte (TTFB) • Page Load, Document Complete, Fully Loaded • First Paint, Above the Fold Time (AFT), SpeedIndex • First Contentful Paint (FCP) • Core Web Vitals • What are metrics for your product?
  9. PROGRESSIVE ENHANCEMENT ➤ Main goals: 1. Enable features based on

    browser capabilities (e.g. JavaScript, image formats, local storage, gyro/compass) 2. Reveal features as page is being downloaded and constructed (render basic html + CSS, add JS handlers, fonts, etc)