Upgrade to Pro — share decks privately, control downloads, hide ads and more …

Why model? (Causal inference: What if, Chapter 11)

Shuntaro Sato
November 18, 2020

Why model? (Causal inference: What if, Chapter 11)

Keywords: 因果推論, Parametric(パラメトリック), Nonparametric(ノンパラメトリック), Smoothing, Bias-variance trade-off

Shuntaro Sato

November 18, 2020
Tweet

More Decks by Shuntaro Sato

Other Decks in Science

Transcript

  1. About Me • Ph.D(宇宙物理学) • IT業界でデータ分析、機械学習のビジネス活用 • 因果推論で困っていること ◦ サービス施策(e.g.

    マッチングアルゴリズム改善)の効果測定 ◦ マーケティングキャンペーンの施策効果 ◦ A/Bテスト基盤の設計 『データサイエンティスト養成読本 ビジネス活用編』(技術評論社) R. Sutton and A. Balto “Reinforcement Learning”(翻訳中)
  2. From Part I to Part II 1. A definition of

    causal effect 2. Randomized experiments 3. Observational studies 4. Effect modification 5. Interaction 6. Graphical representation of causal effects 7. Confounding 8. Selection bias 9. Measurement bias 10. Random variability 11. Why model? 12. IP weighting and marginal structural models 13. Standardization and the parametric g-formula 14. G-estimation of structural nested models 15. Outcome regression and propensity scores 16. Instrumental variable estimation 17. Causal survival analysis 18. Variable selection for causal inference 因果推論の基本となる考え方を学習 • Conceptual な例 • 手計算で確認できる理想的なデータ • Nonparametric estimator 実世界のデータとモデルを使った実践 • モデルの導入 • 計算機を活用した計算 • Parametric (model-based) estimator Part I: Causal inference without models Part II: Causal inference with models
  3. Chapter 11: Contents 11.1 Data cannot speak for themselves 11.2

    Parametric estimators of the conditional mean 11.3 Nonparametric estimators of the conditional mean 11.4 Smoothing 11.5 The bias-variance trade-off Fine Point & Technical Point ◦ Fisher consistency. ◦ Model dimensionality and the relation between frequentist and Bayesian intervals. ◦ A taxonomy of commonly used models.
  4. 11.1 Data cannot speak for themselves • Target Population: HIV感染者16人

    ◦ 十分大きな母集団(Super-population)から無作為にサンプル • Target populationのデータからtreatment に対するYの平均を知りたい ◦ Estimand: ◦ Estimator: Super-population A: 抗レトロウイルス療法 • binary, (multi-level, continuous) Y: CD4細胞数 [cells/mm3] • continuous Target population
  5. (Ref.) Estimand, Estimator, Estimate Bret Zeldow and Laura Hatfield, 2019,

    Difference-in-Differences, https://diff.healthpolicydatascience.org/ (Last access: 2020/07/24) The quantity we care about. (興味のある対象) The algorithm that takes data as input and produces a value of the estimand. (Estimandを求めるために用いられるアルゴリズム・関数) The estimator’s output, given data input. (Estimatorの出力・実現値)
  6. Estimand and estimator in the case Super-population Estimand • 母集団全体で

    A=a がどのような効果を及ぼすか Target population Estimator • Estimandを知るために、実際に得られるデータを処理する手順 • Consistent Estimator: データが増えるほど Estimandに近づくことが 期待されるEstimator(varianceが小さくなる) ◦ サンプル内の A=a に対するYの平均 ⇒ Consistent ◦ サンプル内で初めて得られた A=a の観測値 ⇒ Not Consistent
  7. Case1: A is dichotomous variable • Aが2値(A=1: Treatmentあり, A=0: Treatmentなし)の場合を考える

    ◦ Treated# = 8, Untreated# = 8 ※ https://github.com/jrfiedler/causal_inference_python_code を参考に一部描画の関数を調整 Fig 11.1 ⇒ A=1のグループではYがリフトしている Exchangeabilityが成立すれば、target populationでの average causal effect は 146.25 - 67.5 になる
  8. Case2: A is polytomous variable • Treatment levelに応じて、以下のように定義する ◦ A=1:

    No treatment, A=2: low-dose, A=3: medium-dose, A=4: high-dose(4人ずつ割り当て) ※ https://github.com/jrfiedler/causal_inference_python_code を参考に一部描画の関数を調整 Fig 11.2 categoly内のデータが少なくなるため、 estimateは unbiasだが95% CIの範囲は大きくなってしまう
  9. Case3: A is (continuous) variable • Aは薬の摂取量 [mg/day] ◦ 0-100のinteger

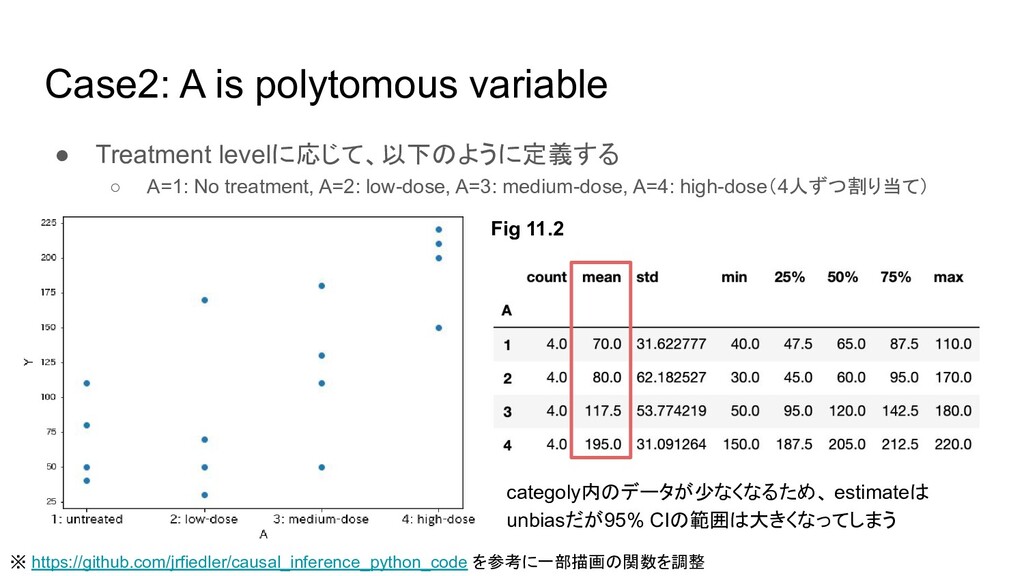
    valueを取る(ので、正確には discreteだが実数の場合でも同様の議論になる) ※ https://github.com/jrfiedler/causal_inference_python_code を参考に一部描画の関数を調整 Fig 11.3 Aのパターンがさらに増えるため、データが 取得できないものが存在する( e.g. A = 90) ⇒ sample averageが計算できなくなる (continuousだった場合はほぼ全ての Aで問題に) “The data cannot speak about themselves”
  10. Chapter 11: Contents 11.1 Data cannot speak for themselves 11.2

    Parametric estimators of the conditional mean 11.3 Nonparametric estimators of the conditional mean 11.4 Smoothing 11.5 The bias-variance trade-off Fine Point & Technical Point ◦ Fisher consistency. ◦ Model dimensionality and the relation between frequentist and Bayesian intervals. ◦ A taxonomy of commonly used models.
  11. 11.2 Parametric estimators of the conditional mean • 前節(Fig. 11.3)の問題

    ◦ A が多くのカテゴリであったり連続である場合、 sample averageが計算できなくなる ⇒ e.g. が評価できなくなる • 問題に対処するための考え方 ◦ A=90 におけるYの平均は、A=80における平均とA=100における平均の間にならないか? ◦ (さらに突っ込んで)YはAに対して線形に応答していたりしないか? ▪ この仮定が成り立つと、 A=90での効果は他のデータからの内挿で評価できて嬉しい Conditional mean function の形がパラメータ と の線形結合で表せると仮定 (制限)する Linear Mean Model
  12. Parameter estimation through ordinary least squares • 仮定したLinear Mean Modelに従ってパラメータを推定

    ◦ ここではOLS(Ordinary Least Squares)を利用 ※ https://github.com/jrfiedler/causal_inference_python_code を参考に一部描画の関数を調整 Fig 11.4
  13. Parameter estimation through ordinary least squares • モデルの制約を導入することで任意のAに対して が求まる ◦

    OLSは全データ点を用いるため、 A=90を求めるのに他のA=aの情報を活用していることに相当 ※ https://github.com/jrfiedler/causal_inference_python_code を参考に一部描画の関数を調整 実際、(データが得られない) A=90の場合には、
  14. From “parametric” to “nonparametric” • Parametric Estimatorにより、直接評価できない量を評価することができた • But this

    is not free lunch…. ◦ A prioriなモデルの制約が正しい時にしか評価は正しくならない ◦ “No model misspecification” かどうかに依存 ◦ このような理想的な状態が成立することはほとんどなく、 ある程度のmisspecificationは織り込まないといけないだろう • Parametricではない方法で修正することはできないか? ⇒ Nonparametric Estimator(次節)
  15. Chapter 11: Contents 11.1 Data cannot speak for themselves 11.2

    Parametric estimators of the conditional mean 11.3 Nonparametric estimators of the conditional mean 11.4 Smoothing 11.5 The bias-variance trade-off Fine Point & Technical Point ◦ Fisher consistency. ◦ Model dimensionality and the relation between frequentist and Bayesian intervals. ◦ A taxonomy of commonly used models.
  16. 11.3 Nonparametric estimators of the conditional mean • 再びdichotomousなAを考える ◦

    Treatmentの有無による効果 , を知りたい • 方法1: Linear modelによる評価 Fig 11.1
  17. Saturated Model • モデルを以下のように書き換えてみる(∵ A is dichotomous) ◦ これは、 と

    の差が であると言っているにすぎない ◦ 実際、Aが2値の場合にはモデルは何も制約を行っておらず、パラメータを使わずに評価可能 • Modelがデータ分布に制約を行わない場合、特にSaturated Modelと呼ぶ ◦ 本書では、何らかの a prioriな制約をデータ分布に課すものを ”Model”と呼ぶ ◦ Saturated Modelも一般的にはModelではあるが、本書の文脈における ”Model”とは区別する • conditional mean modelのパラメータ数が、未知のconditional meanの数と 等しい場合にSaturated Modelになる ◦ 上述の例でもモデルのパラメータ数( 2個)と未知のconditional mean数(2個)が一致
  18. Parsimonious Model • 同様の議論がFig11.3でも成立するか考える ◦ モデルのパラメータは , の2個 ◦ 未知のconditional

    meanは ,..., の101個 ◦ 両者が一致しないので当然 Saturated Modelにはならない ◦ 少数のパラメータでより多くの未知量を求めようとしている場合、モデルは parsimonious(けち)であると言う Fig 11.3
  19. Nonparametric Estimator • PartIで扱ってきた因果推論の手法は全てNonparametric Estimatorを利用 ◦ standardization, IP weightning, stratification,

    matching • PartIIではParametric Estimatorを用いて因果推論を展開していく ◦ あるtreatment levelにデータがなくても が評価できる(e.g. Fig11.3のA=90) ◦ 疑問:大雑把に「positivityが成立していなくでも、他のデータと correctly specifiedなモデルでデータ構 造が推定できれば、因果推論ができるようになる」と解釈していい? Conditional Mean Functionに何ら a priori な制約を与えないで 、Estimateを作り出すことができる Estimatorのこと(より詳しくはFine Point11.1で) Nonparametric Estimator とは?(本書の定義)
  20. Chapter 11: Contents 11.1 Data cannot speak for themselves 11.2

    Parametric estimators of the conditional mean 11.3 Nonparametric estimators of the conditional mean 11.4 Smoothing 11.5 The bias-variance trade-off Fine Point & Technical Point • Fisher consistency. • Model dimensionality and the relation between frequentist and Bayesian intervals. • A taxonomy of commonly used models.
  21. Flexibility of linear models • 先に述べたシナリオでは直線関係の制約は不適切になる • linear modelは柔軟に拡張できる(e.g. 2次の項を追加)

    ◦ A2は非線形関係を意味するが、パラメータとの線形結合で表されるという意味で引き続き linear modelの枠組みとして扱える ◦ 疑問:因果推論では AとA2は同じcovariateと呼んでも問題ない?区別するべき? Modelが“Linear”であるという場合は、 2つの意味があるので注意。 • 変数の線形結合で表現されるモデル(直線関係) • 変数の関数の線形結合 で表現されるモデル(関数は何でもよく、非線形関係にも拡張できる) Note
  22. Higher-order modification and smoothness • 原理的には、パラメータの数を更に増やしていくことも可能 ◦ A2だけでなく、A3, A4, ….,

    A16を追加するなど(図は 5次までの項でフィットした例) ◦ 一般的に、高次の項を追加していくと形状が波打つようになる( wiggly and less smooth) ◦ ここではsmoothという言葉を「低次の関数で表現できる形」くらいの意味で使っている模様 1st-order (smoothest model) 2nd-order 5th-order (less smooth model)
  23. Degree of smoothing and trade-off • モデリングはnoisy dataをless smoothな曲線に表現する手続きと考えられる ◦

    16次まで使う場合: ほぼデータ点を内挿するだけのモデルになり未知データの評価に前後の情報しか活用できない ◦ 1次しか使わない場合: 未知データの評価に全 Target populationの情報が活用できるが、 過剰な単純化は評価にバイアスをもたらす可能性がある(後述) ⇒ 適度なレベルのsmoothingを行いたい(c.f. bias-variance trade-off)
  24. Chapter 11: Contents 11.1 Data cannot speak for themselves 11.2

    Parametric estimators of the conditional mean 11.3 Nonparametric estimators of the conditional mean 11.4 Smoothing 11.5 The bias-variance trade-off Fine Point & Technical Point ◦ Fisher consistency. ◦ Model dimensionality and the relation between frequentist and Bayesian intervals. ◦ A taxonomy of commonly used models.
  25. More on biases introduced by degree of smoothing • もし

    が真に曲線関係なのであれば、2-parameter modelは適切ではない ◦ モデルのmisspecificationにより不要なバイアスを導入してしまうことになる • もし が真に直線関係なのであればどちらのモデルもcorrectly specified ◦ 3-parameterでも において2-parameterの評価と一致する(包含関係がある) ◦ 安全な戦略は3-parameterを使うこと ▪ 直線関係も内包するし、 バイアスが入りづらくなる ▪ 疑問:とはいえ、現実的には観測誤差に影響されたりするので、高次な項をやたらと 導入するとそれはそれでバイアスの原因になるのでは? ◦ 一方、3-parameterでは95% CIはより広くなってしまう( varianceが大きくなる)
  26. The bias-variance trade-off 2-parameter model 3- (or more) parameter model

    関数は直線的でsmoothest 関数は曲線的でless smooth 直線関係でないとcorrectly specifiedでなくなり、 biasが導入されてしまう 直線関係も含むため biasの影響を受けにくい varianceが小さい varianceが大きい The bias-variance trade-off
  27. Balancing Trade-off • 結局どうすればいいの? ◦ バイアスの許容度、パラメータの解釈性、計算リソースなどをもとに分析者が判断するしかない ◦ 機械学習論文でもよく議論されるポイント • 本書で登場するモデルはcorrectly

    specifiedであると仮定する ◦ 現実的な仮定ではないが、モデルの妥当性以外の話題に集中するため ◦ 次節以降では、本節で導入したモデルを用いてどのように因果推論が行われるか考えていく “We are now ready to describe the use of models for causal inference.”
  28. Chapter 11: Contents 11.1 Data cannot speak for themselves 11.2

    Parametric estimators of the conditional mean 11.3 Nonparametric estimators of the conditional mean 11.4 Smoothing 11.5 The bias-variance trade-off Fine Point & Technical Point ◦ Fisher consistency. ◦ Model dimensionality and the relation between frequentist and Bayesian intervals. ◦ A taxonomy of commonly used models.
  29. Fine Point 11.1 Fisher consistency • 本書のnonparametric estimatorはFisher consistent estimatorと類似

    • “あるサンプルにおける Estimateを計算するためのEstimatorを母集団に対して適用した際に、 真のパラメータに一致すること ”(ざっくりとした説明) • 未知のパラメータ によって表される母集団の分布関数 があるとする※1 • サンプルを抽出し、実際に観測された経験分布 からEstimateが得られる • この時、Estimator が次を満たせば、この EstimatorはFisher consistentであるという • Fisher consistent estimatorは、saturated modelにおけるnonparametric※2な最尤推定量ともいえる Fisher Consistency ※1 https://www.asc.ohio-state.edu/lee.2272//881/consistency.pdf ※2 統計の文献によってはカーネル回帰のような Fisher consistentではないが弱い制約を与えるものを nonparametricと呼ぶ場合がある
  30. Fine Point 11.2 Model dimensionality and the relation between frequentist

    and Bayesian intervals. • 確率は頻度によって定義される • 信頼区間(95% CI): 得られたデータから 100個の信頼区間を作った時に真値を含む区間が 95個 • Chap10で導入されたCIはこの立場を取る Frequentist perspective(頻度主義) • 確率は信用(belief)の度合いによって定義される • 信用区間(95% CI): 真値が区間に含まれている確率が 95% ⇒ 意味としては直感的 • 研究者の“degree of belief”を導入するため、使われる場面は多くない Bayesian perspective(ベイズ主義) • 立場によって信頼区間(信用区間)の捉え方は異なる
  31. Fine Point 11.2 Model dimensionality and the relation between frequentist

    and Bayesian intervals. • モデルの複雑さ(次元)によって挙動は異なる ◦ 低次モデルかつサンプルサイズが大きい場合は Confidence IntervalとCredible Intervalは同じ ◦ 高次のモデルの場合は両者は異なる • ベイズでは全ての未知パラメータについて事前分布を仮定する必要がある ◦ 低次モデルで大量のデータがある場合は、事前分布( prior)にsensitiveではない ◦ 高次モデルでは、事前分布を適切に選んでいないと真値を外しやすくなる
  32. Technical Point 11.1 A taxonomy of commonly used models. •

    本章では、linear conditional mean modelとして以下のような式を使った • この関係はlink関数 を用いることで、以下のように拡張できる ◦ link関数には、logやlogitのような非線形関数を使える(上の式は恒等写像を使った特別な場合) (定数項) (Covariates)
  33. Examples of link function and corresponding equation • logを使う場合(Yが常に正であることを保証できる) •

    logitを使う場合(Yが(0, 1)に含まれることを保証できる) ⇒ ⇒ Link関数にlogitを使った場合はロジスティック回帰( logistic regression)になる
  34. Conditional mean model as semiparametric model • Conditional mean modelは

    をパラメトライズするが、 や をパラメータでモデル化している訳ではない ◦ その意味で、このモデルは semiparametric model として見ることもできる
  35. Other generalizations • Conditional mean modelは様々な一般化ができる ◦ カーネル回帰モデル(関数の形を特定しないで行う回帰) ◦ Generalized

    additive models (GAMs; 一般化加法モデル) ▪ 変数の線形結合をより一般的な滑らかな関数の和として表現 : が0で最大値を取り、0から離れるに従い0に近づくカーネル関数
  36. Is kernel regression model a nonparametric model? • カーネル回帰は特定の関数形の制約をせず、 の推定には

    周辺のデータのみが使われる(どこまで使うかはhで調整できる) • カーネル回帰モデルは”nonparametric” regression modelではあるが、本書での nonparametricとは意味が異なるので注意 ◦ なぜなら、本文では のデータのみを使うものを nonparametricと表現していたから
  37. Discussion Memo 1. 95%信頼区間について(STDとCIについてN依存を混同した説明をしてしまったことへのコメント) 2. model misspecificationに関する研究について Imamura : STD

    `は標準偏差でNに関係なく、95% CIは標準誤差に由来しNに依存、、SDとCIは別の話と思いました。 KRSK :Model misspecificationに対して結果がどれくらい頑健なのかをシミュレーションとかでみたメソッド論文とかどなたか知りません? T O : > KRSK さん どういうペーパーだったか全く思い出せませんが、何度か読んだ記憶があります。色々と出ているような気がします。 Sato : >Model misspecificationに対して結果がどれくらい頑健なのかをシミュレーションとかでみたメソッド論文 -> 僕も知りたいです!ただ,settingによるかと思うのですが,どのようなsettngを想定していますか? KRSK : いや、例えば連続変数のconfounderに対してlinear functional formを誤設定したときに、曝露の効果推定にはどの程度影響があ るのかなあって思いました。因果推論では曝露の推定値に関心があるわけですが、モデル中の曝露以外の部分の誤設定ってどの程度影響 してくるのかなって。 Sato : >KRSKさん ダブルロバストのモチベーションにもなってると思うのでそこから孫引きできそうですね. T O : > KRSKさん 自分が直近で読んだ(理解はしていない)ものでお求めのものに近しいかもしれないのがStatist. Med. 2014, 33 4053–407です https://onlinelibrary.wiley.com/doi/10.1002/sim.6207 KRSK : Vansteelandtですね! T O : >KRSKさん はい、恐らくLSHTMdeで名の知れたcausal inferenceの数少ない先生のお一人であります!
  38. Discussion Memo 3. Structual positivityとrandom positivityについて(本資料p20の疑問点) 4. Covariateについて(本資料p23の疑問点) KRSK :

    Random positivityをparametric modelで克服する、ということだと思います。 KRSK : まあ別になんでもいいんじゃないですか?笑 Imamura : 同じではないかと。 kobayashi : モデルに組み込んでいるんだったら区別したい方向性な気はします。 KRSK : Aというcovariateに対して、Functional formを設定していると私は解釈します Imamura : すみません、Not 同じ という意味でした。 T O : 自分もfunctional formとして捉えています 5. Bias-variance tradeoffでのvarianceとは? Daisuke : bias-variance tradeoffのvarianceっていわゆる統計の分散と同じ意味なのでしょうか?もしくはmodelの複雑さみたいな意味な のでしょうか? ⇒前者、という見解
  39. Discussion Memo 6. Bias-variance tradeoffの分解について T O : Bias-variance trade

    offで、irreducible errorまで分解する書き方と、そうでない書き方があると思うんですけど、どちらの方が好 ましいとか、ご意見のある方いらっしゃいますか? Matsumoto : このあたりは machine learning畑の人の考え方を聞いてみたいですね Miyagi : PRML3.2節に機械学習からみたバイアスバリアンス分解の解説がありますね kobayashi : 機械学習では複雑性誤差と呼ばれることもあって、その時は分散より広いニュアンスがある気がしますが、バリアンスは 普通は統計的な分散と思っていて良いと思います。 7. Consistent Estimatorについて Mitani : consistentって、biasedでも極限とって一致すればいいんじゃなかったでしたっけ。 ben_key : L2収束するとき、n増大に従ってunbiasedとvariance0が確率収束になるのでunbiasは必要です (漸近不偏と言う意味で 必要) KRSK : ん?unbiasedがconsistentであるために必要ということです?Biased but consistent estimatorみたいなのって普通にありま せん? しんめ : Biasedでもconsistentな推定量,wikiにも載ってます https://en.wikipedia.org/wiki/Consistent_estimator#Unbiased_but_not_consistent Yamazaki : 今の議論のconsistentとは何でしょうか? T O : Nを大きくすると真値に確率収束するという方のconsistentですよね?
  40. Discussion Memo 7. Consistent Estimatorについて(cont.) ben_key : >TO さん、KRSKさん >consistencyとunbiasedの意見の差異について

    私が書いた、"「L2で収束するなら」→「lim E(X_n-θ)=0 lim V(X_n) =0で plim」"は正しいです。 wikipediaのbiased but consistentは、二つの例sample varianceとanother exampleがあります。 前者はcorrection係数(n-1で割るアレ)が1になり、漸近不偏であり上記に矛盾しません。 後者はL2収束しない例なので、上記のstatementに対してout of scope、となります。 なので、一応矛盾はないことになります。 (ところで、実用的な観点から、L2収束しない推定量を扱うことってあるんでしょうか) Ono : 本書では,10章のTechnical Point 10.1を読むとUANUのことを”unbiased “と,Fine Point 11.1を読むとFisher consistentのこ とを”consistent”と呼んでいると思われます.この本のunbiasedやconsistentが,普通の unbiased や consistentと,どこが似ていて, どこが違っているのか,私はよく分かりません…. T O : > ben_key さん “「L2で収束するなら」→「lim E(X_n-θ)=0 lim V(X_n) =0で plim」" これはasymptotic unbiasedでconsistentと いうことですか? すいません、始めの主張をちゃんと理解できていないかもしれません。(あとL2収束の意味も抑えられてないです) ben_key : >TOさん 「ある範囲に制限した時、asymptotic unbiasedかつ分散0ならconsistent」という主張です ご理解の通りかと思います。 L2はきっちり理解する必要はなく、そう言う種類の収束が存在する、とお考えいただければ問題ございません ※ bein_keyさんが後日ブログで整理されています。https://ben-key.hatenablog.com/entry/2020/07/26/014134