Upgrade to Pro
— share decks privately, control downloads, hide ads and more …
Speaker Deck
Features
Speaker Deck
PRO
Sign in
Sign up for free
Search
Search
Creating data driven value and insights
Search
Steph de Silva
May 17, 2018
Business
270
0
Share
Creating data driven value and insights
A talk for the CPA Emerging Leaders Conference.
Steph de Silva
May 17, 2018
Other Decks in Business
See All in Business
suisei.inc_ company deck
suisei2015
0
390
政策共創事例集2025
polipoli
0
320
インターセクト会社説明資料
intersect
0
250
ログラス会社紹介資料 / Loglass Company Deck
loglass2019
17
540k
『今日から使える認知行動療法』でみつけた もっと人生をたのしむヒント
mkitahara01985
1
670
AWTTの歩き方〜Tableau編〜
leafyoh
0
230
経営管理について / About Corporate Planning
loglass2019
1
34k
セーフィー株式会社(Safie Inc.) 会社紹介資料
safie_recruit
7
450k
パーソルクロステクノロジー_DXソリューション本部のご紹介 / Introduction_of_dx
pxt_gs_ssol
0
2k
kakaopiccoma_engineer_recruitingguide
kakaojapan
1
130
DMM.com コーポレートブック
dmm
2
480k
【結果報告】Claude×Linearで会社のタスク管理をAIにまかせて1ヶ月。業務効率150%向上したが、AIネイティブカンパニーを目指すならもっと「加速への狂気」が必要
nagatsu
0
330
Featured
See All Featured
From Legacy to Launchpad: Building Startup-Ready Communities
dugsong
0
220
Agile Leadership in an Agile Organization
kimpetersen
PRO
0
160
Highjacked: Video Game Concept Design
rkendrick25
PRO
1
380
Marketing to machines
jonoalderson
1
5.3k
SEO Brein meetup: CTRL+C is not how to scale international SEO
lindahogenes
1
2.7k
Conquering PDFs: document understanding beyond plain text
inesmontani
PRO
4
2.8k
Easily Structure & Communicate Ideas using Wireframe
afnizarnur
194
17k
Sharpening the Axe: The Primacy of Toolmaking
bcantrill
46
2.8k
Evolving SEO for Evolving Search Engines
ryanjones
0
210
Cheating the UX When There Is Nothing More to Optimize - PixelPioneers
stephaniewalter
287
14k
HU Berlin: Industrial-Strength Natural Language Processing with spaCy and Prodigy
inesmontani
PRO
0
400
Money Talks: Using Revenue to Get Sh*t Done
nikkihalliwell
0
240
Transcript
Creating Data driven value and insights Steph de Silva, Ph.D.
Rex Analytics
The Data sciences Extracting and creating value
Kickstarter: creating value with Stories Started in April 2009 Users
tell their stories, readers pledge
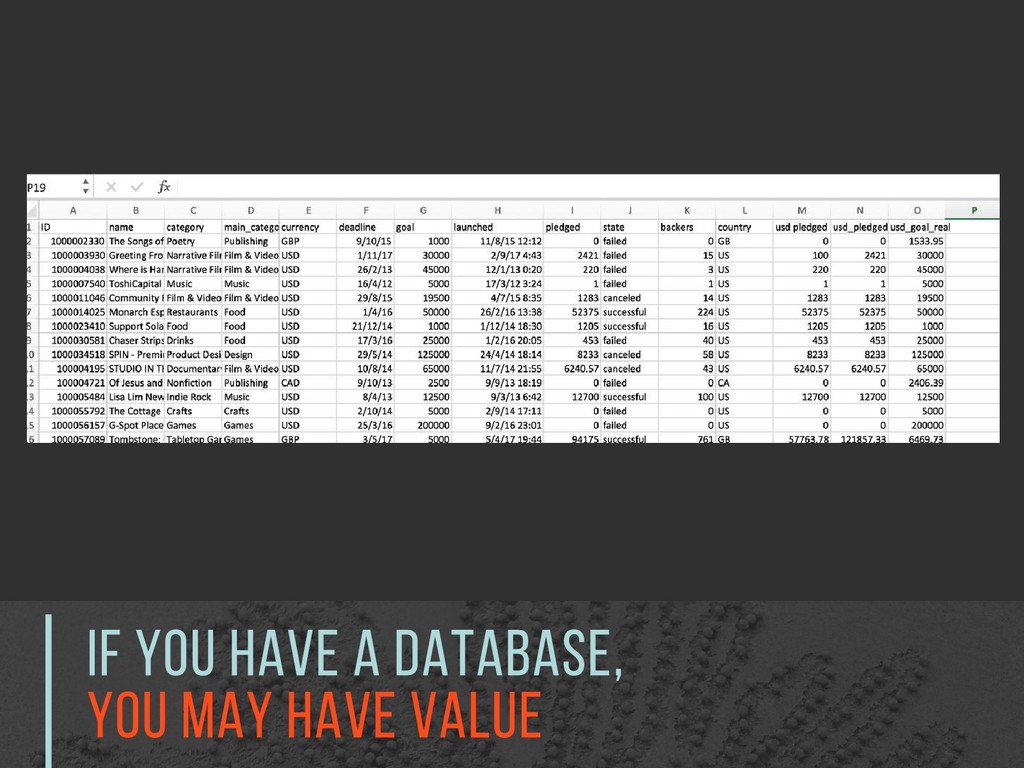
If you have a database, You may have value
Tip One Viz early, Viz often Find insights, communicate complexity
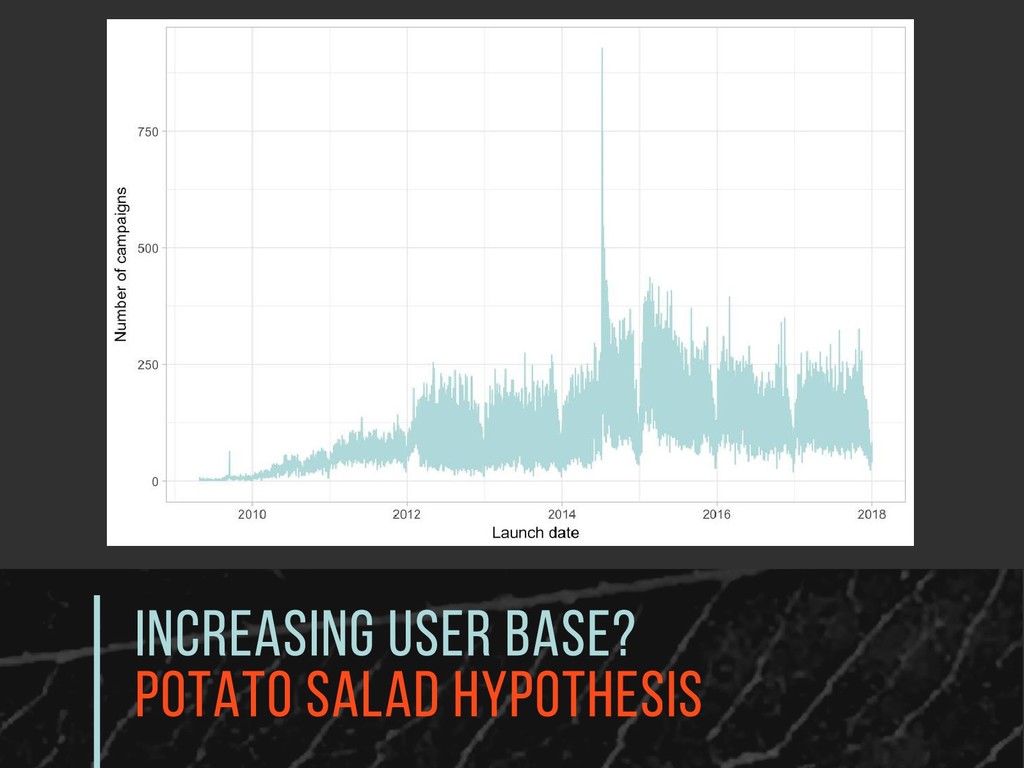
Increasing user base? potato salad hypothesis
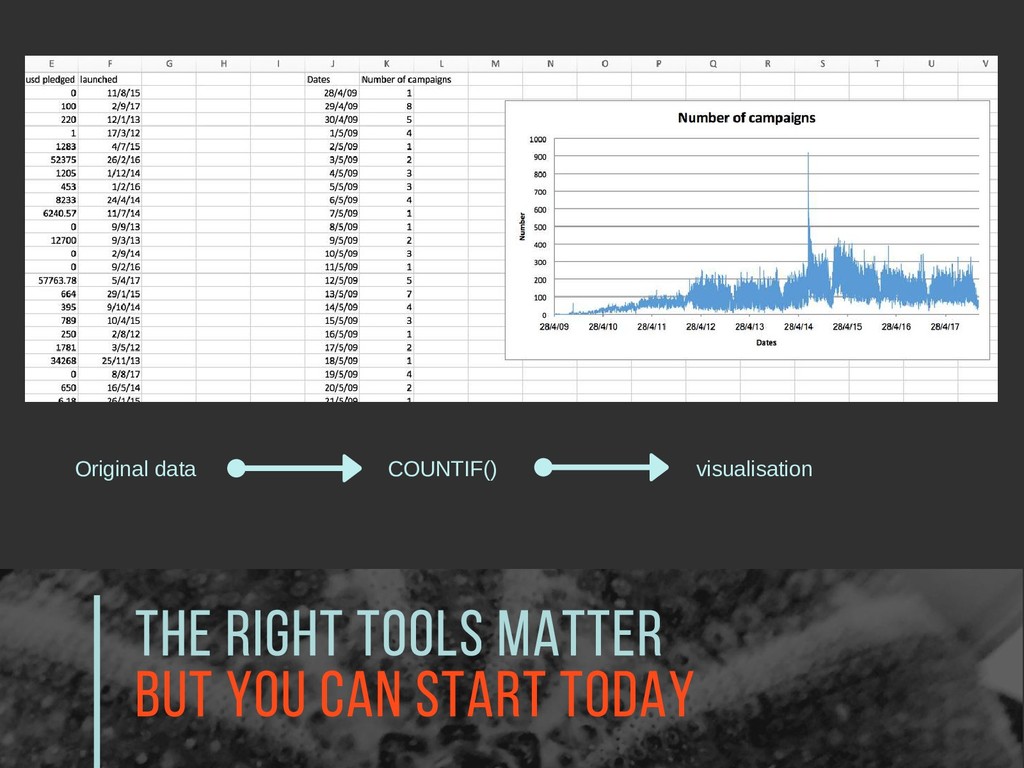
The right tools matter But you can start today Original
data COUNTIF() visualisation
Value can come from Aggregation The data you've got might
be obscuring insight in its current form Tip Two - thanks @nicoleradziwill
Australian Politics: Does who you are affect who you give
to? Auspol donations data from ABC Released 2017 for 2015/16 financial year
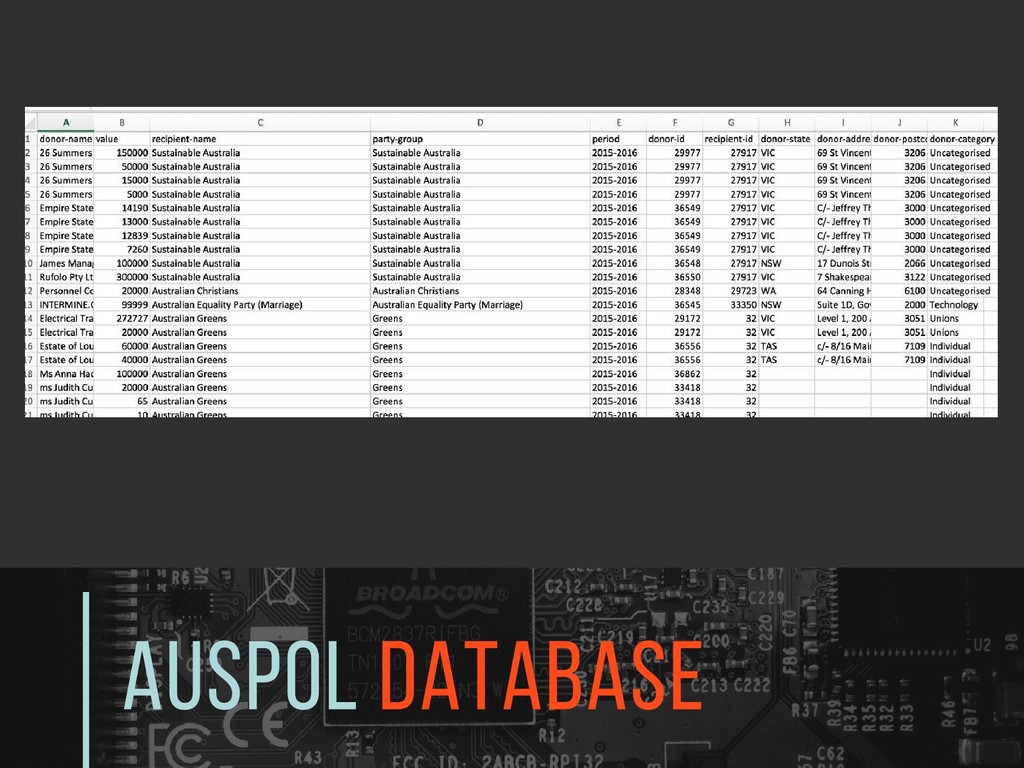
Auspol Database
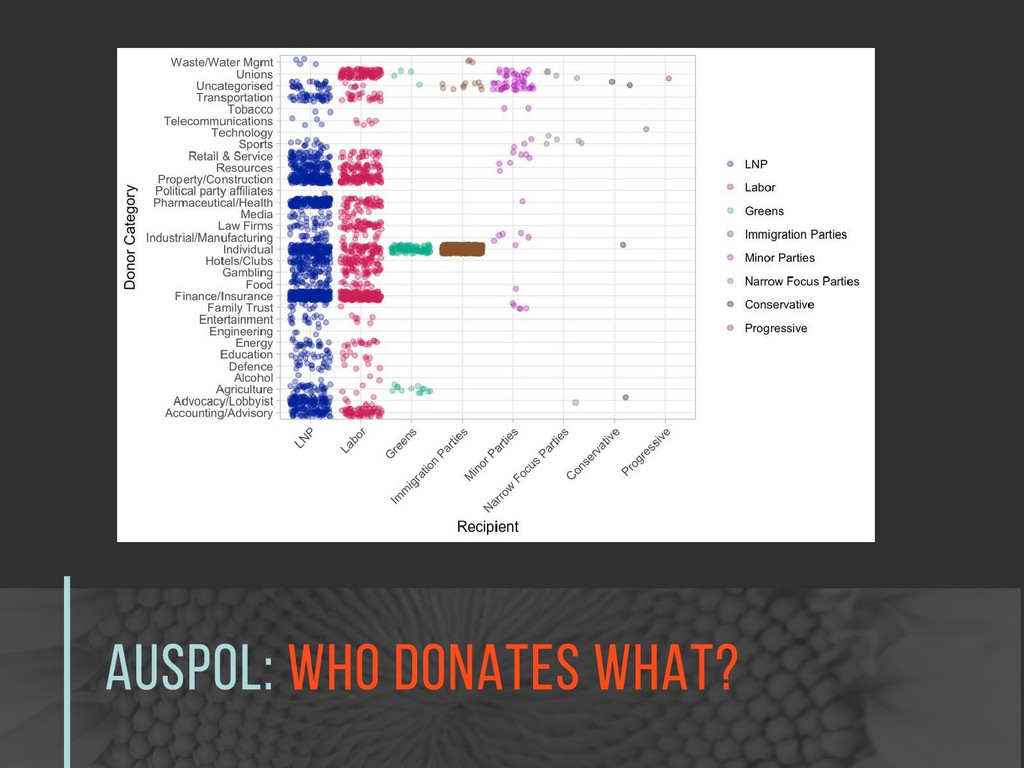
AUSPOL: Who Donates what?
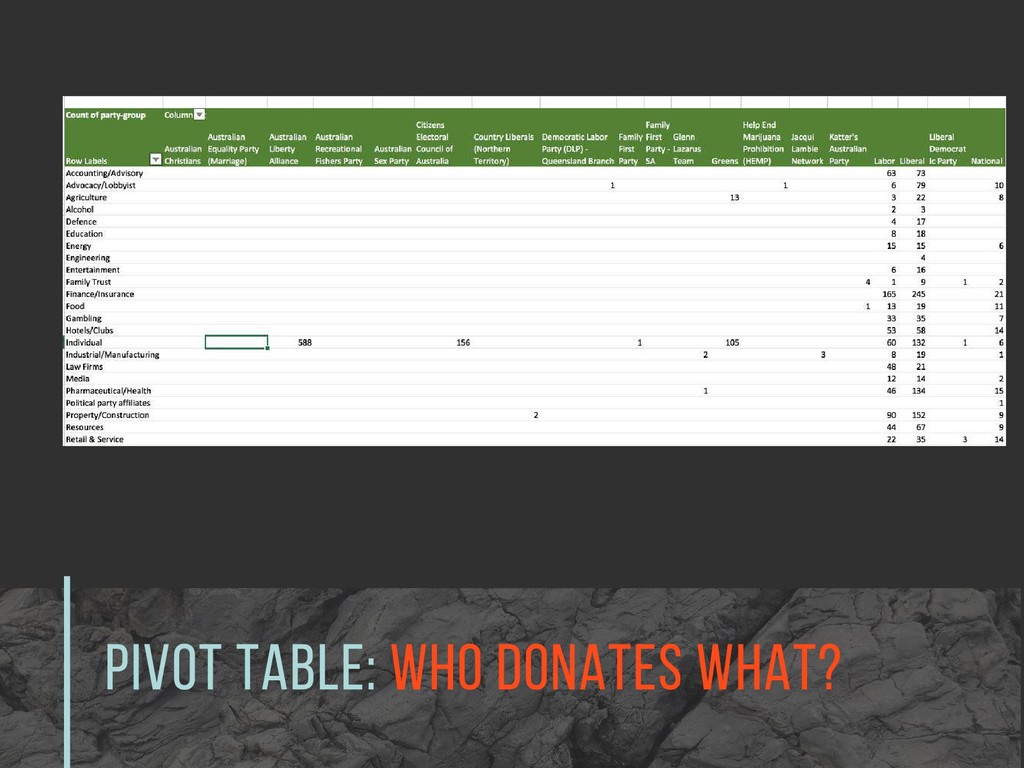
Pivot table: Who Donates what?
Ratesetter: finding value by connecting capital Started in Australia 2014
Connects borrowers, lenders
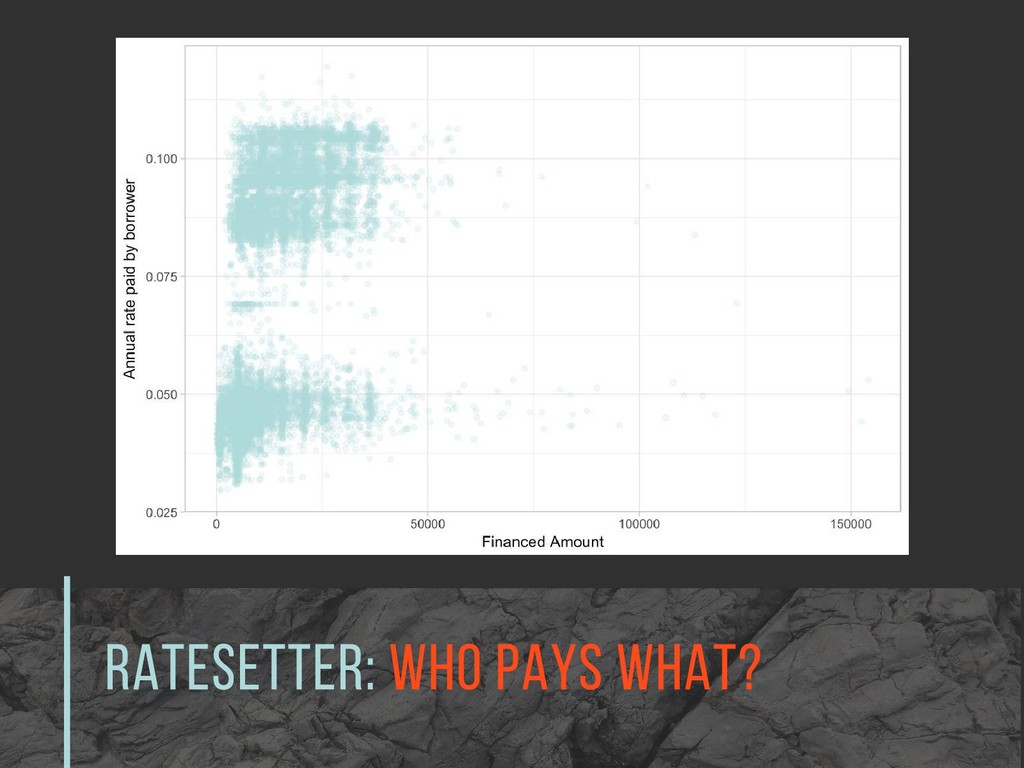
Ratesetter: Who pays what?
Domain knowledge Matters Tip Three Describe your data, describe your
world
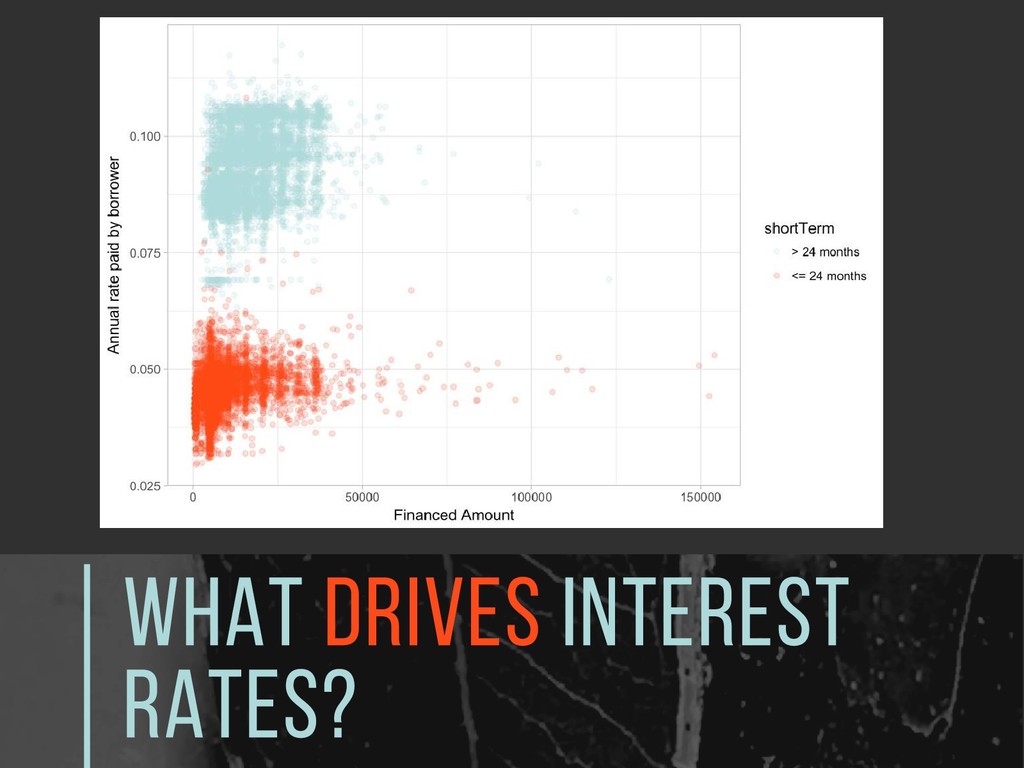
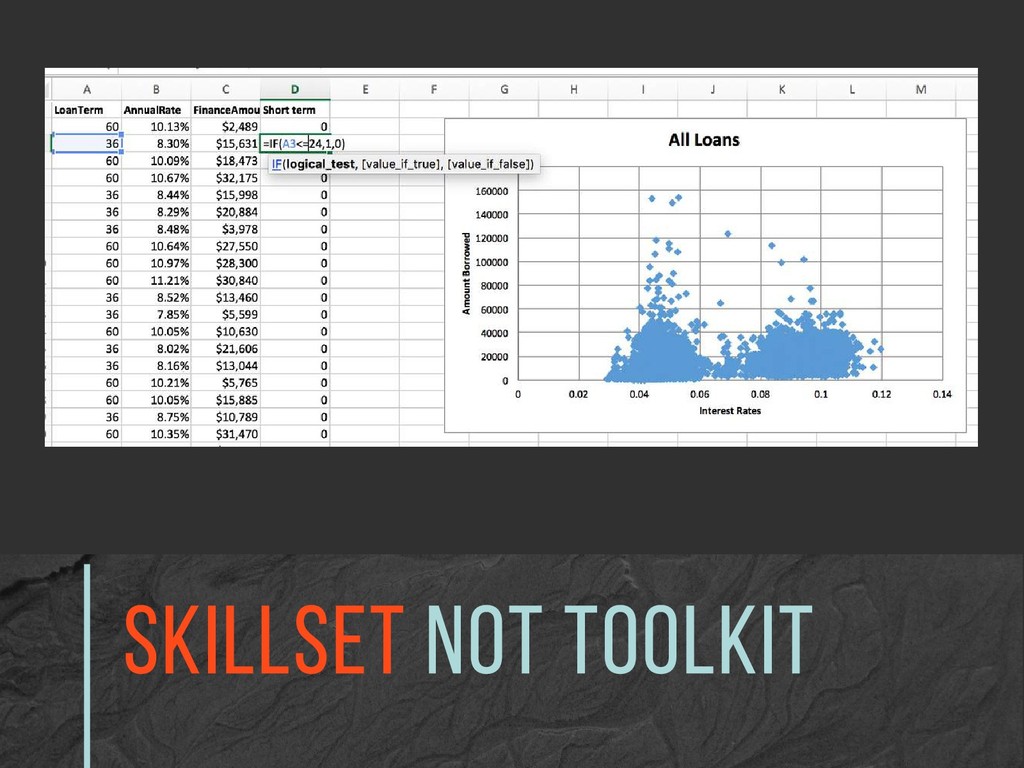
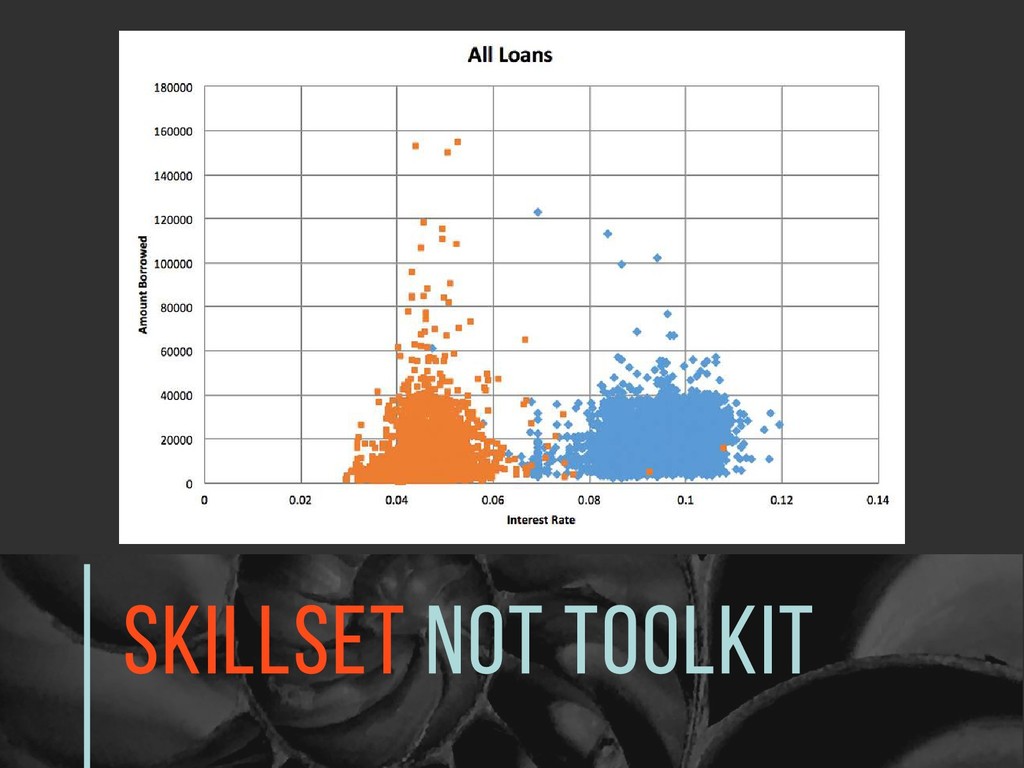
What drives interest rates?
SkillSet not Toolkit
SkillSet not Toolkit
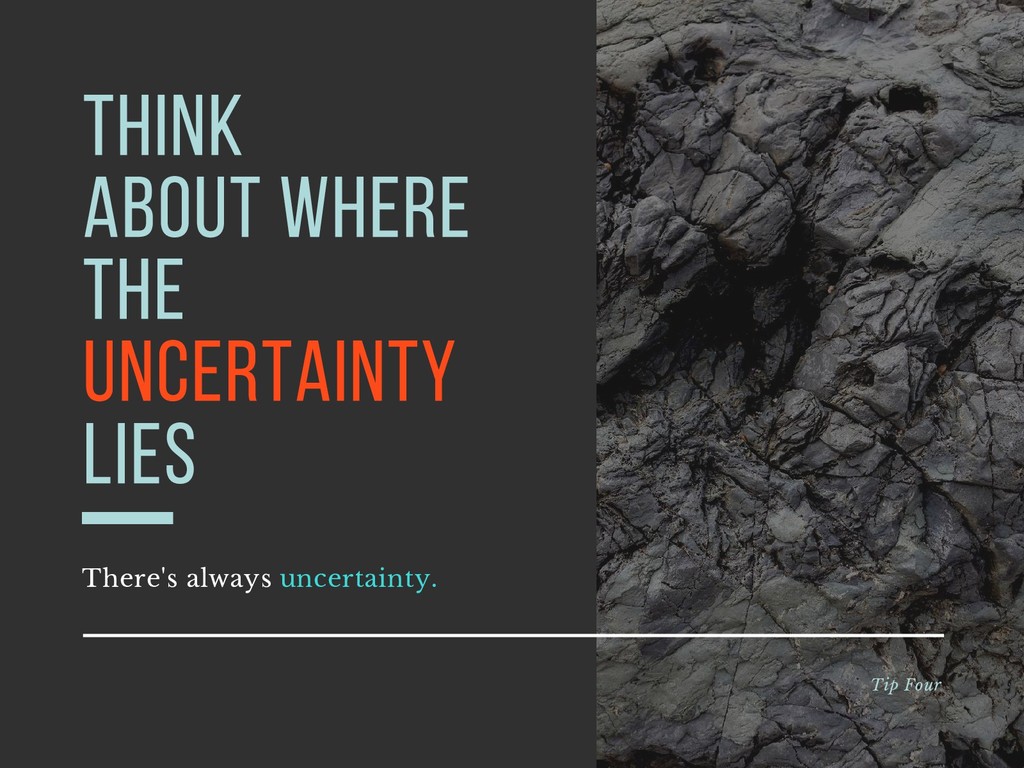
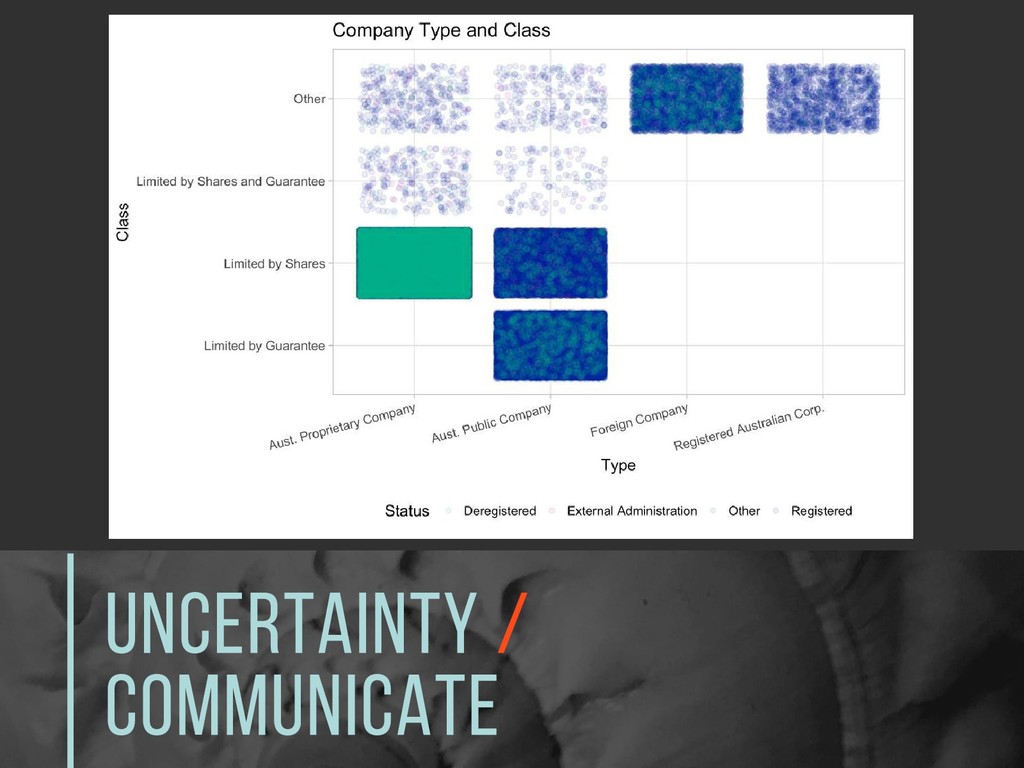
Tip Four Think about where the Uncertainty lies There's always
uncertainty.
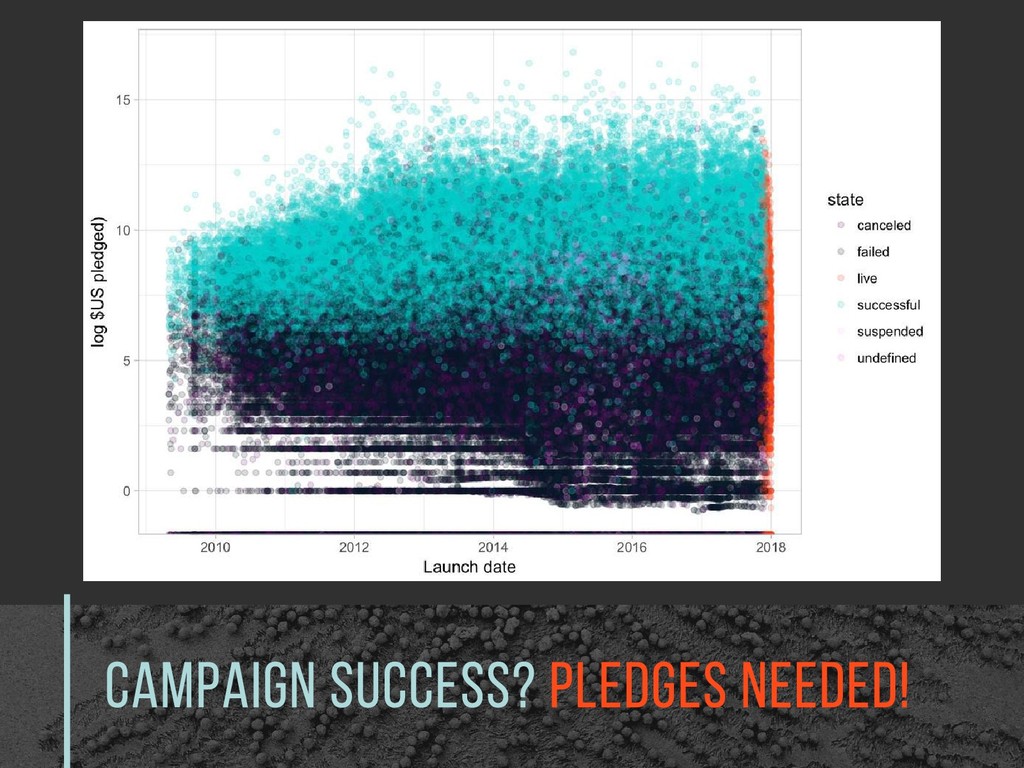
Campaign Success? Pledges needed!
Calculate to Communicate Tip Five Complexity is not a virtue.
Communication is key.
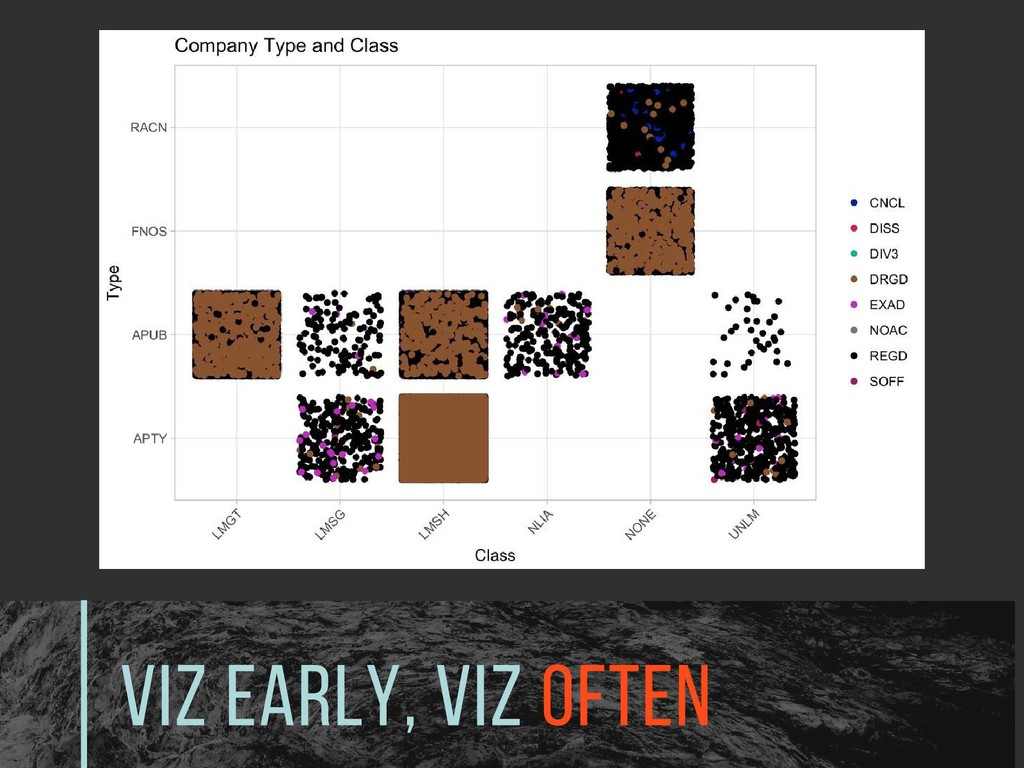
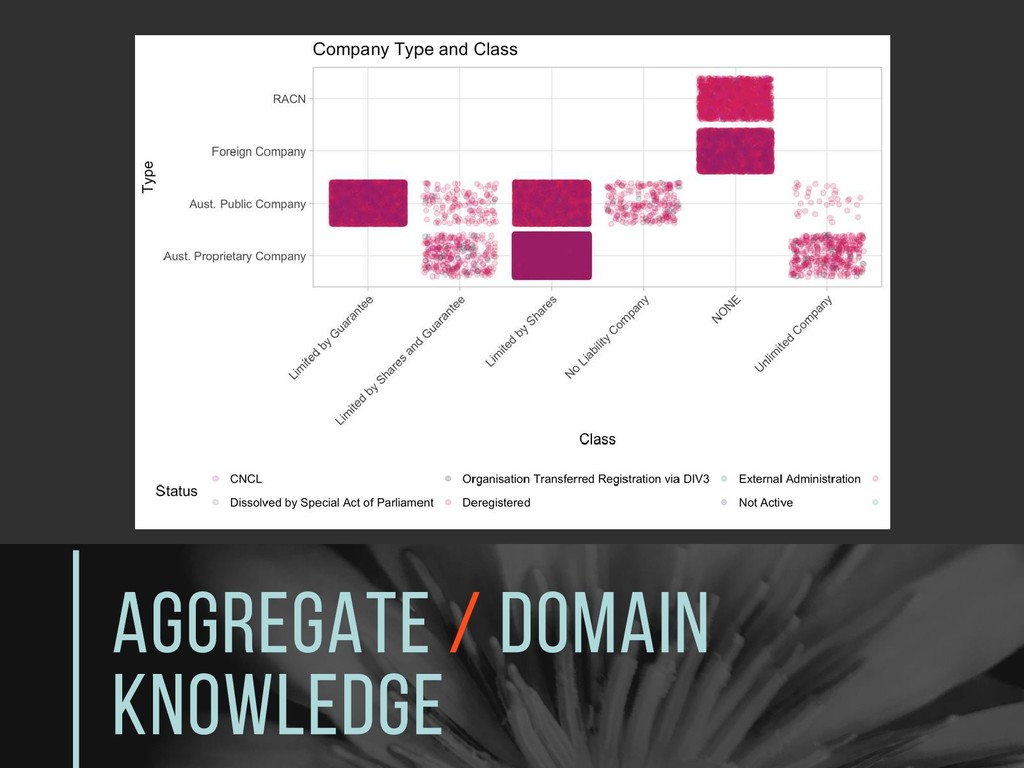
Putting it all Together ASIC company dataset. Company classes.
Viz Early, Viz Often
Aggregate / Domain Knowledge
Uncertainty / Communicate
Get behind the wheel There is no data license, just
data people. Drivers get you there, but the pit crew matters more.
Data Driven: Find Value, FIND INSIGHTS
[email protected]
www.stephdesilva.com @StephdeSilva Thanks
to #datascience Twitter for some great suggestions + ideas
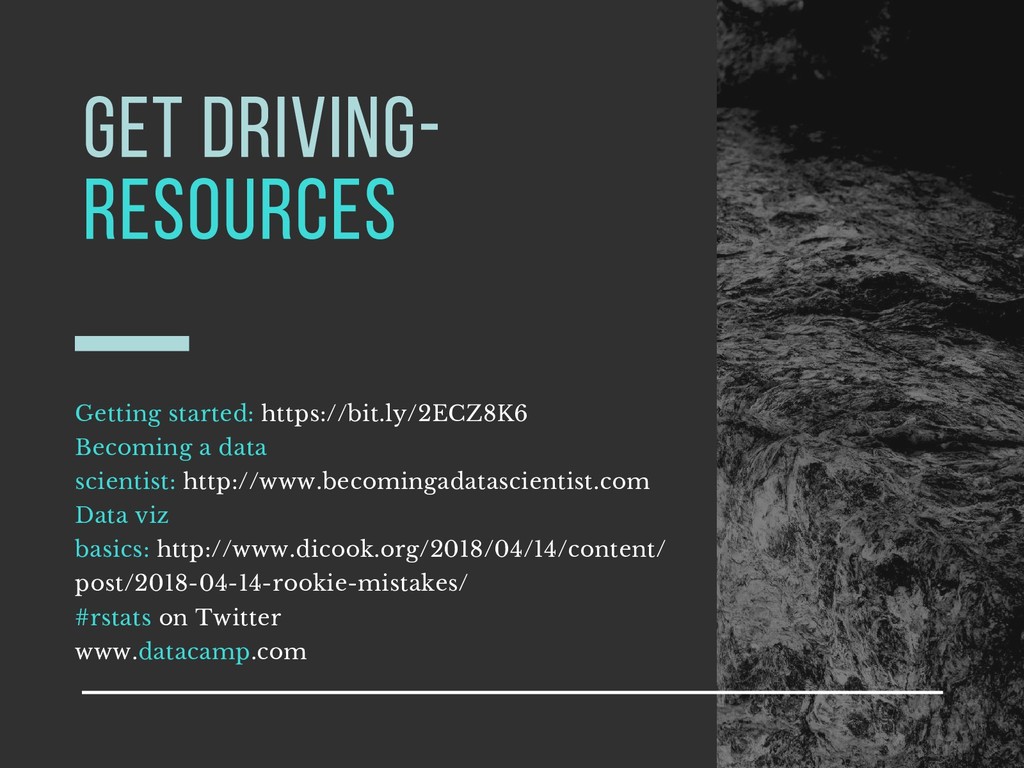
Get driving- Resources Getting started: https://bit.ly/2ECZ8K6 Becoming a data scientist:
http://www.becomingadatascientist.com Data viz basics: http://www.dicook.org/2018/04/14/content/ post/2018-04-14-rookie-mistakes/ #rstats on Twitter www.datacamp.com
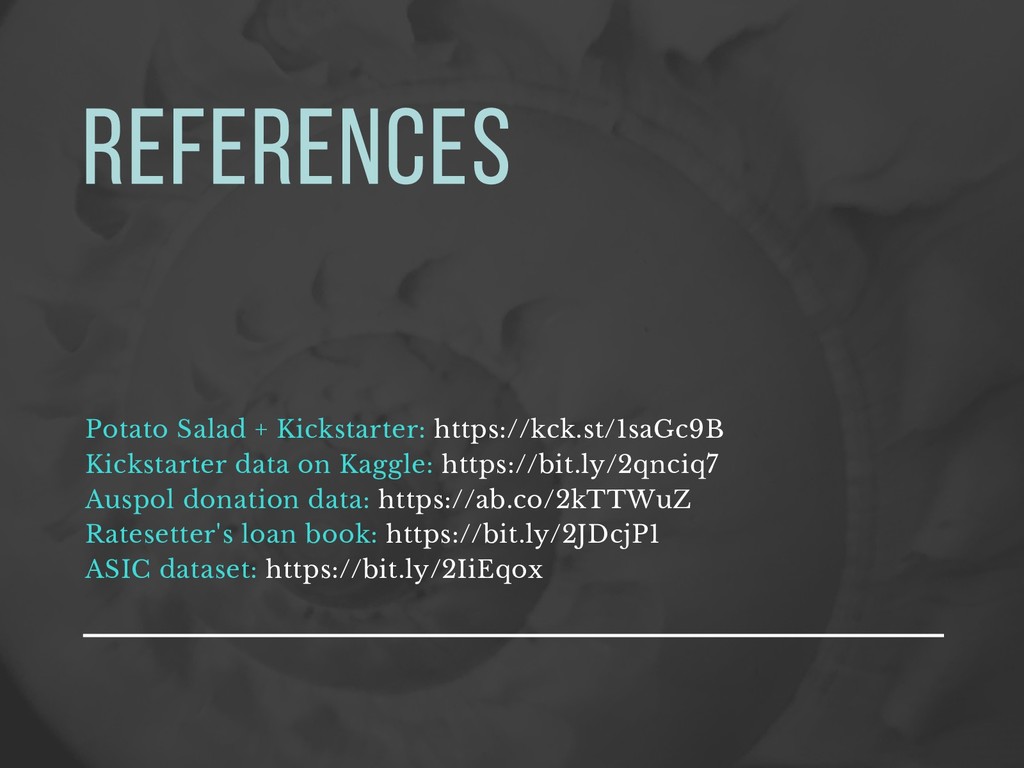
References Potato Salad + Kickstarter: https://kck.st/1saGc9B Kickstarter data on Kaggle:
https://bit.ly/2qnciq7 Auspol donation data: https://ab.co/2kTTWuZ Ratesetter's loan book: https://bit.ly/2JDcjP1 ASIC dataset: https://bit.ly/2IiEqox
![Data Driven: Find Value, FIND INSIGHTS [email protected] www.stephdesilva.com @StephdeSilva Thanks](https://files.speakerdeck.com/presentations/8aea368576524f928369f7e7cc016abd/slide_26.jpg)