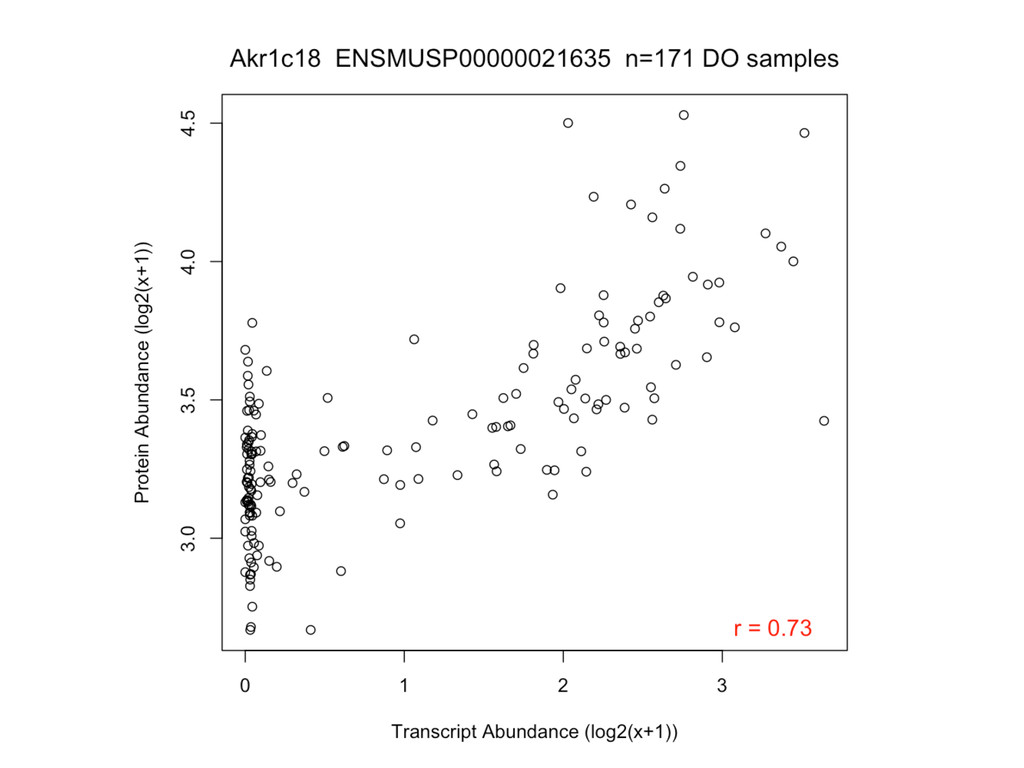
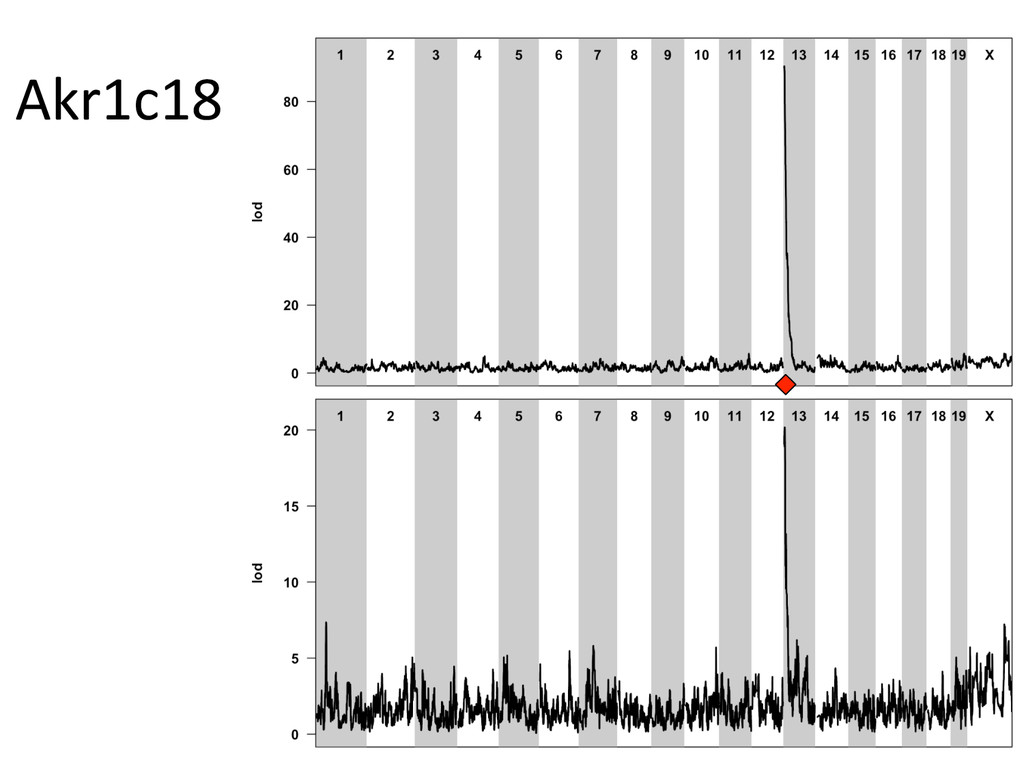
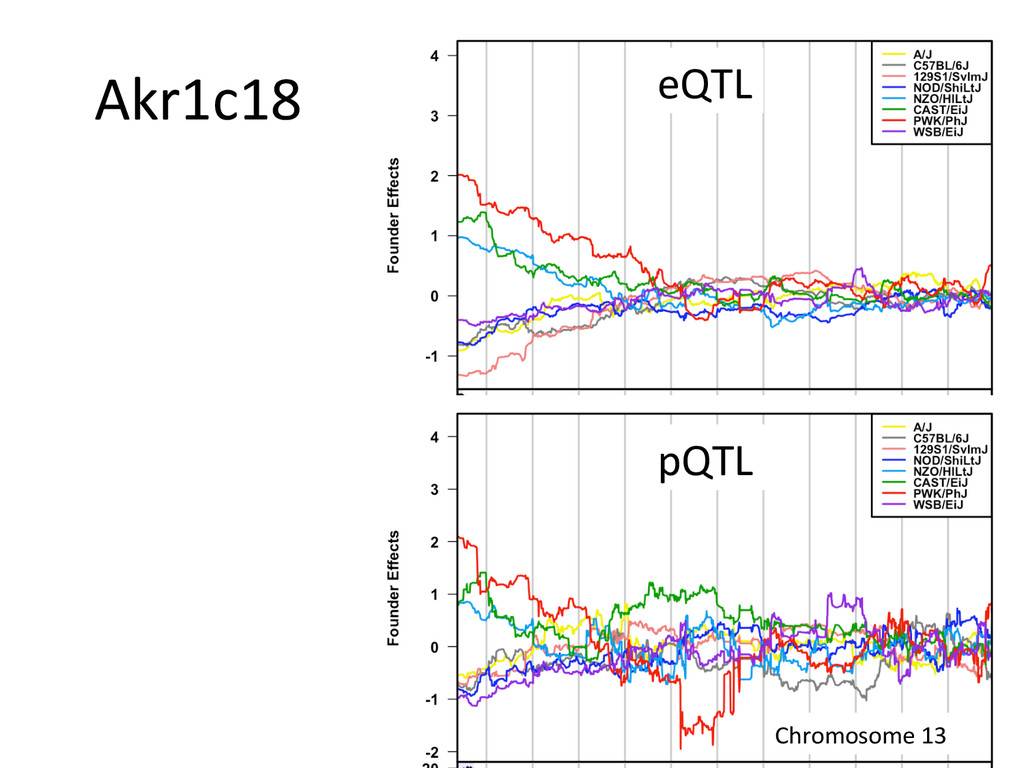
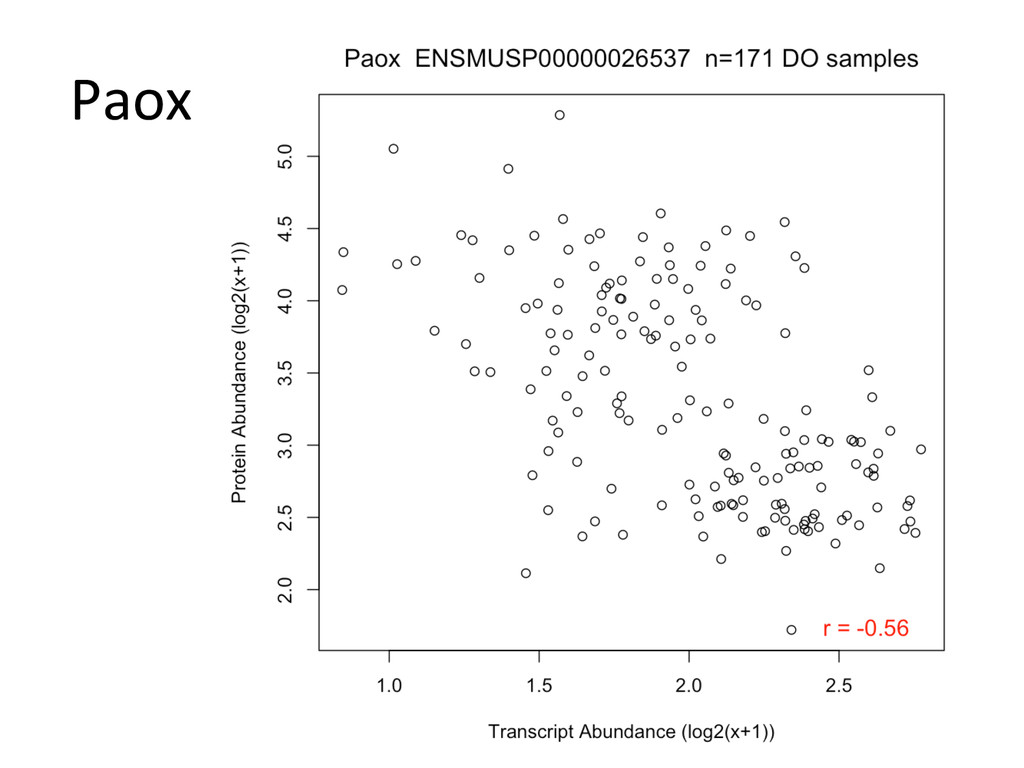
Genetic control of liver transcript and protein abundance
I presented this talk at the 2014 International Mammalian Genome Conference. I describe our work mapping transcript and protein abundance QTL in the Diversity Outbred mouse population.
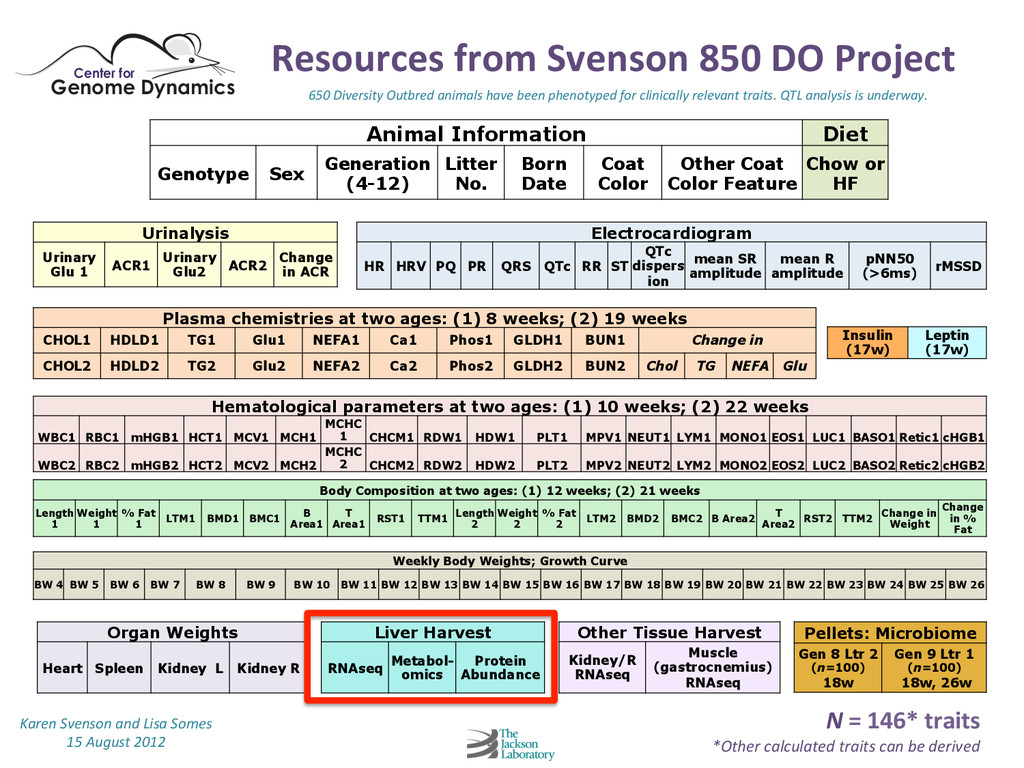
liver. Steve Munger @stevemunger #IMGC14 Gary Churchill Group The Jackson Laboratory Bar Harbor, Maine USA Interna$onal Mammalian Genome Conference October 29, 2014
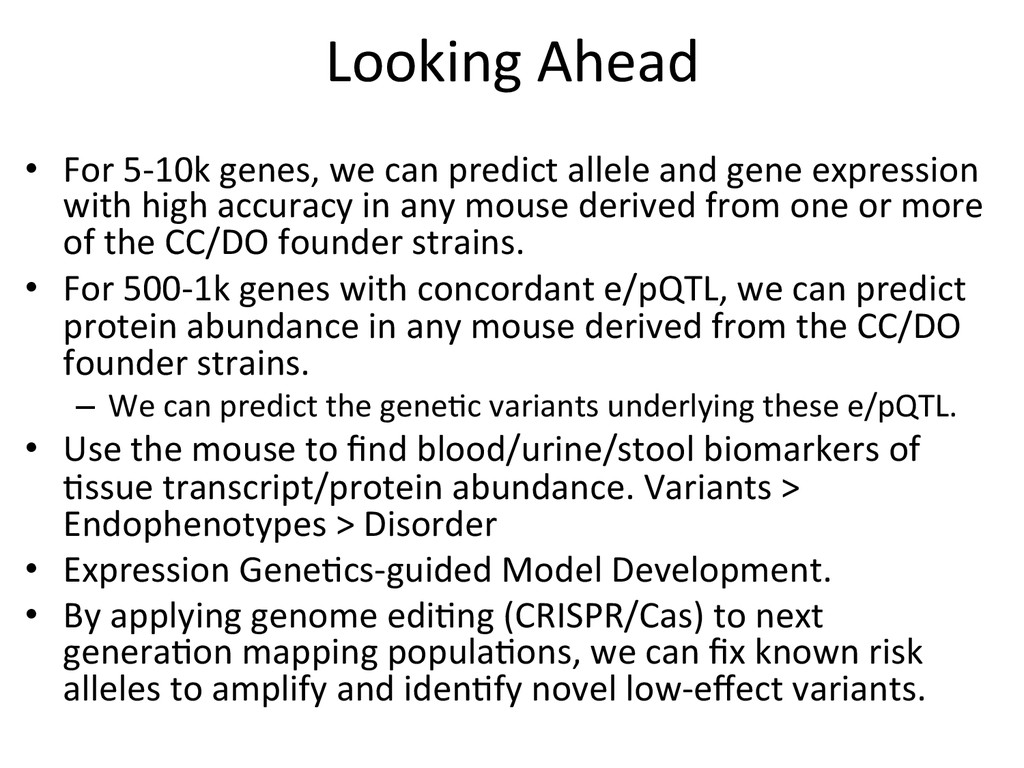
allele and gene expression with high accuracy in any mouse derived from one or more of the CC/DO founder strains. • For 500-‐1k genes with concordant e/pQTL, we can predict protein abundance in any mouse derived from the CC/DO founder strains. – We can predict the gene$c variants underlying these e/pQTL. • Use the mouse to find blood/urine/stool biomarkers of $ssue transcript/protein abundance. Variants > Endophenotypes > Disorder • Expression Gene$cs-‐guided Model Development. • By applying genome edi$ng (CRISPR/Cas) to next genera$on mapping popula$ons, we can fix known risk alleles to amplify and iden$fy novel low-‐effect variants.