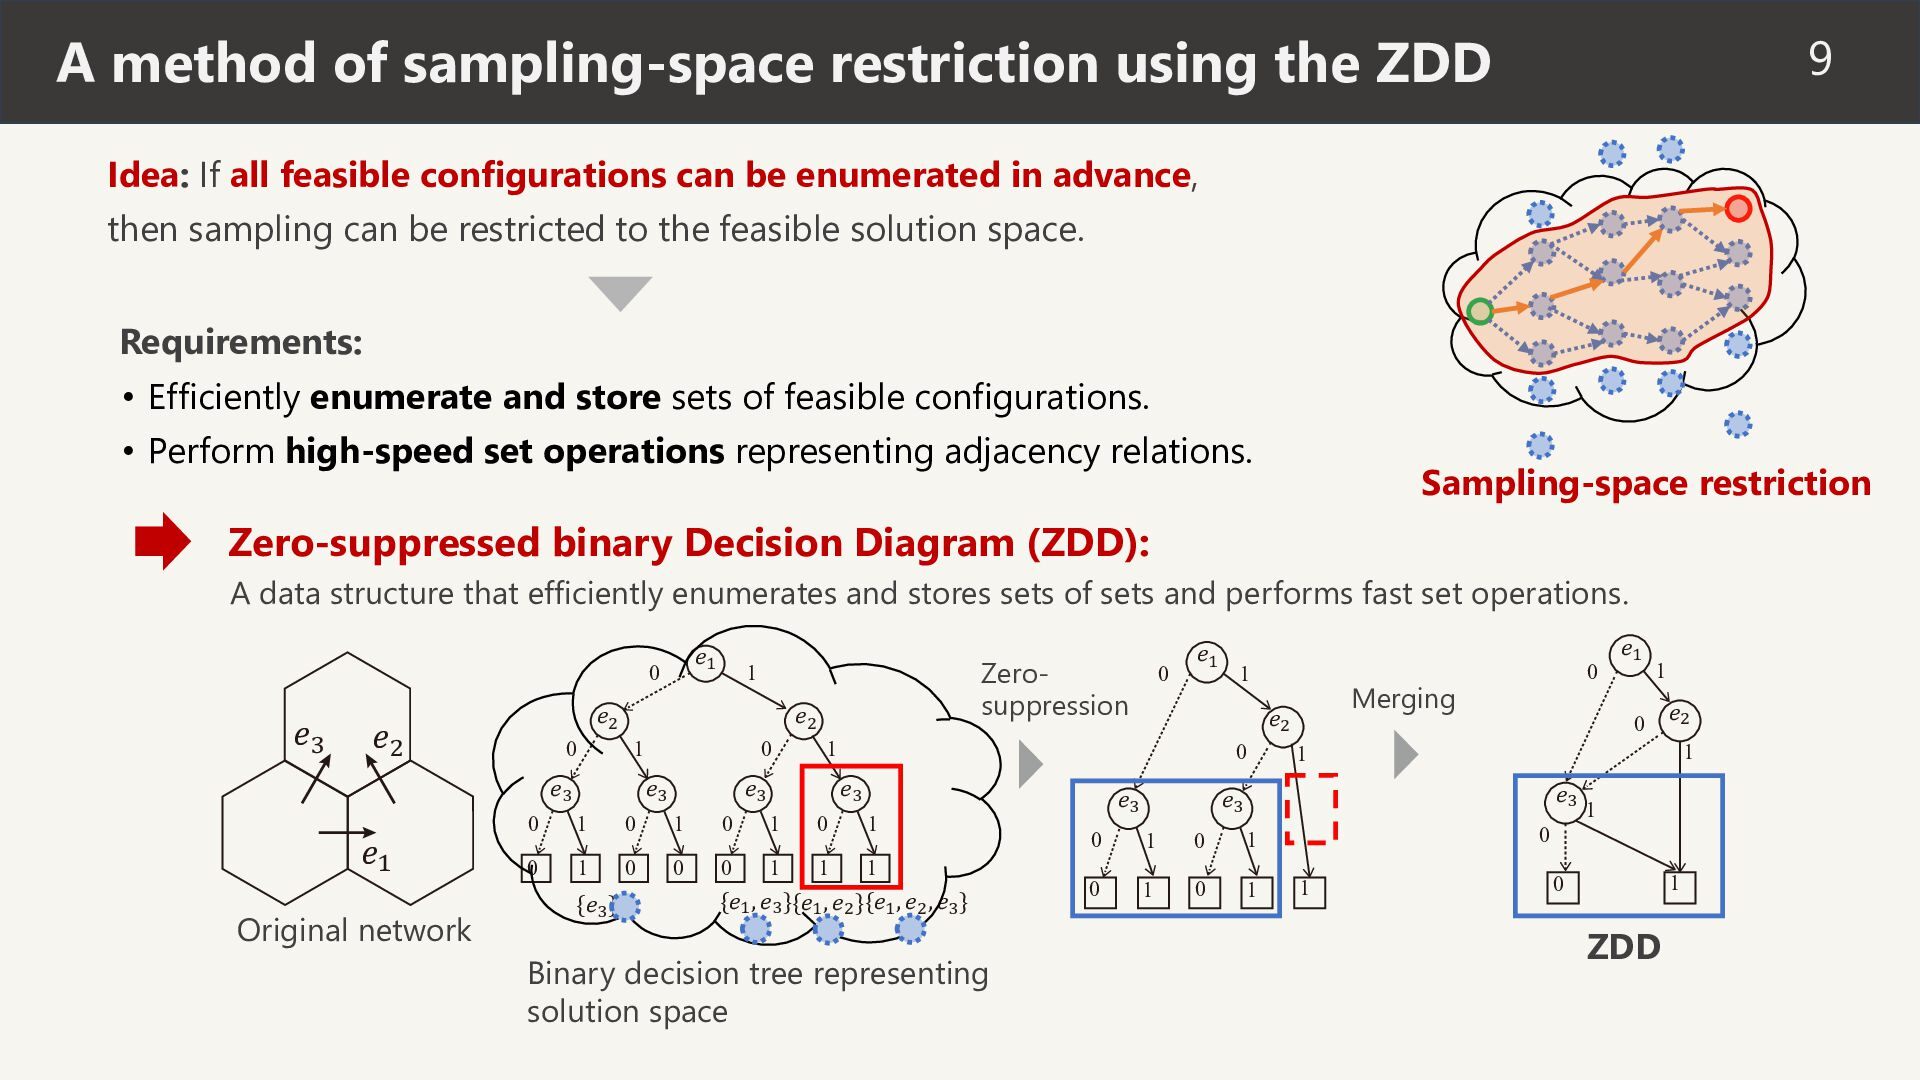
Slides for the paper "Combinatorial reconfiguration for perimeter contraflow planning of urban evacuation network" in Transportation Research Part C: Emerging Technologies, 192, 105875 (2026)
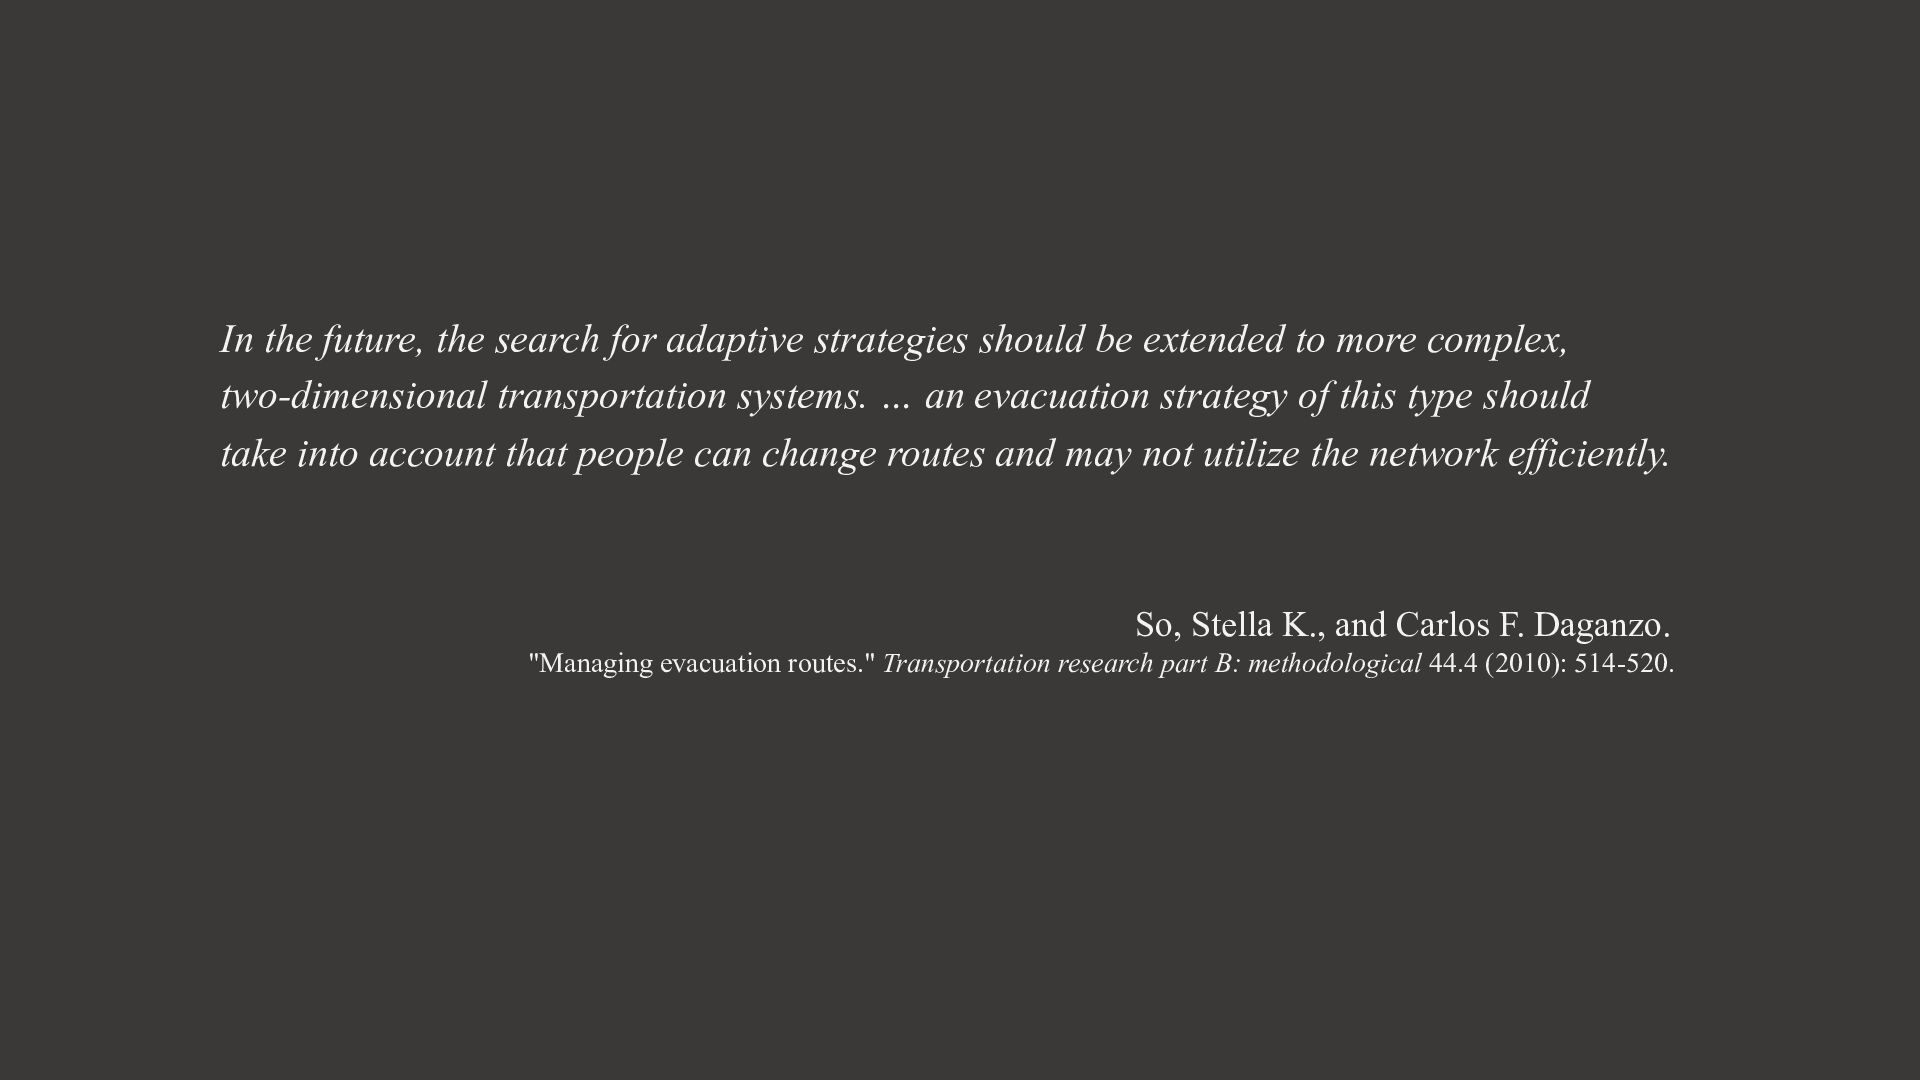
extended to more complex, two-dimensional transportation systems. … an evacuation strategy of this type should take into account that people can change routes and may not utilize the network efficiently. So, Stella K., and Carlos F. Daganzo. "Managing evacuation routes." Transportation research part B: methodological 44.4 (2010): 514-520.
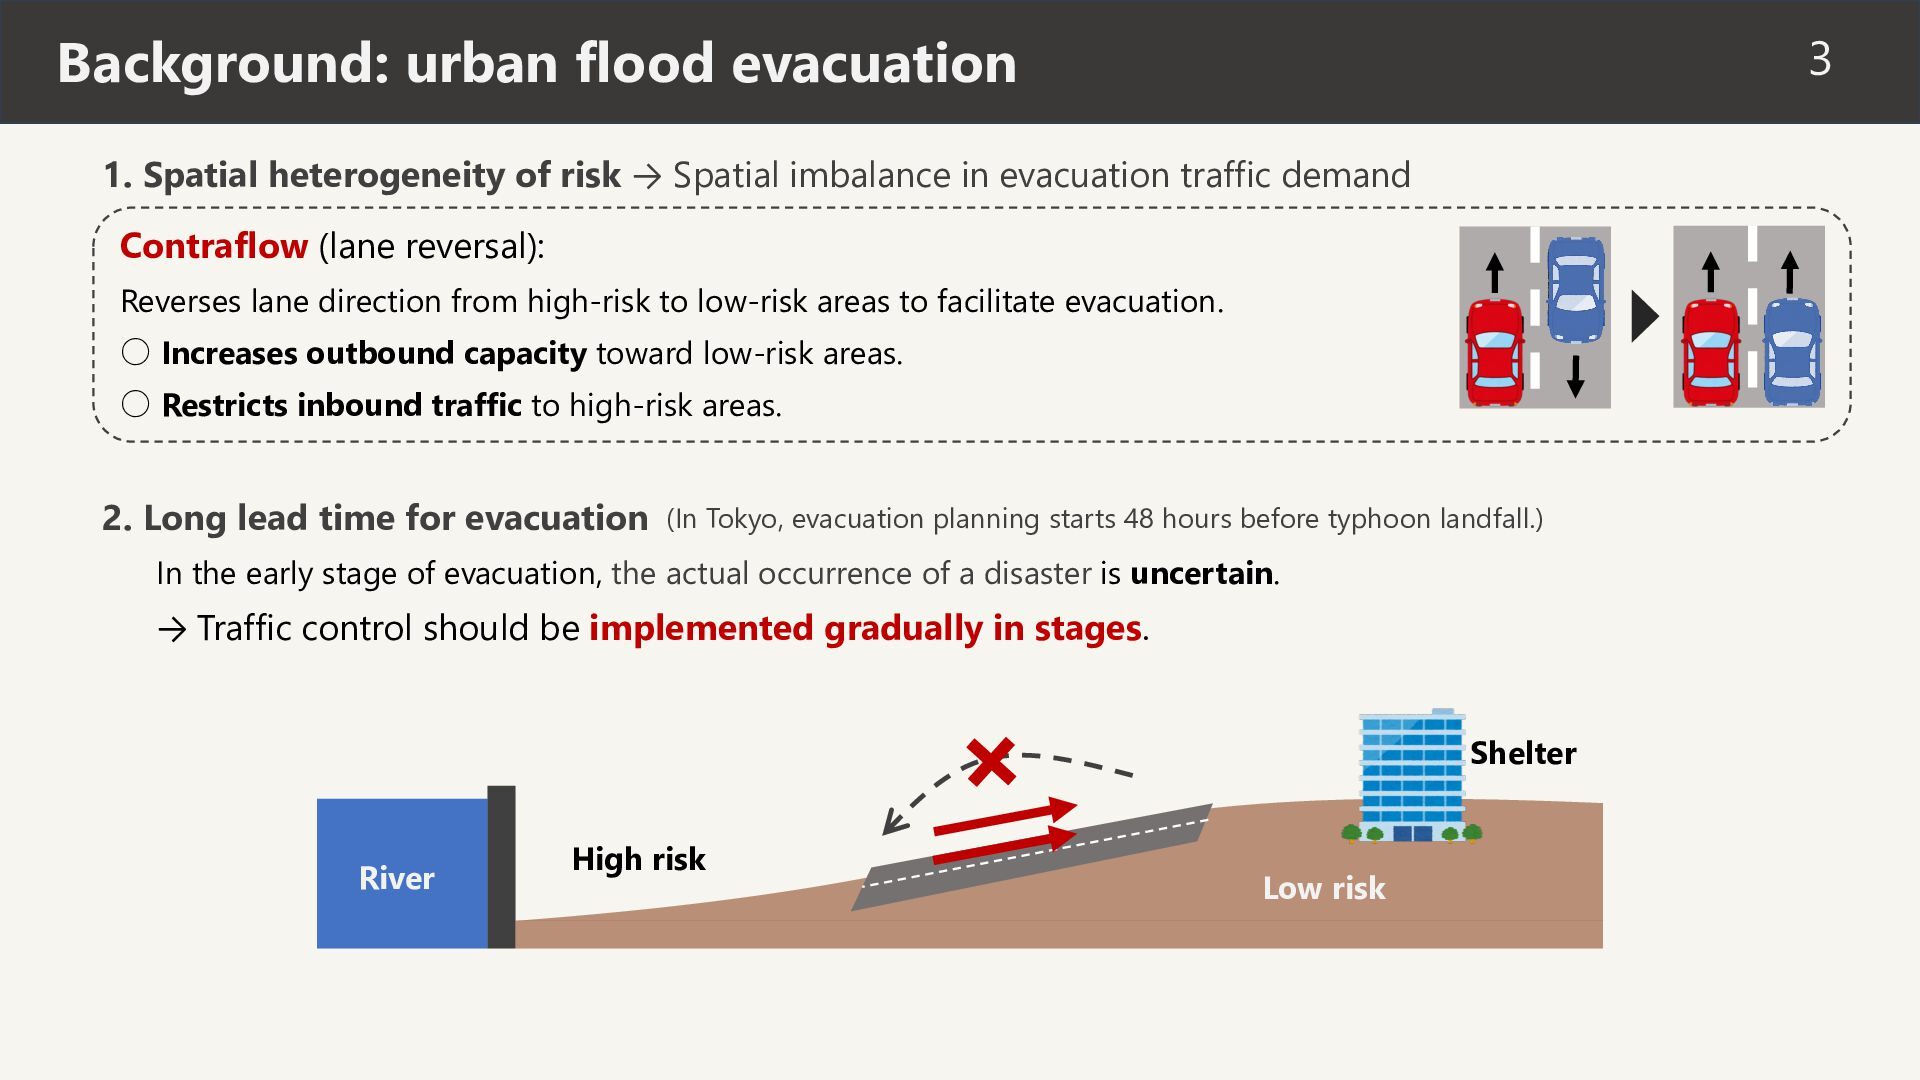
→ Spatial imbalance in evacuation traffic demand Contraflow (lane reversal): Reverses lane direction from high-risk to low-risk areas to facilitate evacuation. ◦ Increases outbound capacity toward low-risk areas. ◦ Restricts inbound traffic to high-risk areas. 2. Long lead time for evacuation (In Tokyo, evacuation planning starts 48 hours before typhoon landfall.) In the early stage of evacuation, the actual occurrence of a disaster is uncertain. → Traffic control should be implemented gradually in stages. Shelter River High risk Low risk
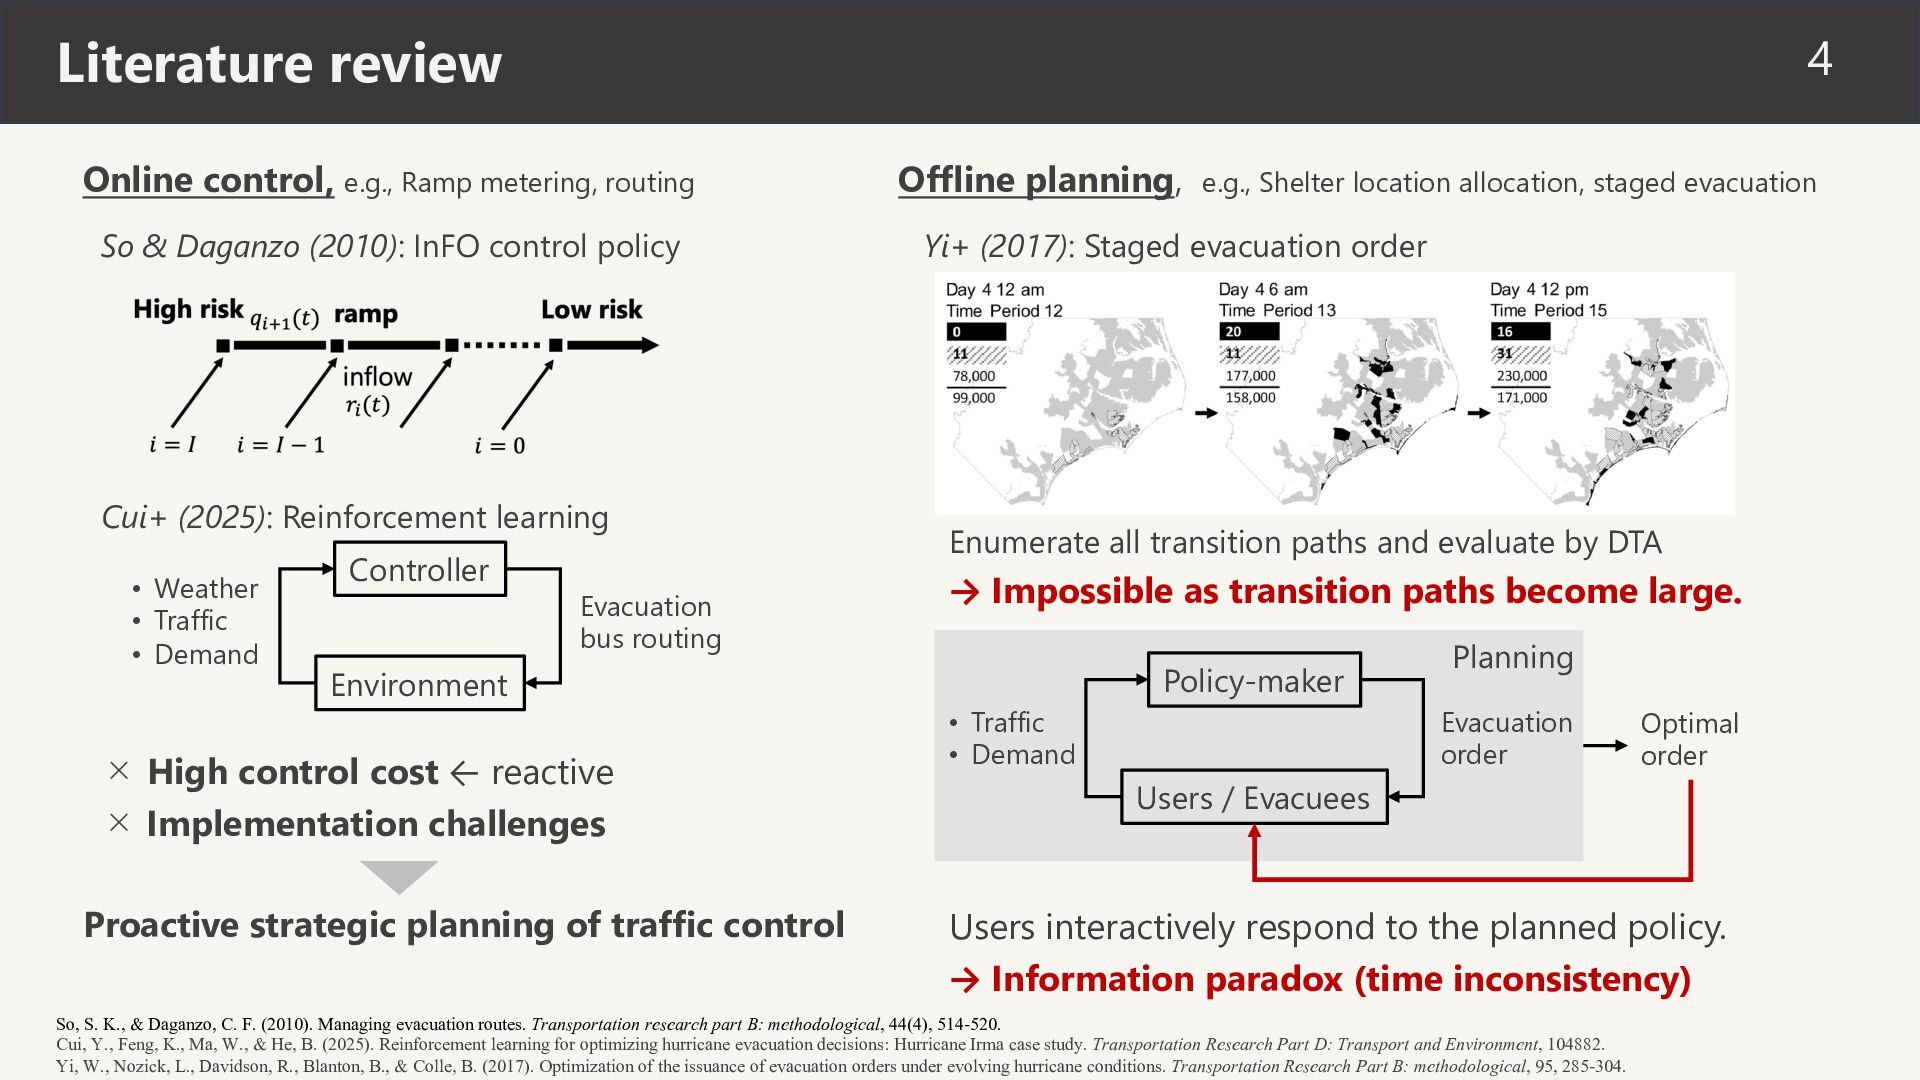
& Daganzo (2010): InFO control policy Cui+ (2025): Reinforcement learning • Weather • Traffic • Demand Controller Evacuation bus routing Environment × High control cost ← reactive × Implementation challenges Proactive strategic planning of traffic control Offline planning, e.g., Shelter location allocation, staged evacuation Yi+ (2017): Staged evacuation order Enumerate all transition paths and evaluate by DTA → Impossible as transition paths become large. Policy-maker • Traffic • Demand Planning Evacuation order Optimal order Users / Evacuees Users interactively respond to the planned policy. → Information paradox (time inconsistency) So, S. K., & Daganzo, C. F. (2010). Managing evacuation routes. Transportation research part B: methodological, 44(4), 514-520. Cui, Y., Feng, K., Ma, W., & He, B. (2025). Reinforcement learning for optimizing hurricane evacuation decisions: Hurricane Irma case study. Transportation Research Part D: Transport and Environment, 104882. Yi, W., Nozick, L., Davidson, R., Blanton, B., & Colle, B. (2017). Optimization of the issuance of evacuation orders under evolving hurricane conditions. Transportation Research Part B: methodological, 95, 285-304.
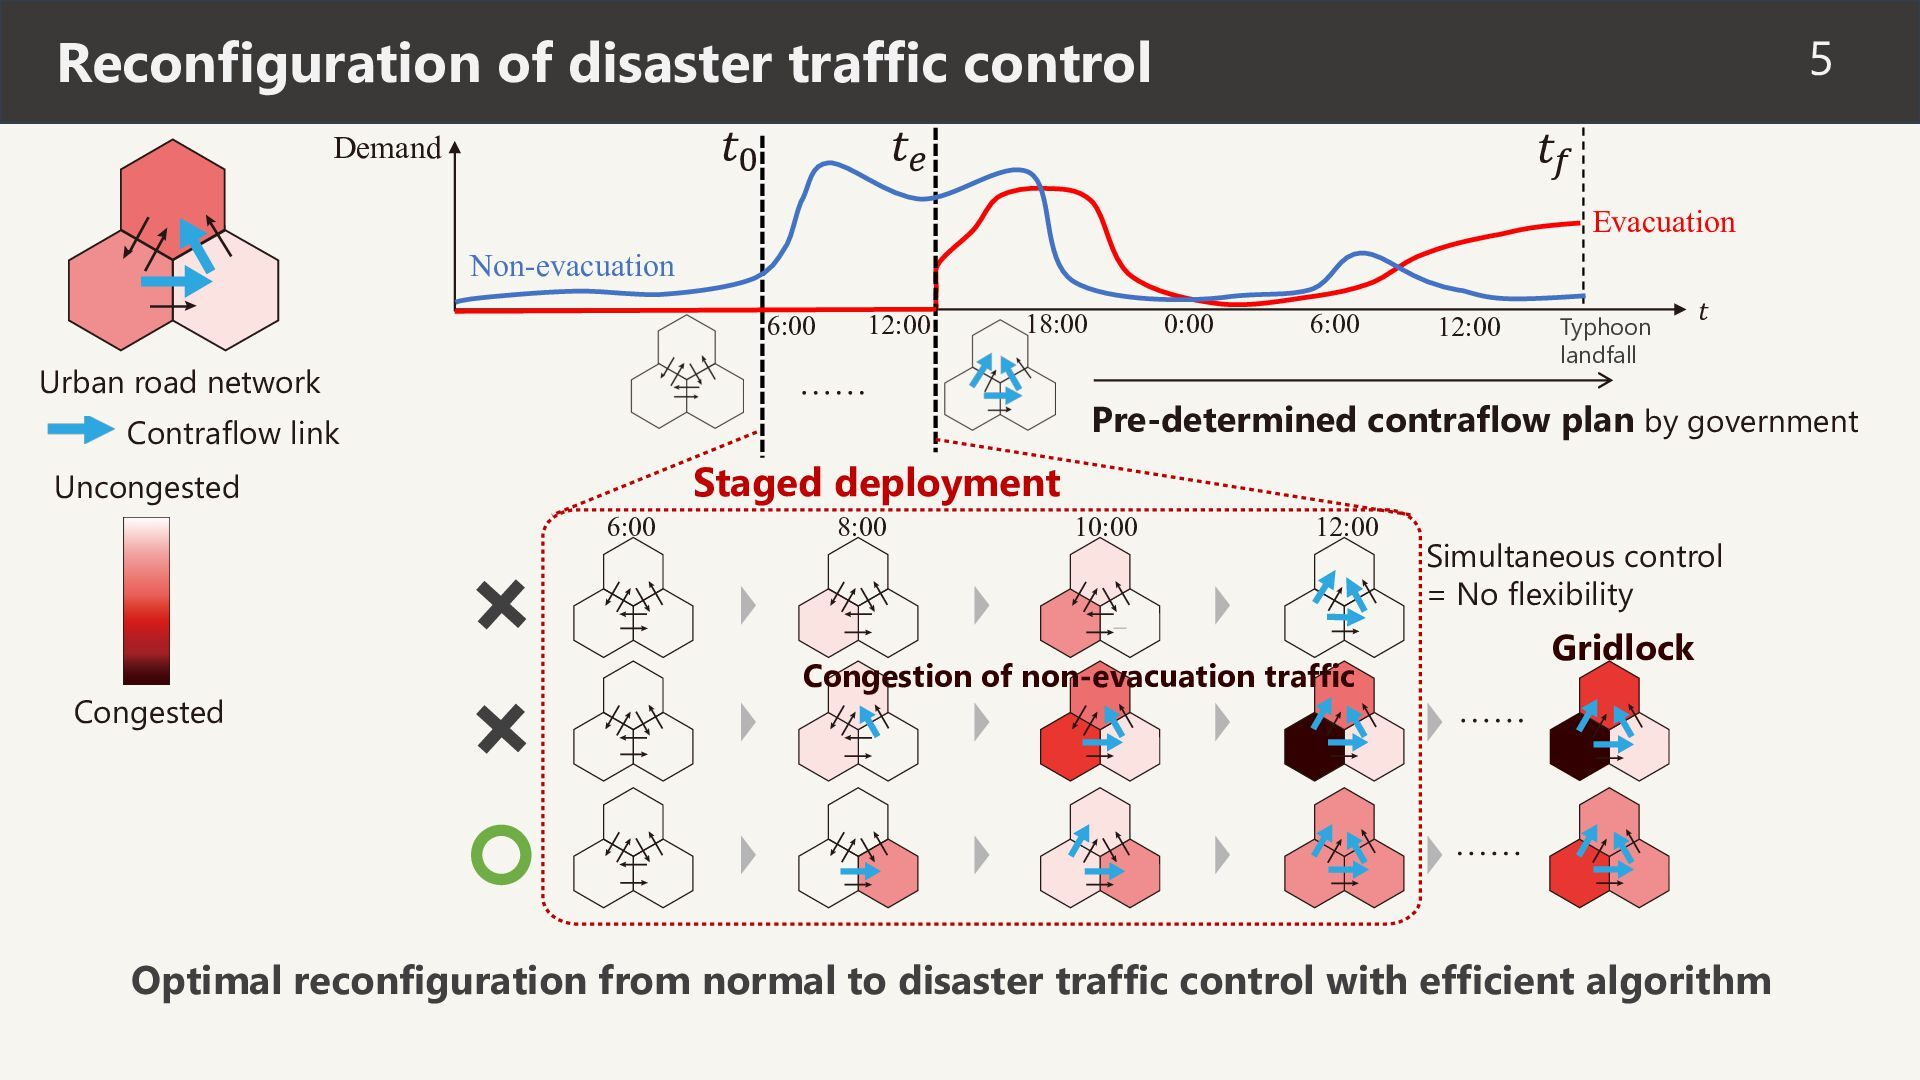
Evacuation Non-evacuation 6:00 12:00 18:00 Urban road network 6:00 12:00 Typhoon landfall 𝑡 Pre-determined contraflow plan by government Contraflow link Staged deployment Uncongested 6:00 Congested 0:00 8:00 10:00 12:00 Congestion of non-evacuation traffic Simultaneous control = No flexibility Gridlock Optimal reconfiguration from normal to disaster traffic control with efficient algorithm
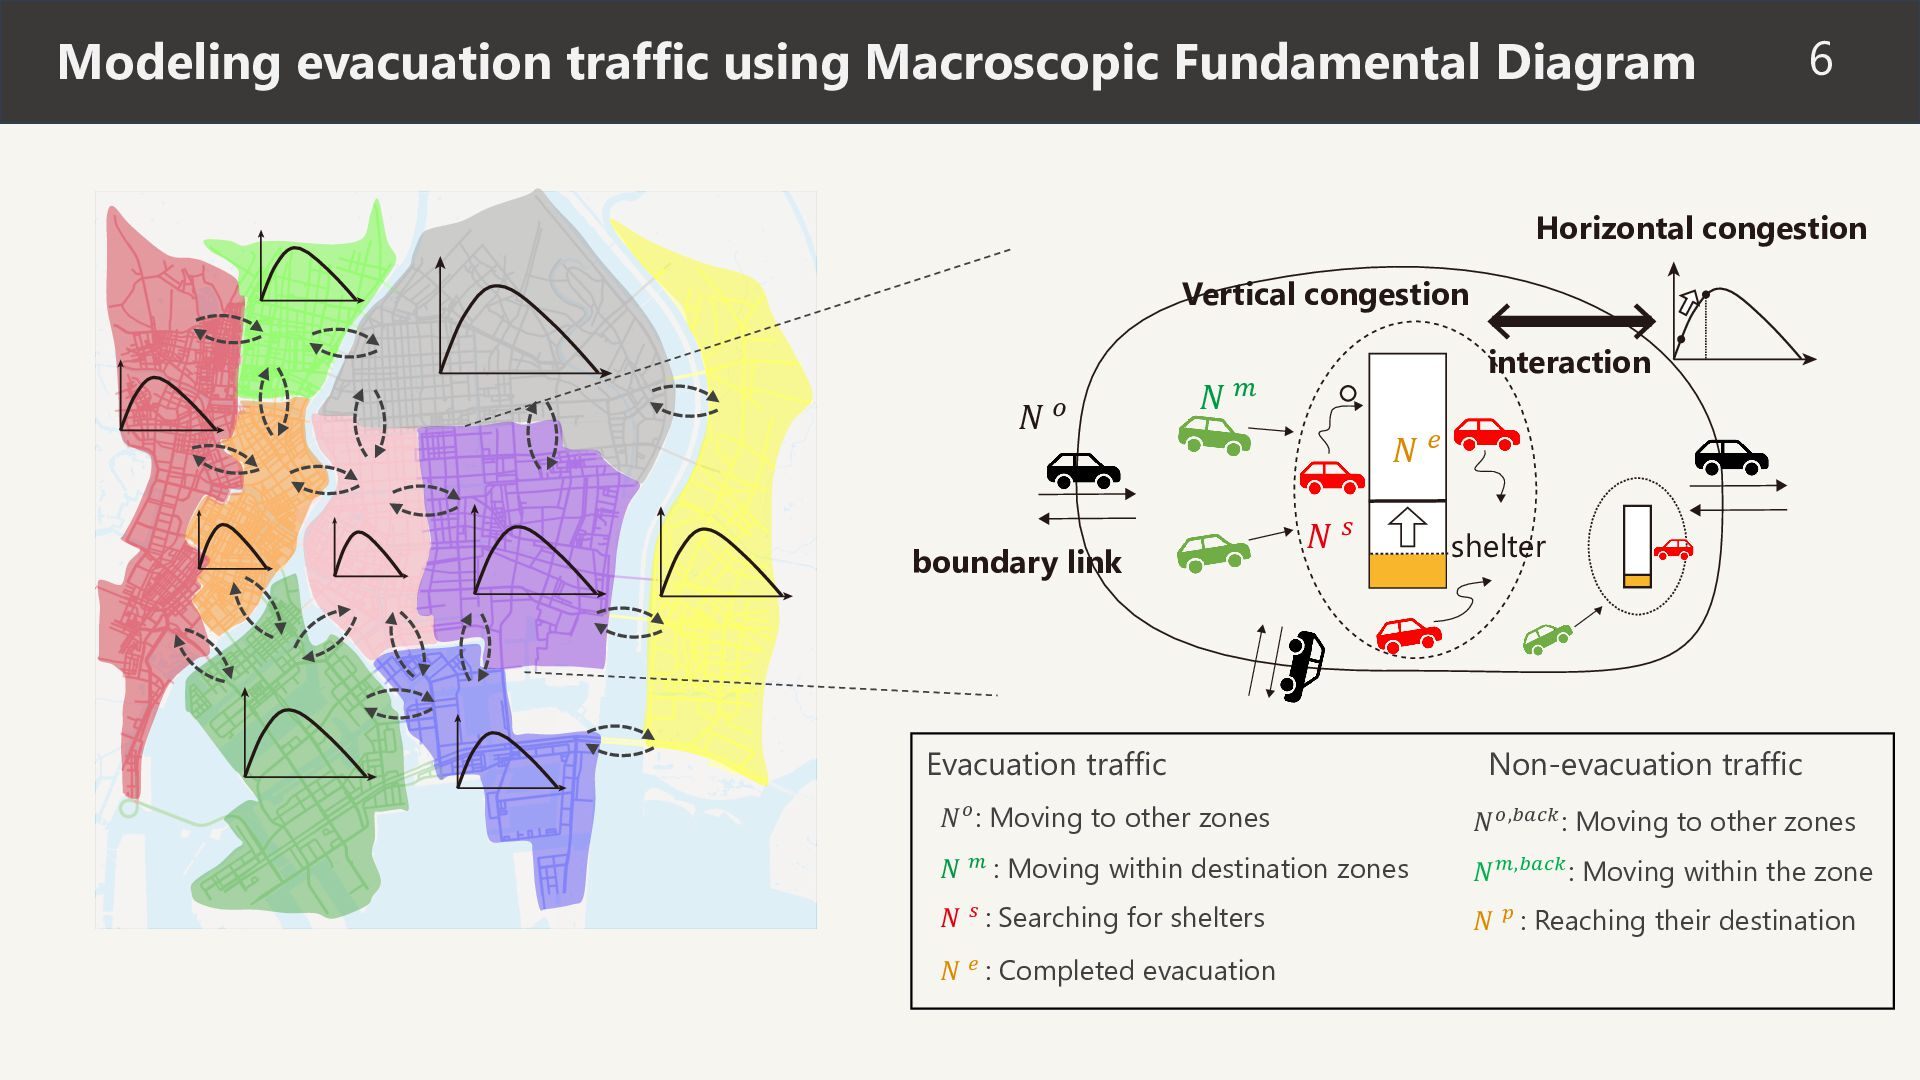
Vertical congestion 𝑁! 𝑁 interaction " boundary link 𝑁$ 𝑁# shelter Evacuation traffic Non-evacuation traffic 𝑁 ! : Moving to other zones 𝑁 !,&'() : Moving to other zones 𝑁 " : Moving within destination zones 𝑁 ",&'() : Moving within the zone 𝑁 # : Searching for shelters 𝑁 * : Reaching their destination 𝑁 $ : Completed evacuation
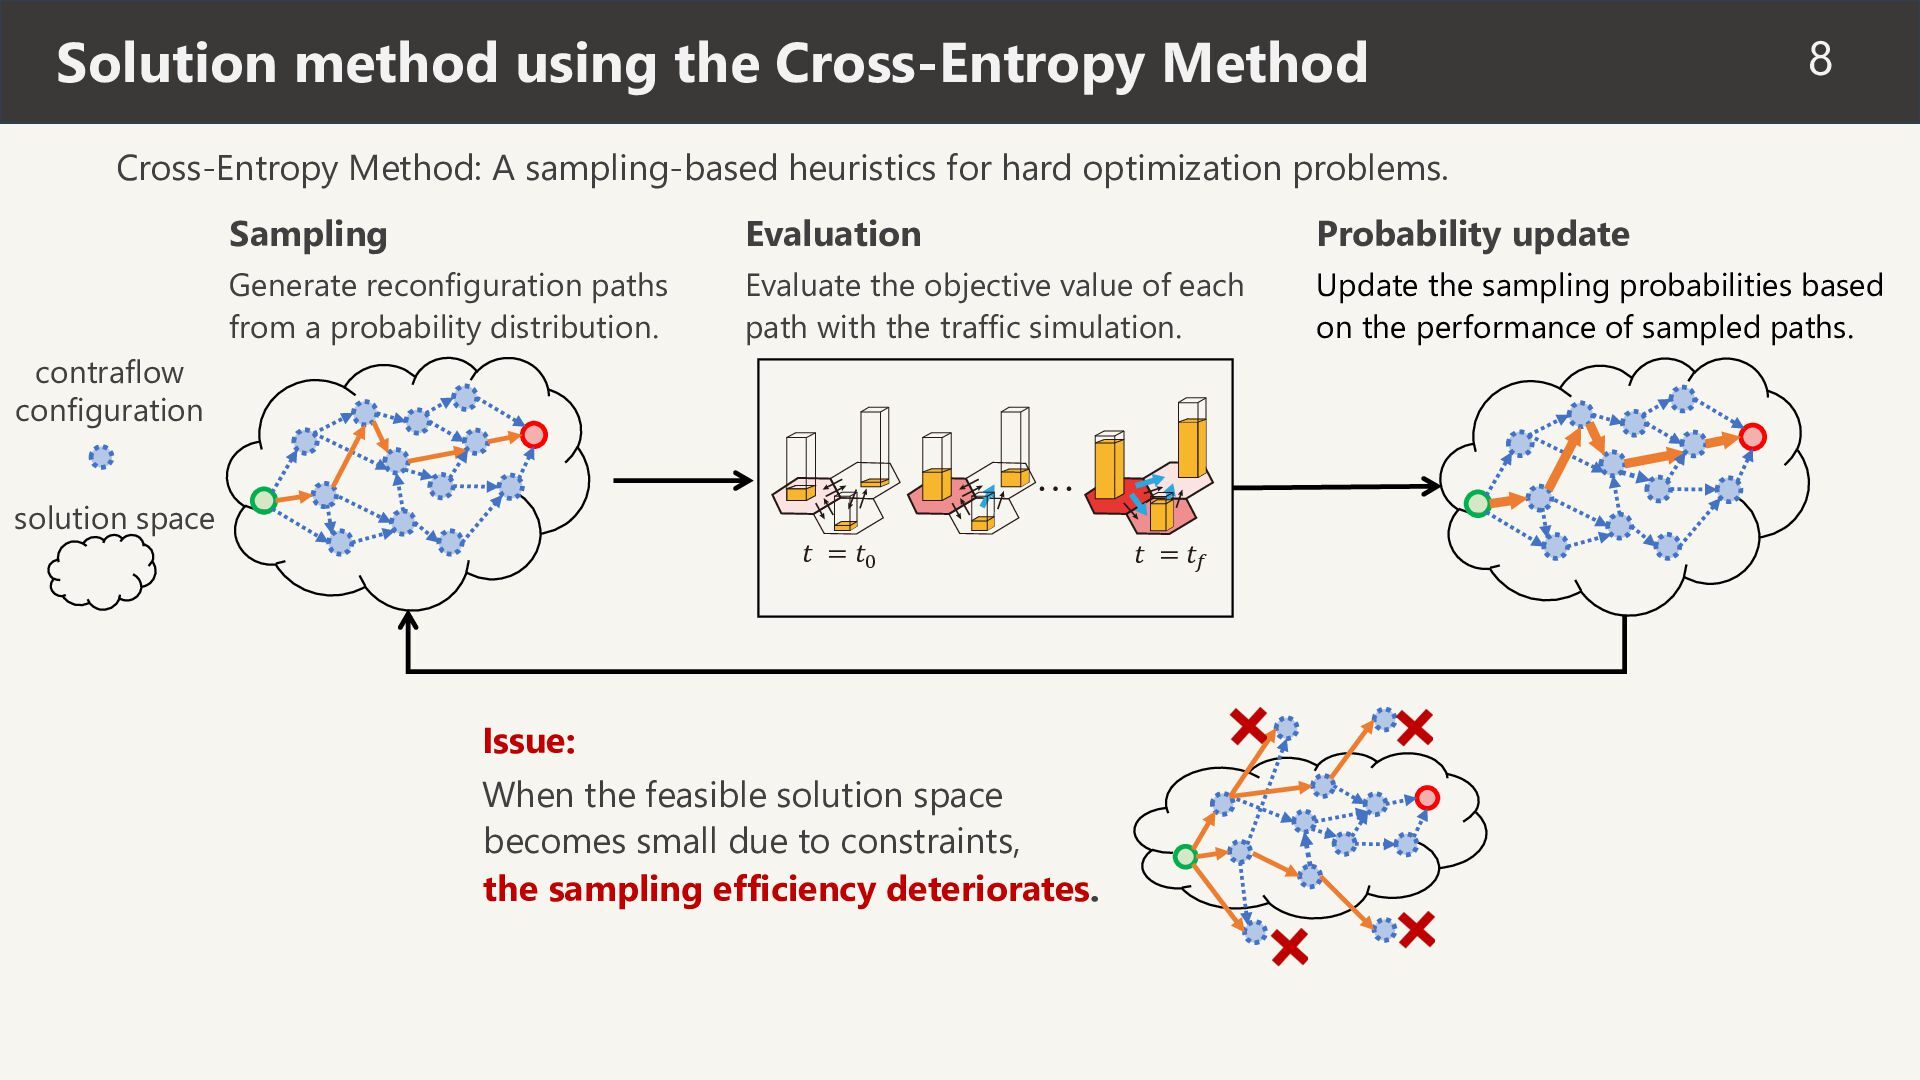
sampling-based heuristics for hard optimization problems. Sampling Evaluation Probability update Generate reconfiguration paths from a probability distribution. Evaluate the objective value of each path with the traffic simulation. Update the sampling probabilities based on the performance of sampled paths. contraflow configuration solution space 𝑡 = 𝑡- Issue: When the feasible solution space becomes small due to constraints, the sampling efficiency deteriorates. 𝑡 = 𝑡,
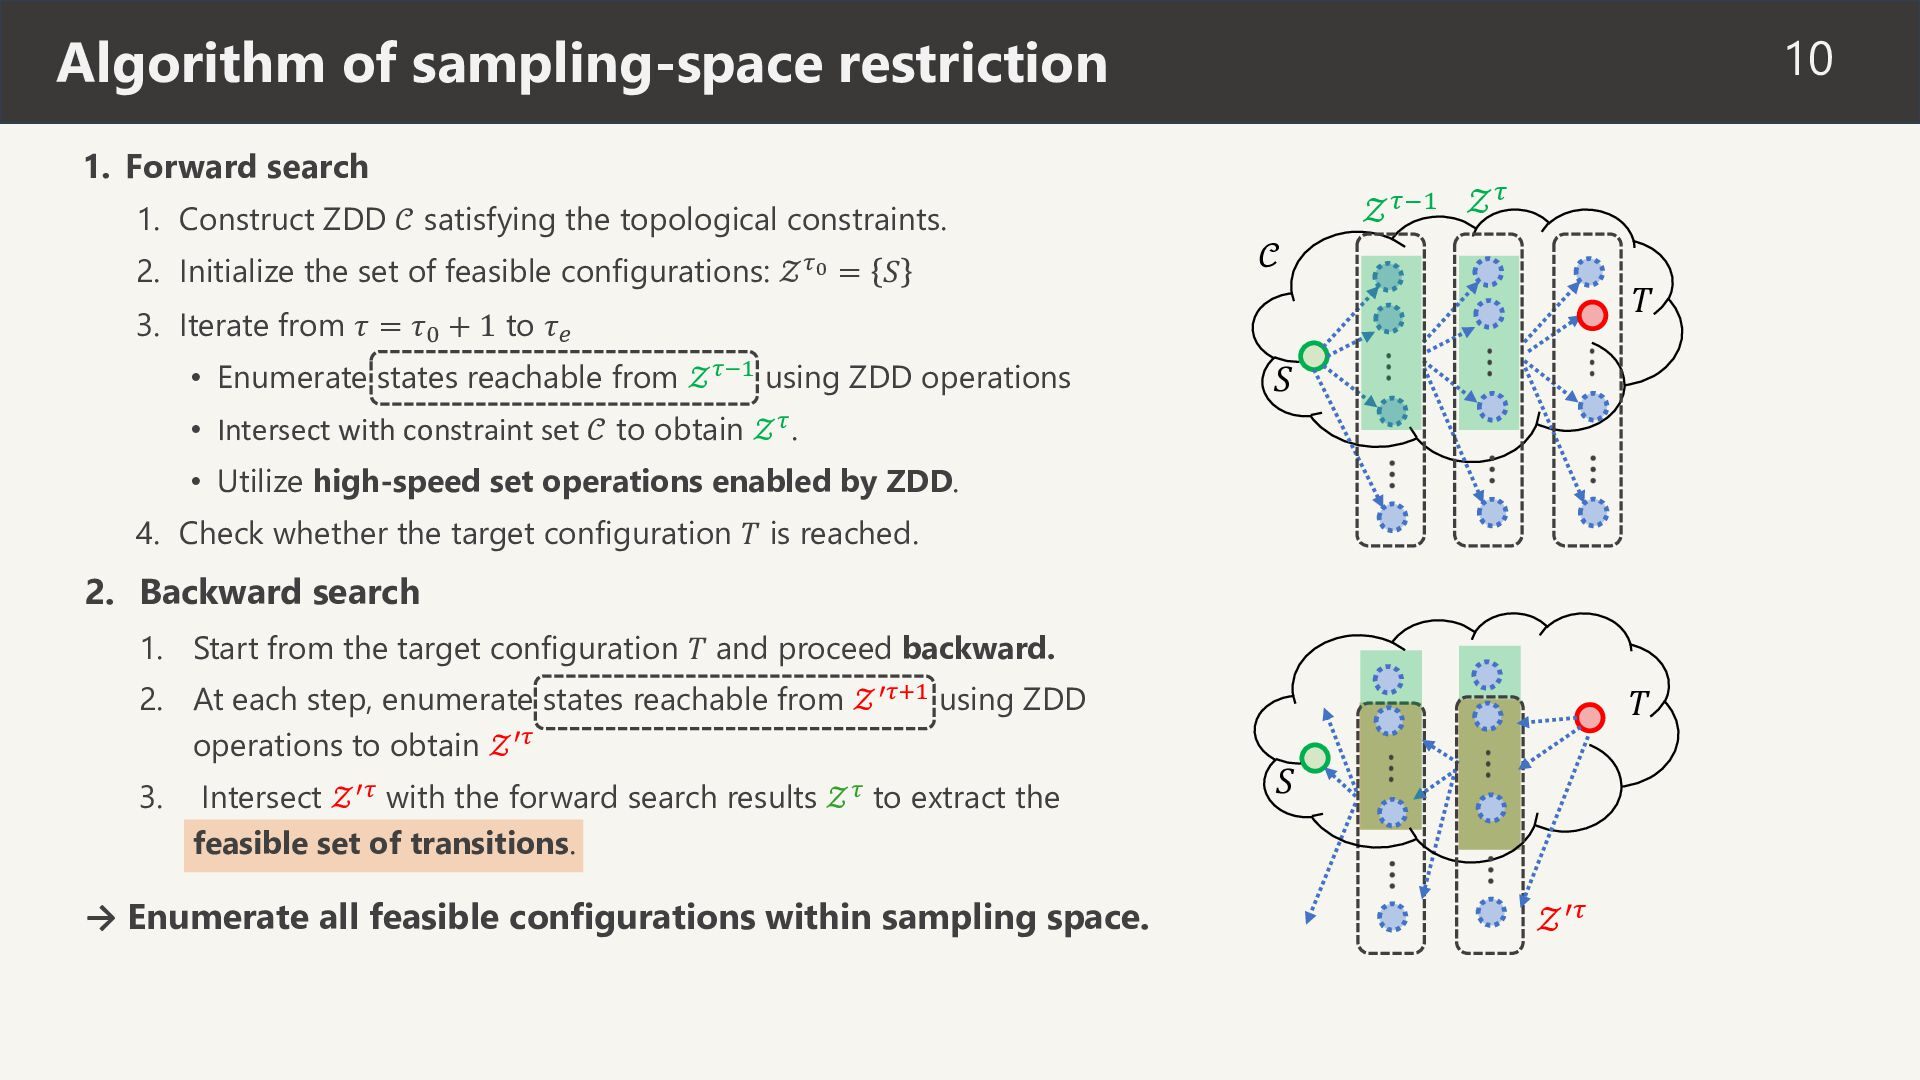
ZDD 𝒞 satisfying the topological constraints. 2. Initialize the set of feasible configurations: 𝒵 !. = 𝑆 ) 𝒵 ).' 𝒵 𝒞 𝑇 3. Iterate from 𝜏 = 𝜏$ + 1 to 𝜏% • Enumerate states reachable from 𝒵 !"# using ZDD operations 𝑆 • Intersect with constraint set 𝒞 to obtain 𝒵 ! . • Utilize high-speed set operations enabled by ZDD. 4. Check whether the target configuration 𝑇 is reached. 2. Backward search 1. Start from the target configuration 𝑇 and proceed backward. 2. At each step, enumerate states reachable from 𝒵 -!.# using ZDD operations to obtain 𝒵 -! 3. Intersect 𝒵 -! with the forward search results 𝒵 ! to extract the feasible set of transitions. → Enumerate all feasible configurations within sampling space. 𝑇 𝑆 𝒵 -)
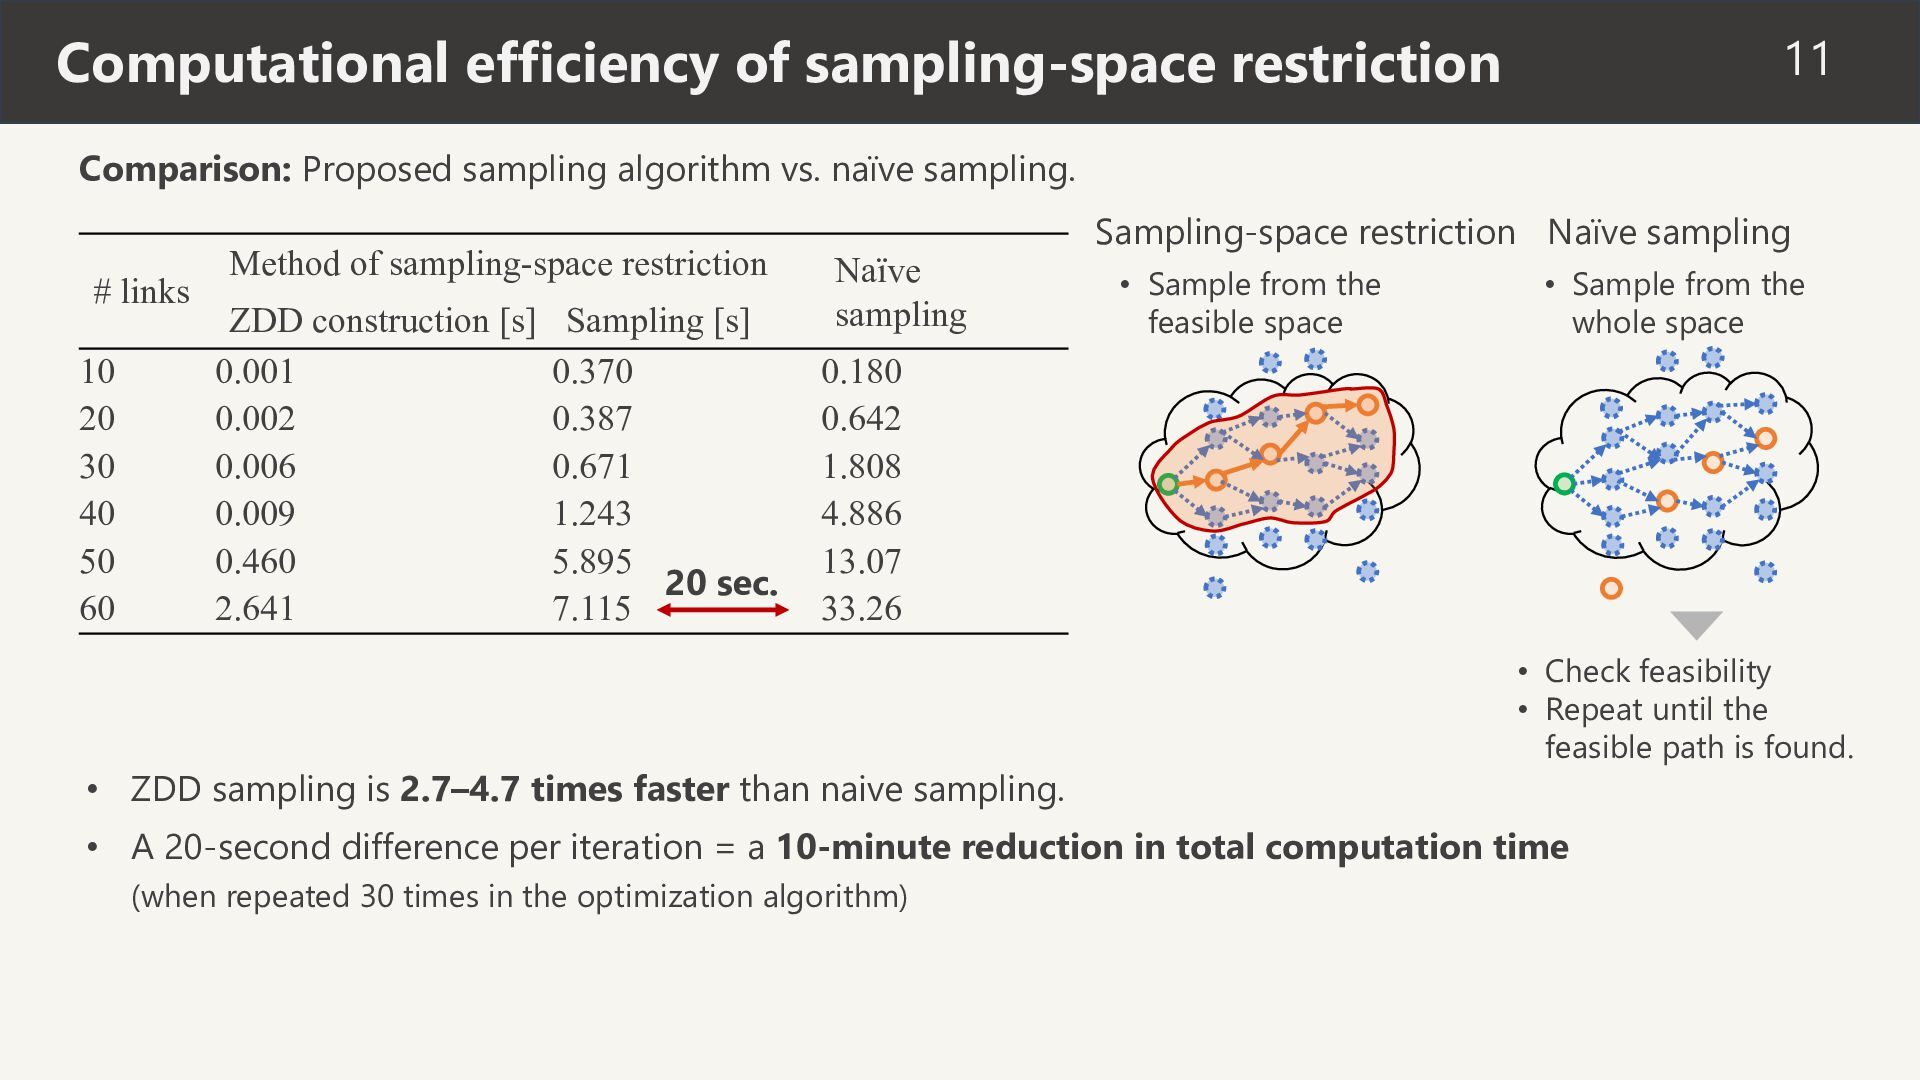
vs. naïve sampling. # links 10 20 30 40 50 60 Method of sampling-space restriction ZDD construction [s] Sampling [s] 0.001 0.370 0.002 0.387 0.006 0.671 0.009 1.243 0.460 5.895 20 sec. 2.641 7.115 Naïve sampling Sampling-space restriction Naïve sampling • Sample from the feasible space • Sample from the whole space 0.180 0.642 1.808 4.886 13.07 33.26 • ZDD sampling is 2.7–4.7 times faster than naive sampling. • Check feasibility • Repeat until the feasible path is found. • A 20-second difference per iteration = a 10-minute reduction in total computation time (when repeated 30 times in the optimization algorithm)
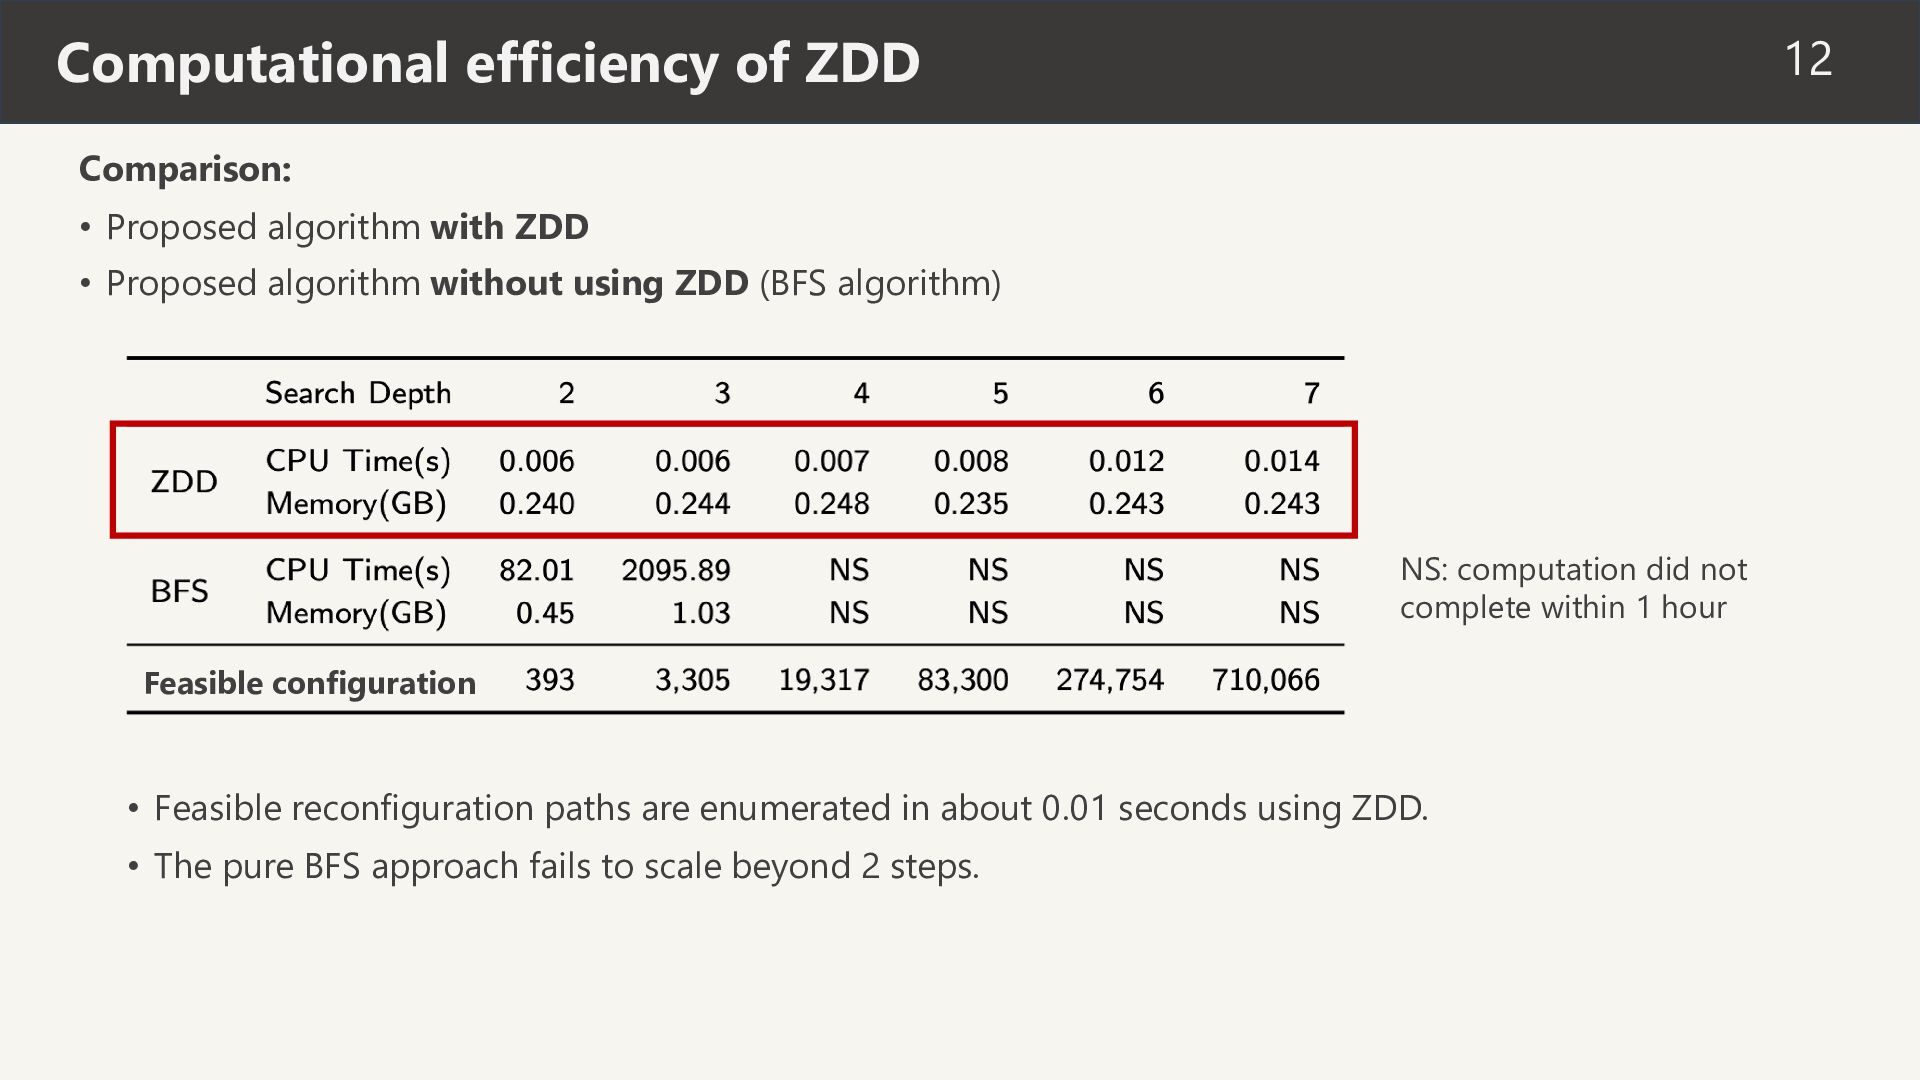
ZDD • Proposed algorithm without using ZDD (BFS algorithm) NS: computation did not complete within 1 hour Feasible configuration • Feasible reconfiguration paths are enumerated in about 0.01 seconds using ZDD. • The pure BFS approach fails to scale beyond 2 steps.
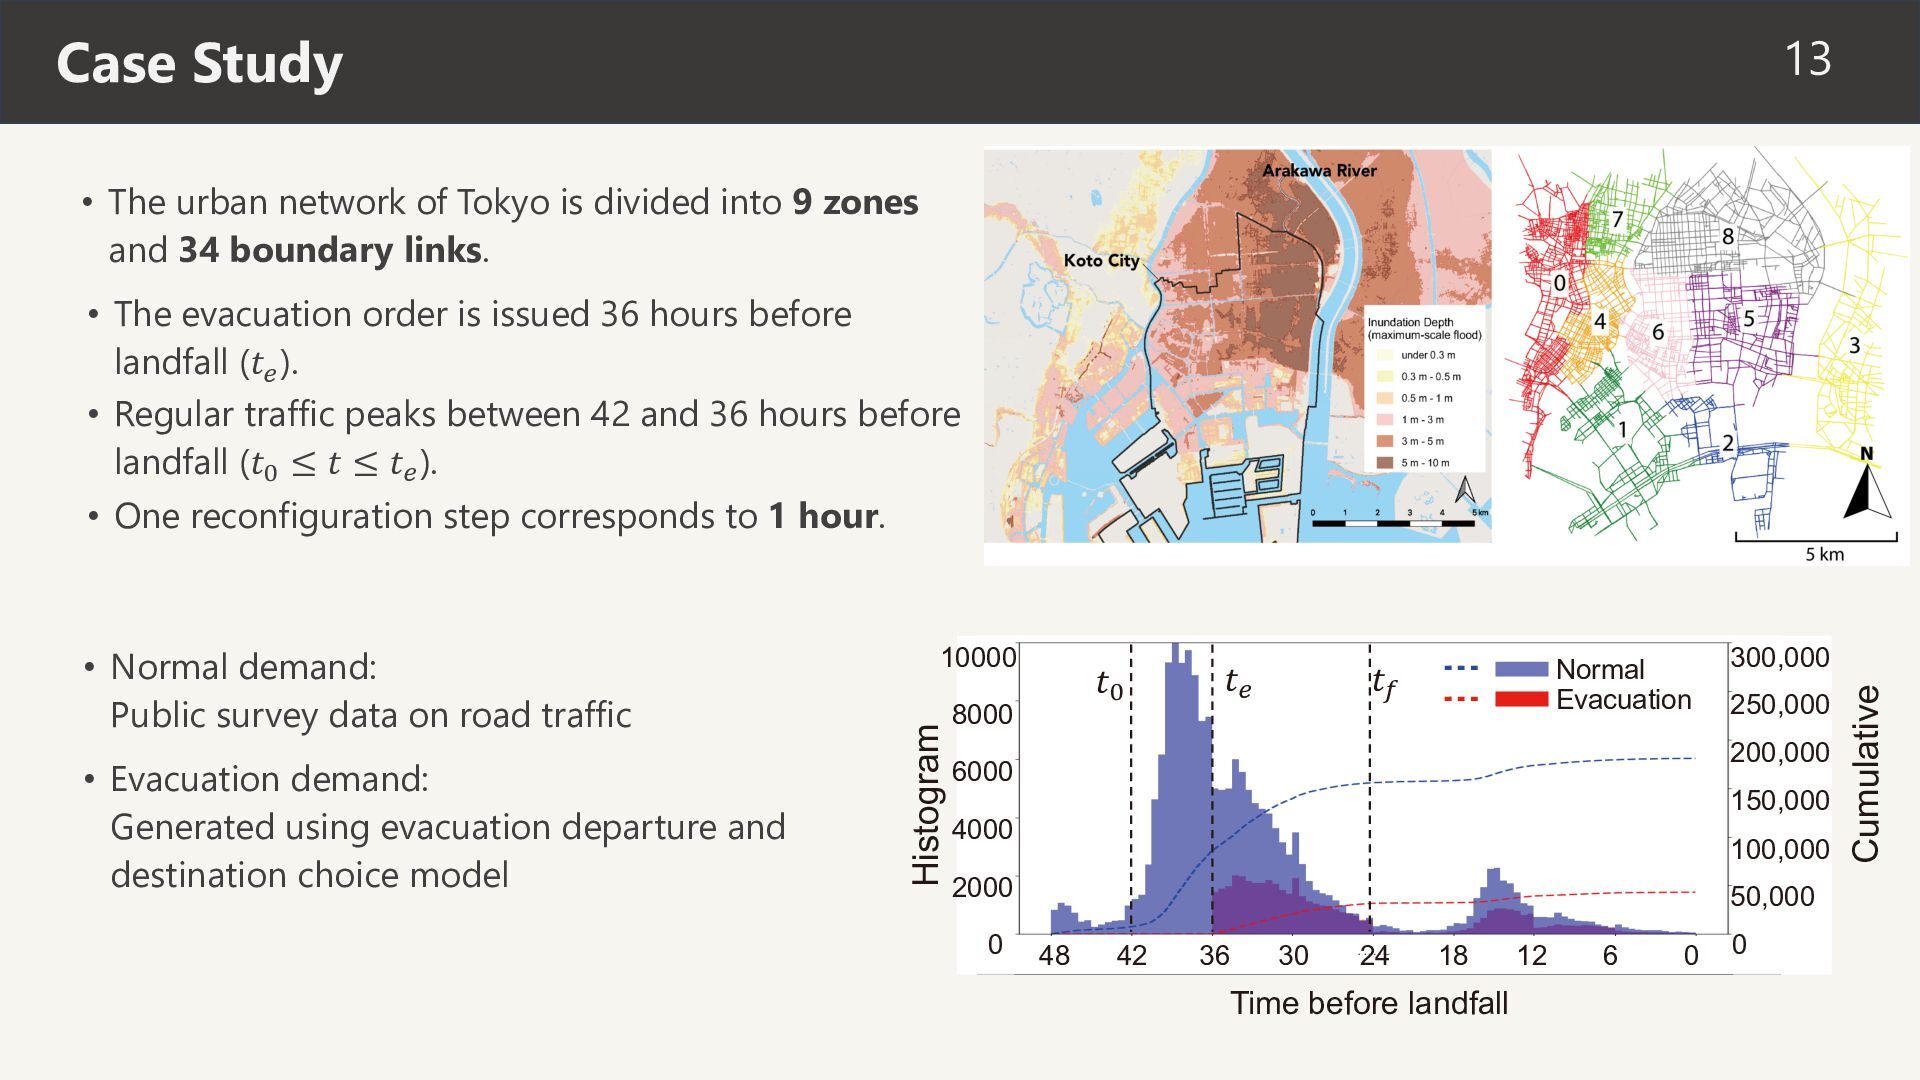
divided into 9 zones and 34 boundary links. • The evacuation order is issued 36 hours before landfall (𝑡$ ). • Regular traffic peaks between 42 and 36 hours before landfall (𝑡% ≤ 𝑡 ≤ 𝑡$ ). • One reconfiguration step corresponds to 1 hour. 𝑡% 8000 Normal Evacuation 𝑡& 𝑡$ 250,000 200,000 6000 150,000 4000 100,000 2000 0 300,000 50,000 48 42 36 30 24 18 Time before landfall 12 6 0 0 Cumulative • Evacuation demand: Generated using evacuation departure and destination choice model 10000 Histogram • Normal demand: Public survey data on road traffic
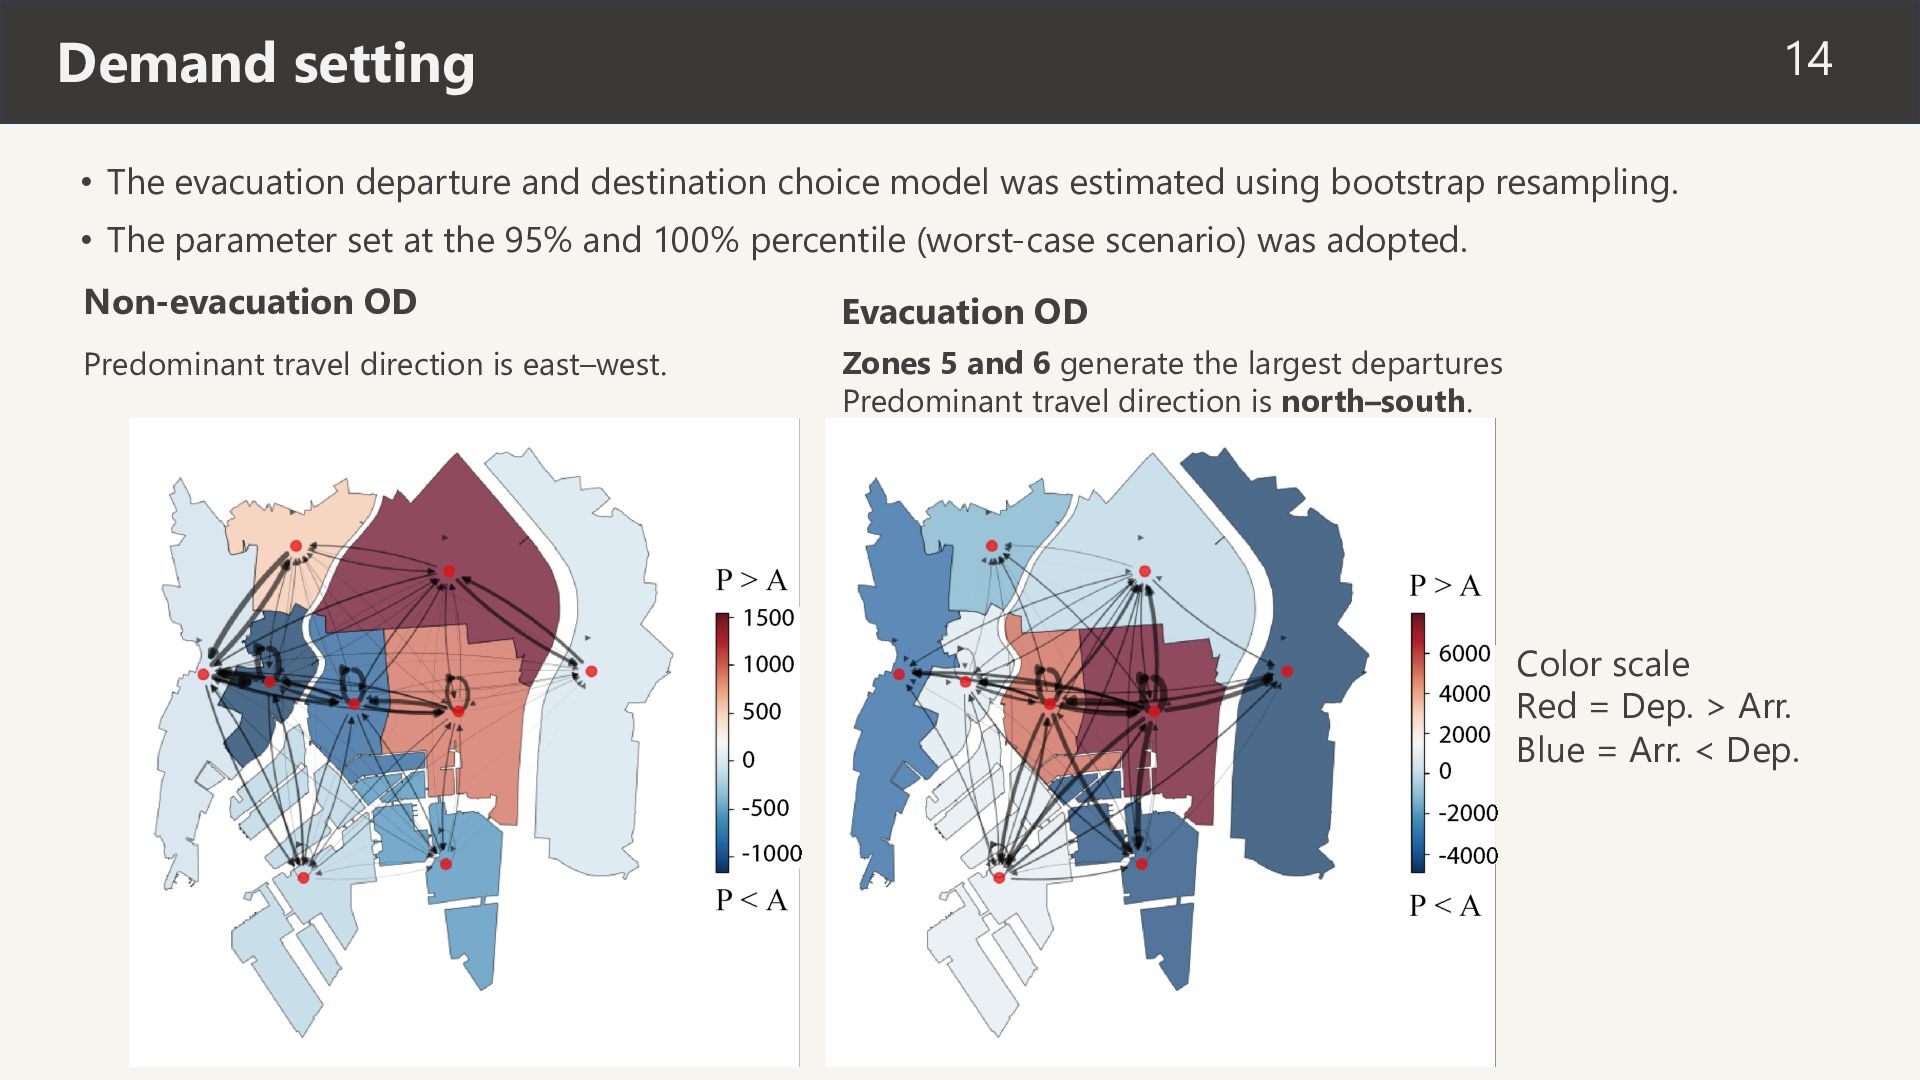
model was estimated using bootstrap resampling. • The parameter set at the 95% and 100% percentile (worst-case scenario) was adopted. Non-evacuation OD Evacuation OD Predominant travel direction is east–west. Zones 5 and 6 generate the largest departures Predominant travel direction is north–south. Color scale Red = Dep. > Arr. Blue = Arr. < Dep.
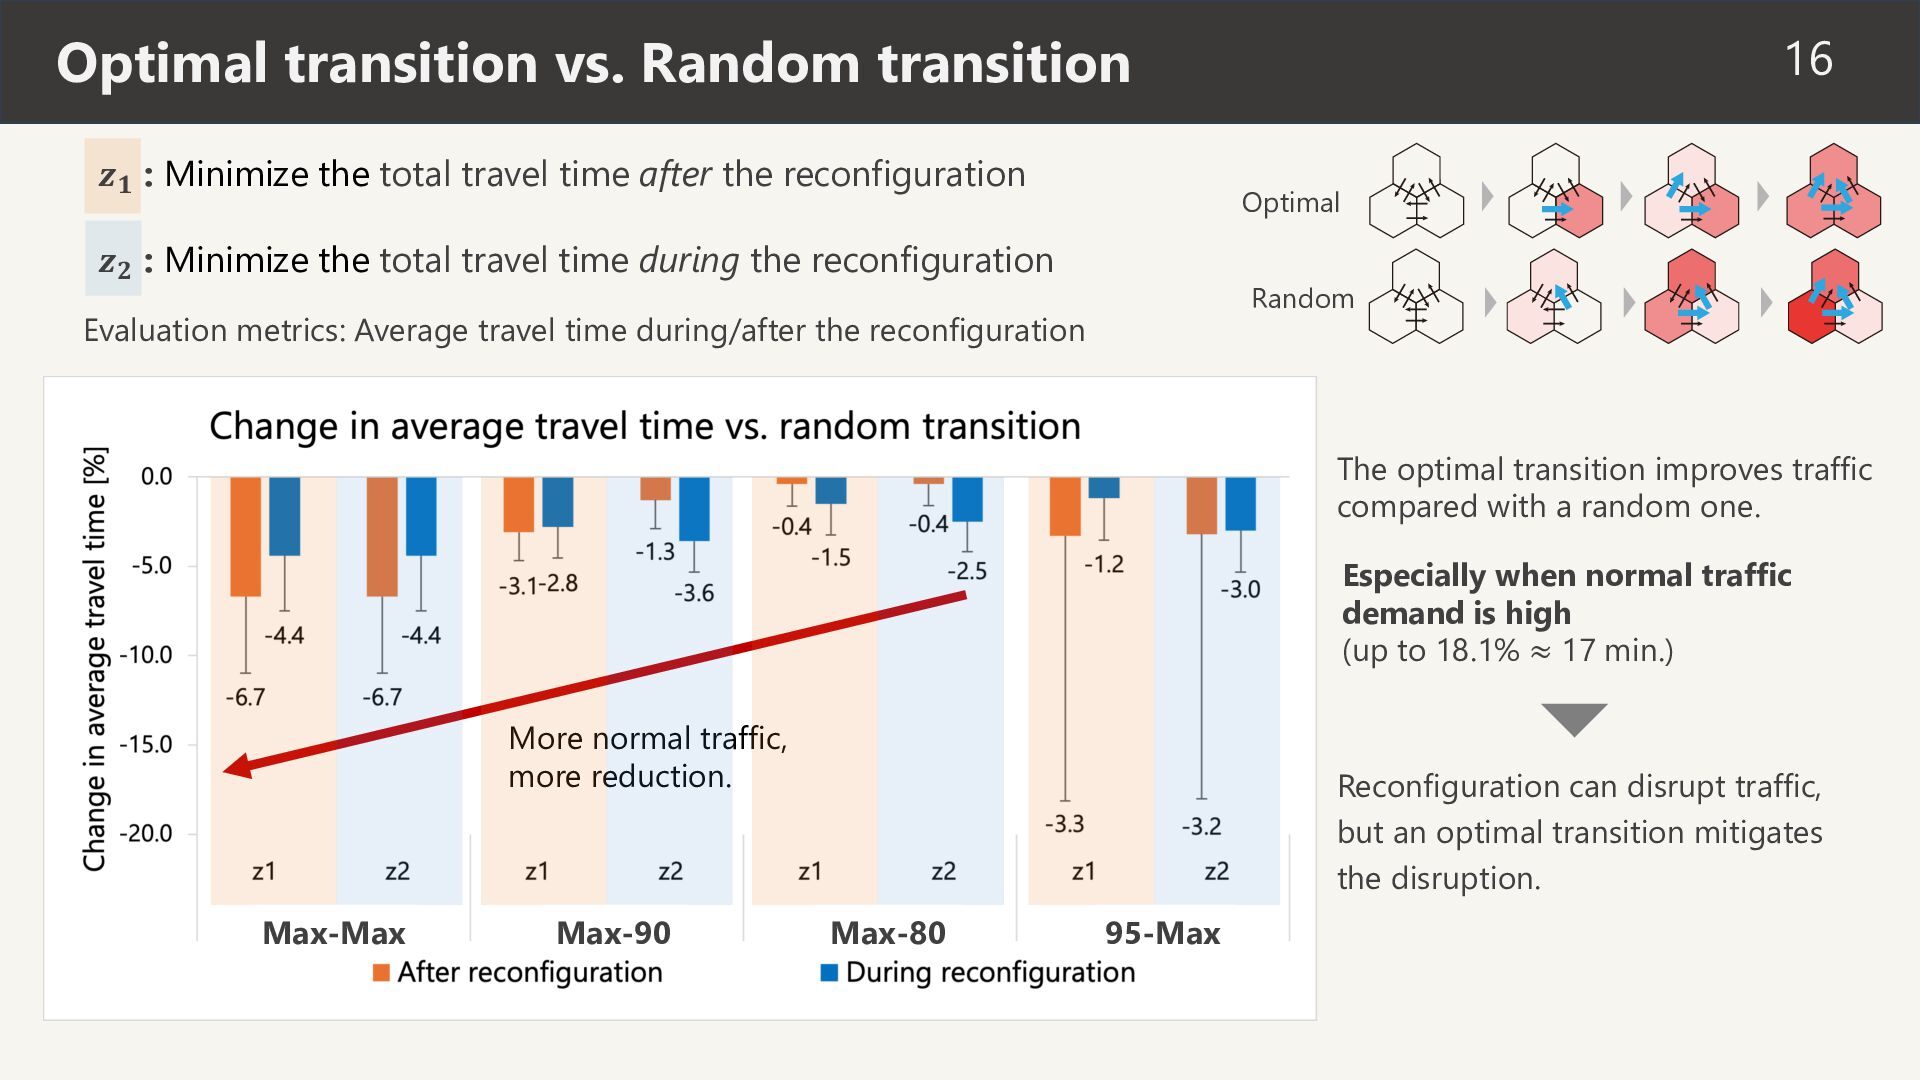
travel time after the reconfiguration 16 Optimal 𝒛𝟐 : Minimize the total travel time during the reconfiguration Random Evaluation metrics: Average travel time during/after the reconfiguration The optimal transition improves traffic compared with a random one. Especially when normal traffic demand is high (up to 18.1% ≈ 17 min.) More normal traffic, more reduction. Max-Max Max-90 Reconfiguration can disrupt traffic, but an optimal transition mitigates the disruption. Max-80 95-Max
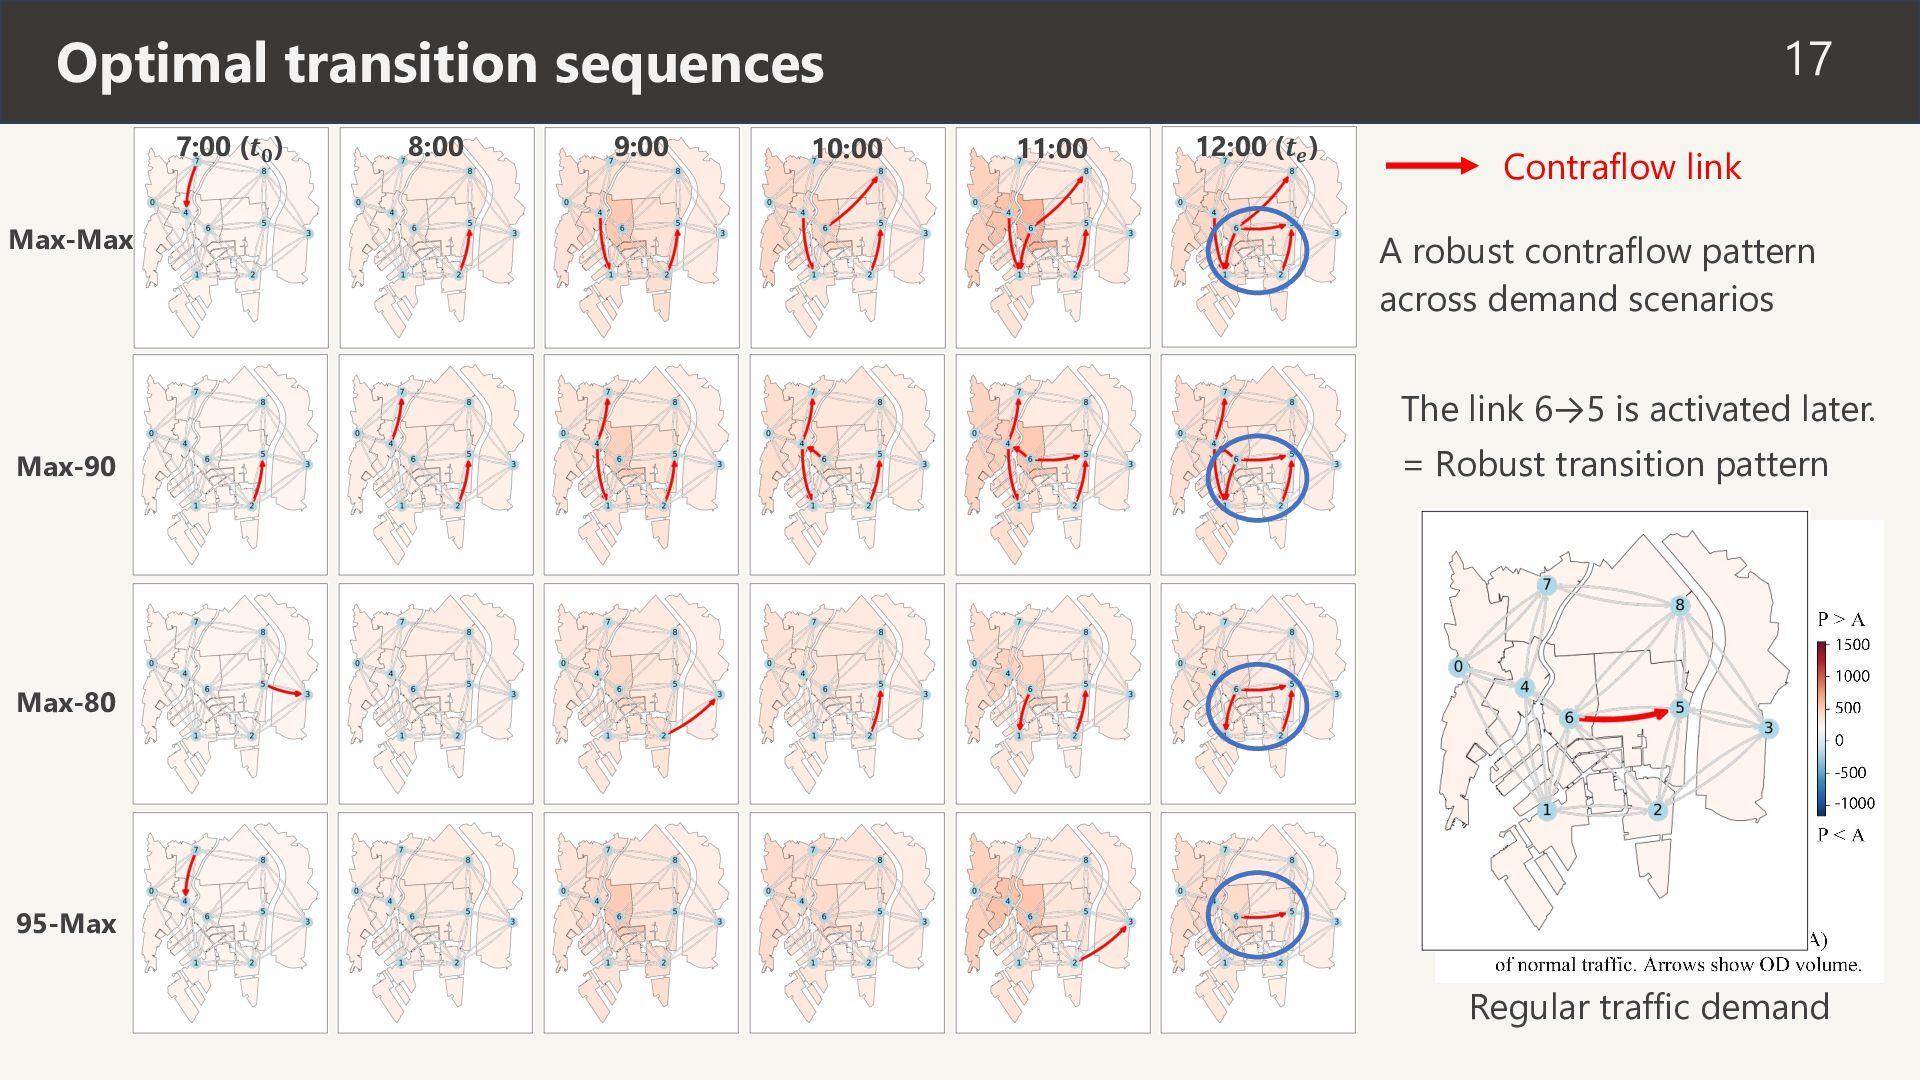
17 11:00 12:00 (𝒕𝒆 ) Contraflow link A robust contraflow pattern across demand scenarios The link 6→5 is activated later. Max-90 = Robust transition pattern Max-80 95-Max Regular traffic demand
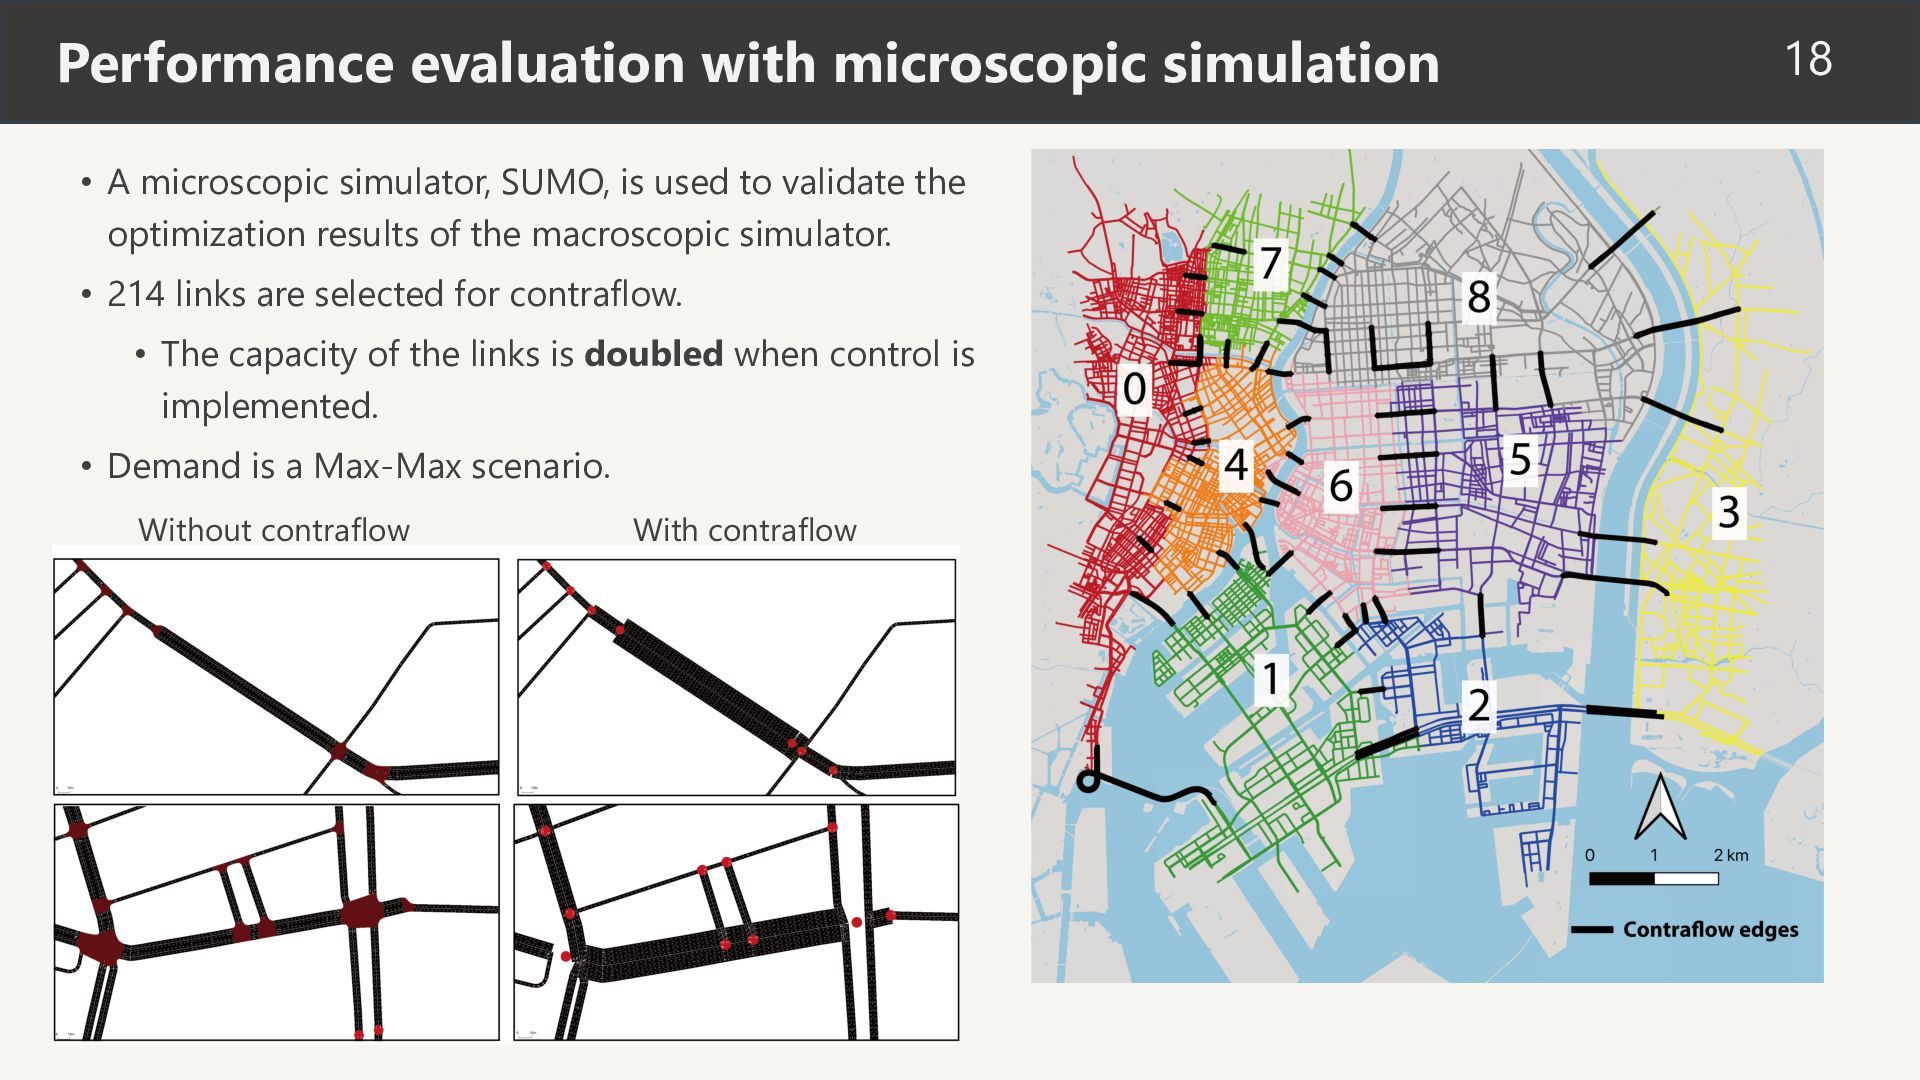
is used to validate the optimization results of the macroscopic simulator. • 214 links are selected for contraflow. • The capacity of the links is doubled when control is implemented. • Demand is a Max-Max scenario. Without contraflow With contraflow 18
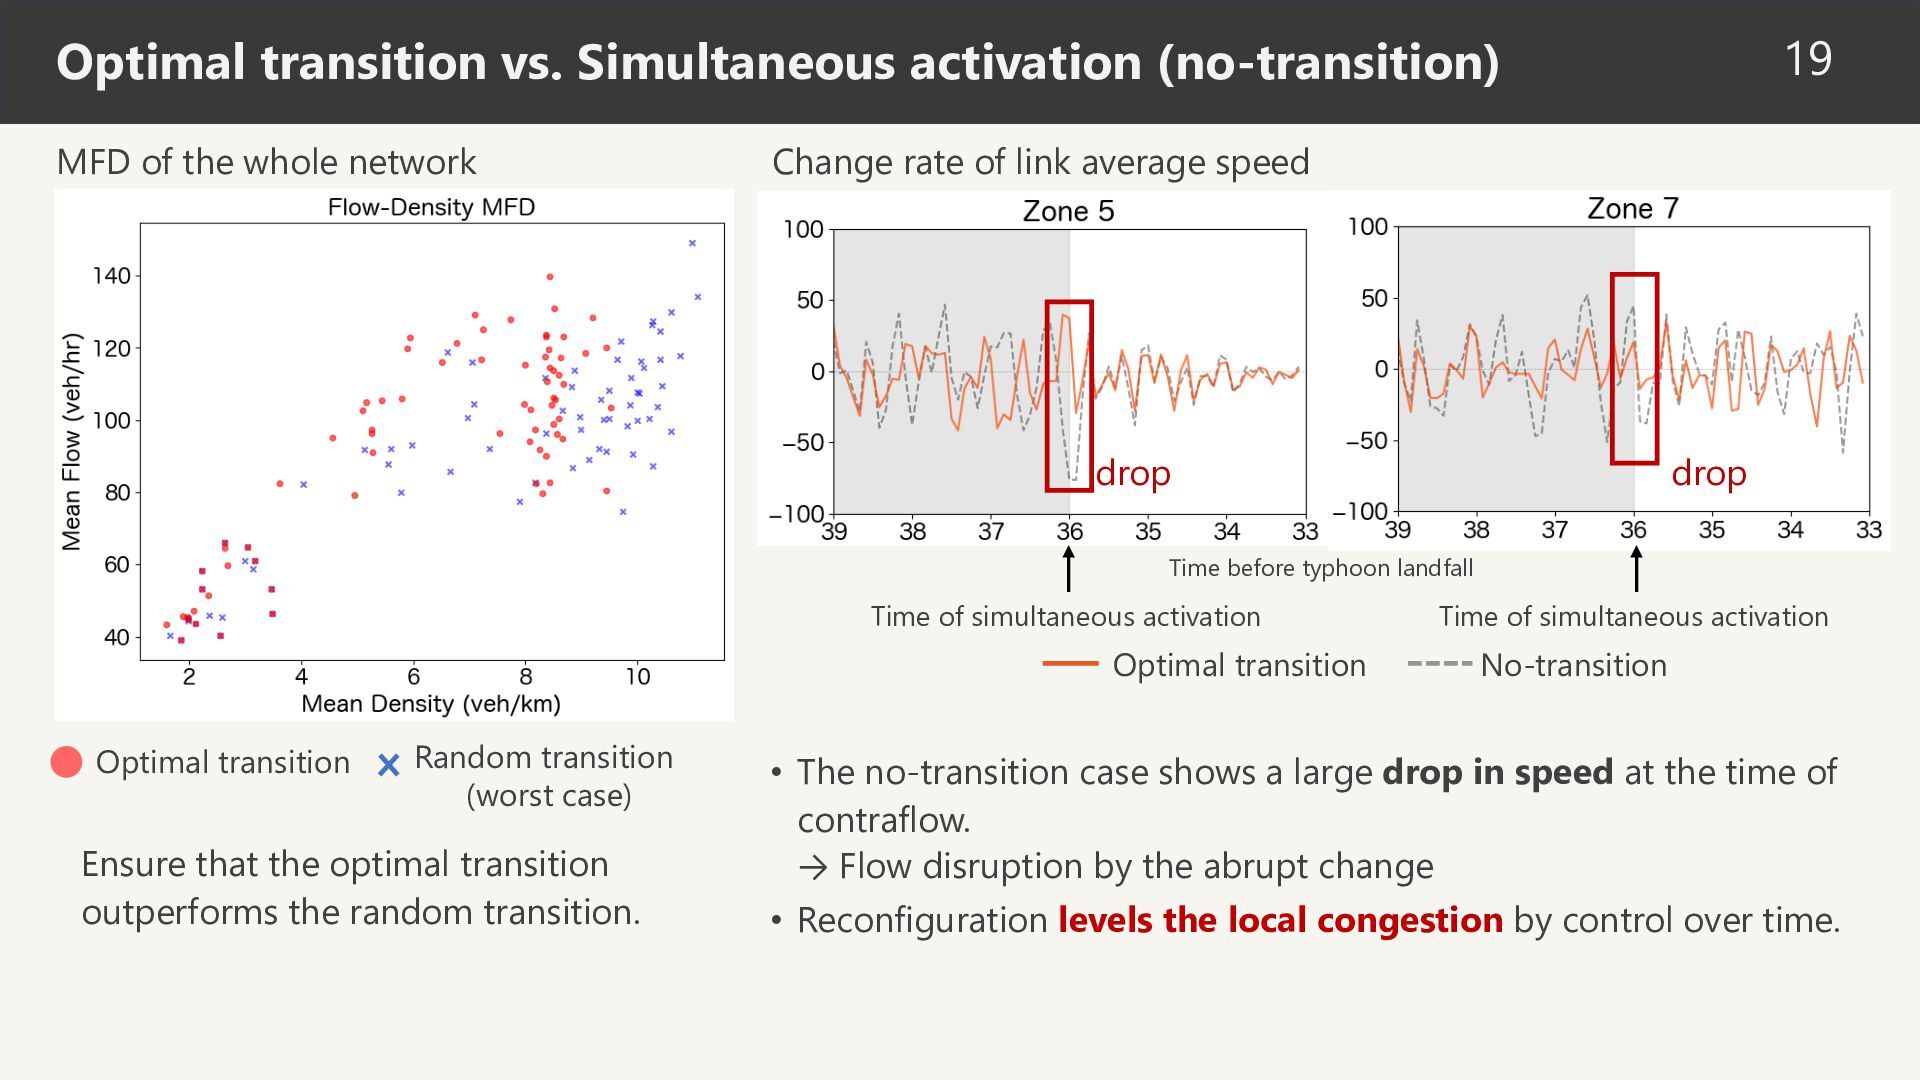
whole network Change rate of link average speed drop drop Time before typhoon landfall Time of simultaneous activation Optimal transition Optimal transition Random transition (worst case) Ensure that the optimal transition outperforms the random transition. Time of simultaneous activation No-transition • The no-transition case shows a large drop in speed at the time of contraflow. → Flow disruption by the abrupt change • Reconfiguration levels the local congestion by control over time.
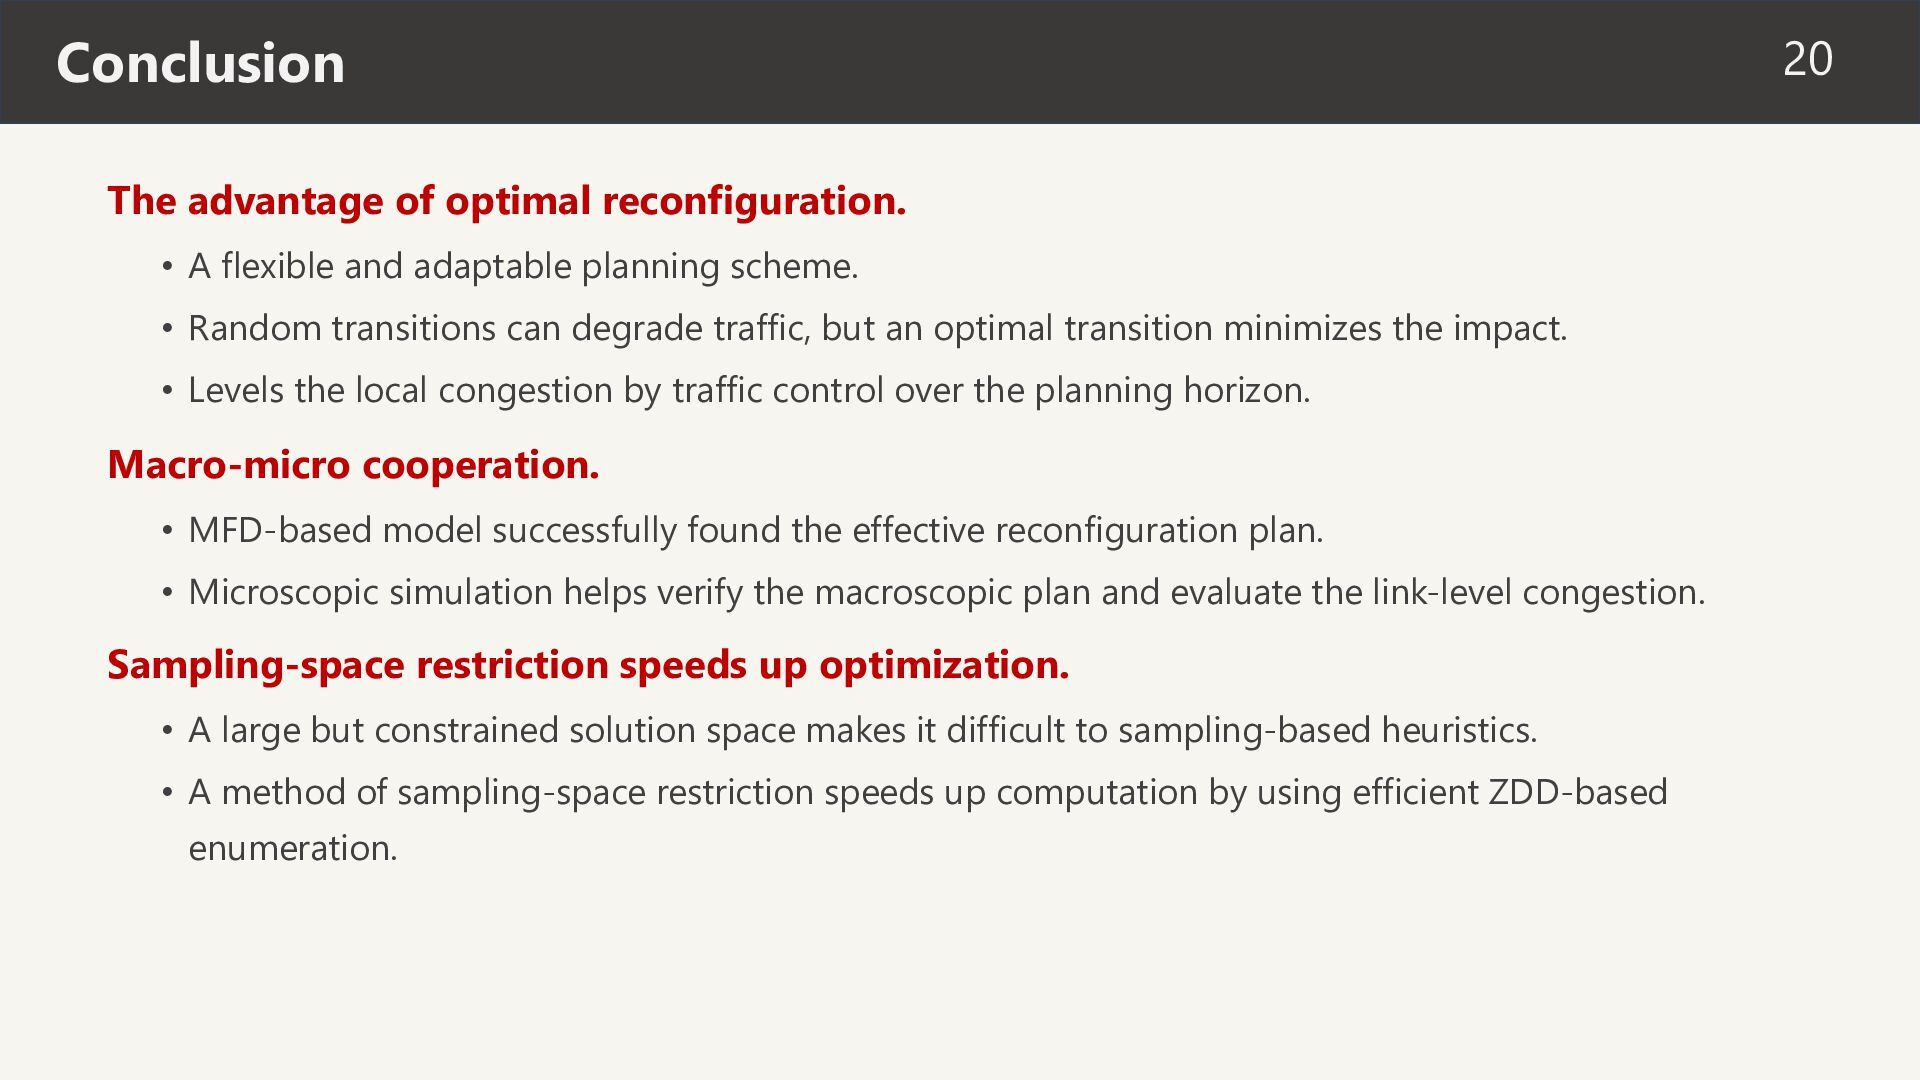
adaptable planning scheme. • Random transitions can degrade traffic, but an optimal transition minimizes the impact. • Levels the local congestion by traffic control over the planning horizon. Macro-micro cooperation. • MFD-based model successfully found the effective reconfiguration plan. • Microscopic simulation helps verify the macroscopic plan and evaluate the link-level congestion. Sampling-space restriction speeds up optimization. • A large but constrained solution space makes it difficult to sampling-based heuristics. • A method of sampling-space restriction speeds up computation by using efficient ZDD-based enumeration. 20


 stkmsd
 kzmssk
 institutdelelevage
 s_mizuki_nlp
 tkng
tkng
 youten622
 kentaitakura
 kzinmr
 fkske
fkske
 kanekomasahiro
.png) satai
satai
 jakevdp
 tanoku
 rabernat
 tonyrice
 palkan
 speakerdeck
 akosma
 codingconduct
 aleyda
 rakko
rakko
 bluesmoon
 minecr