Upgrade to Pro — share decks privately, control downloads, hide ads and more …

Monitoring Drought and Predicting Rice Supply w...

Sponsored · Your Podcast. Everywhere. Effortlessly. Share. Educate. Inspire. Entertain. You do you. We'll handle the rest.
Avatar for takeofuture takeofuture
September 22, 2026

Monitoring Drought and Predicting Rice Supply with GIS, Satellite Data, and Python

Presented at FOSS4G North America 2026 in Sacramento, California.
This talk explores how GIS, drought data, and satellite observations can be combined to monitor California rice production and identify early signals of supply change.

The workflow combines USDA NASS agricultural statistics, California DWR rice-field polygons, U.S. Drought Monitor data, Sentinel-2 optical indicators, and Sentinel-1 SAR observations processed with Google Earth Engine and Python.

A 2021–2023 case study highlights the sharp reduction in California rice acreage and production in 2022, while satellite indicators suggest that the rice fields actually planted followed broadly similar seasonal crop-condition patterns. The analysis motivates a framework that combines water availability, planted acreage, and in-season satellite signals for future GeoAI and machine-learning applications.

Event: FOSS4G North America 2026
Location: Sacramento, California
Tools: Python, GeoPandas, Google Earth Engine, Sentinel-1, Sentinel-2, USDA NASS, California DWR, U.S. Drought Monitor

Avatar for takeofuture

takeofuture

September 22, 2026

More Decks by takeofuture

Other Decks in Technology

Transcript

  1. - Born and raised in Aichi, Japan - Background in

    Geophysics - Over 30 years of experience in software and information systems - Currently working on data science and AI-related projects - Based in Southern California Areas of Interest - GIS & Remote Sensing - GeoAI / Machine Learning - Earth Observation & Satellite Data - Python for Geospatial Analysis - Open Data & Open Source GIS - Environmental, agricultural, and disaster-related applications Outside of GIS - Hiking & camping - Cycling - Train travel - Robotics & electronics projects @takeofuture dev.to/takeofuture www.linkedin.com/in/takeofuture/
  2. OUTLINE ▪ ▪ ▪ ▪ ▪ ▪ ▪ ▪ ▪

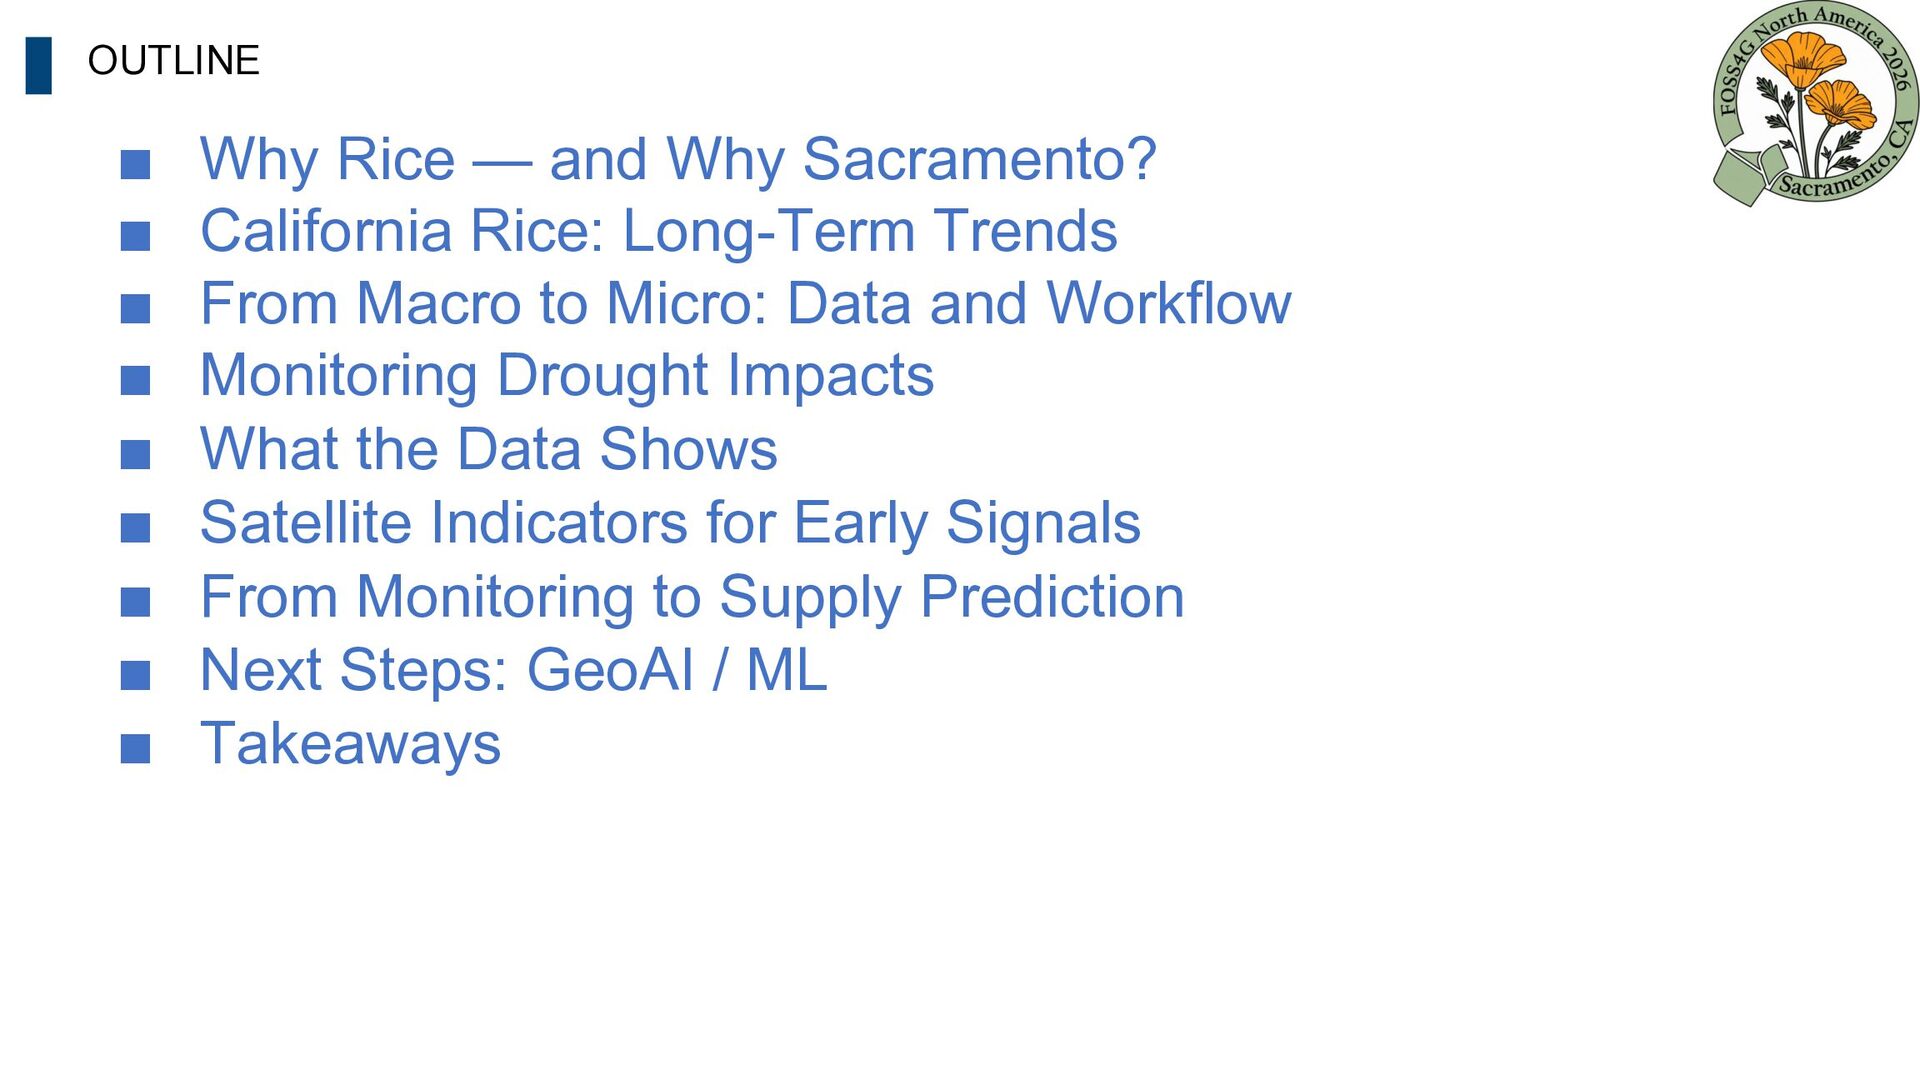
    Why Rice — and Why Sacramento? California Rice: Long-Term Trends From Macro to Micro: Data and Workflow Monitoring Drought Impacts What the Data Shows Satellite Indicators for Early Signals From Monitoring to Supply Prediction Next Steps: GeoAI / ML Takeaways
  3. Why Rice — and Why Sacramento? Why Sacramento? The Sacramento

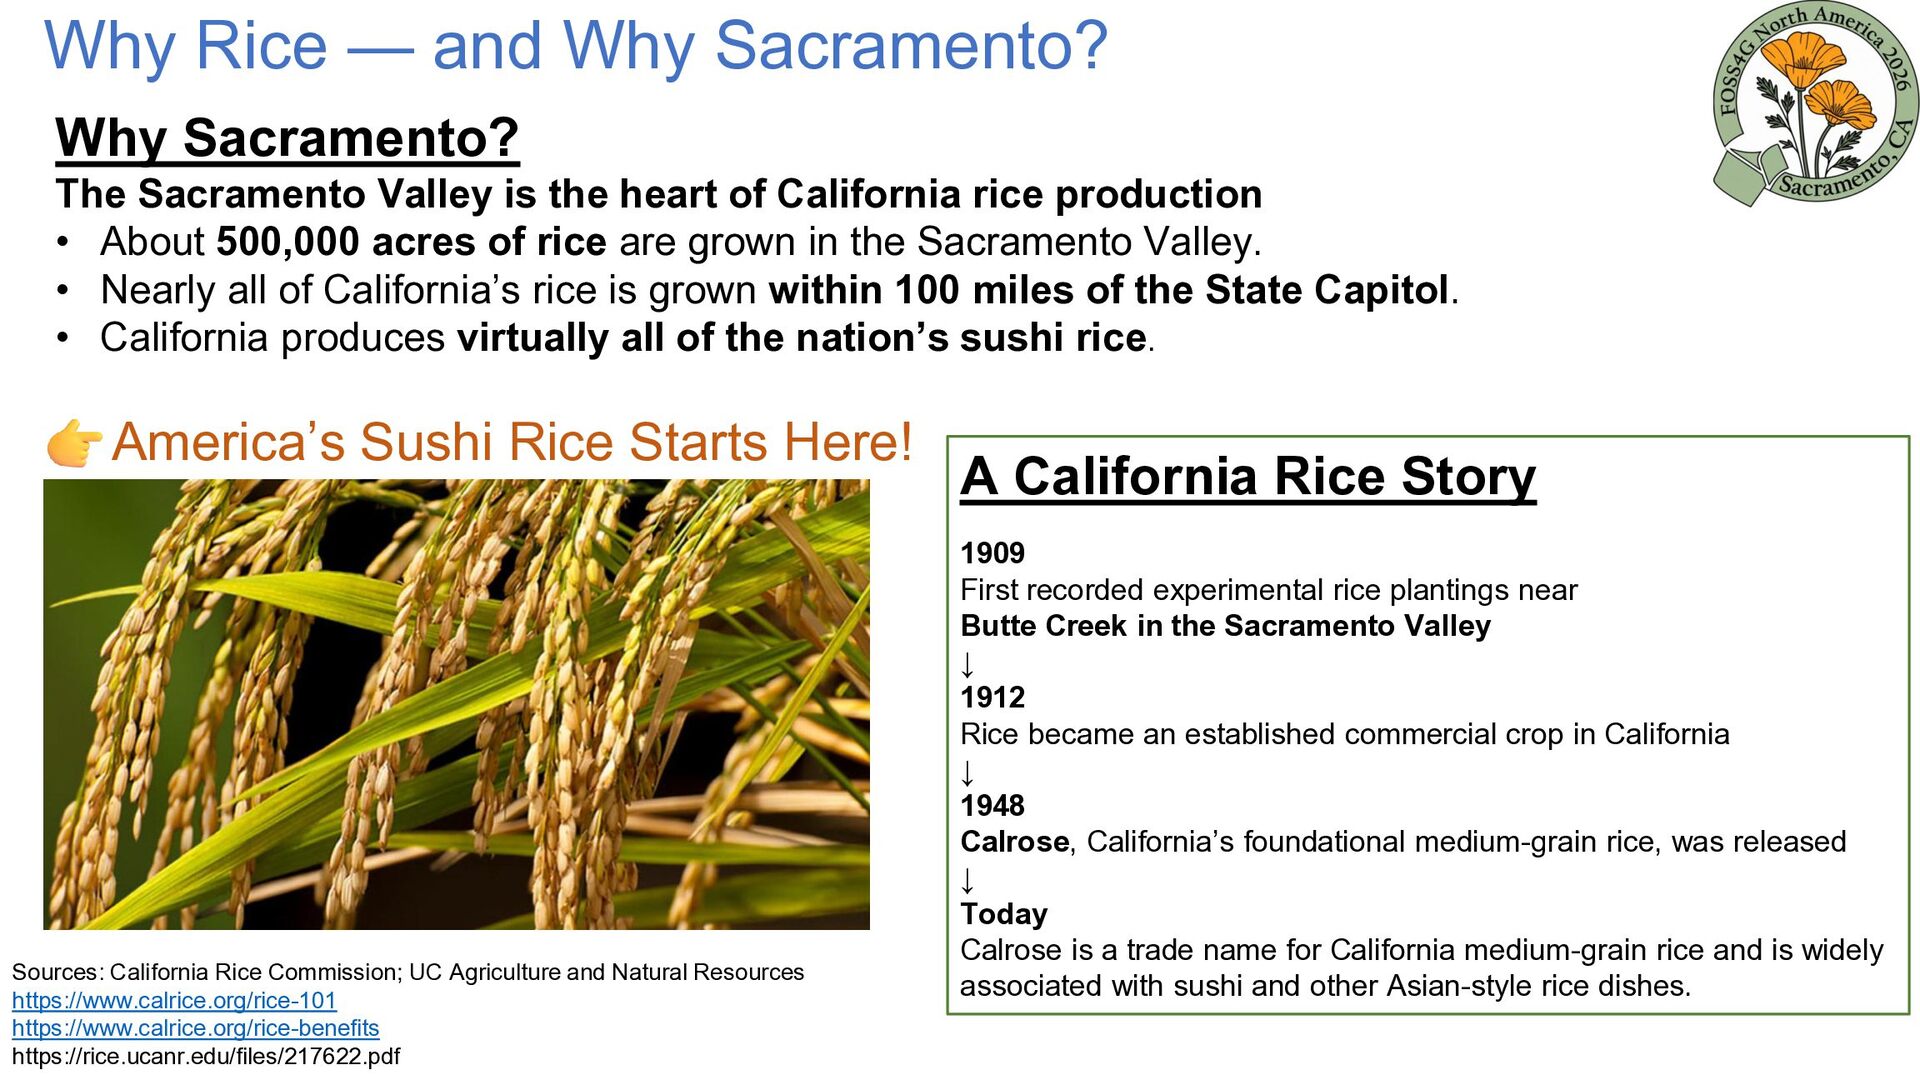
    Valley is the heart of California rice production • About 500,000 acres of rice are grown in the Sacramento Valley. • Nearly all of California’s rice is grown within 100 miles of the State Capitol. • California produces virtually all of the nation’s sushi rice. America’s Sushi Rice Starts Here! Sources: California Rice Commission; UC Agriculture and Natural Resources https://www.calrice.org/rice-101 https://www.calrice.org/rice-benefits https://rice.ucanr.edu/files/217622.pdf A California Rice Story 1909 First recorded experimental rice plantings near Butte Creek in the Sacramento Valley ↓ 1912 Rice became an established commercial crop in California ↓ 1948 Calrose, California’s foundational medium-grain rice, was released ↓ Today Calrose is a trade name for California medium-grain rice and is widely associated with sushi and other Asian-style rice dishes.
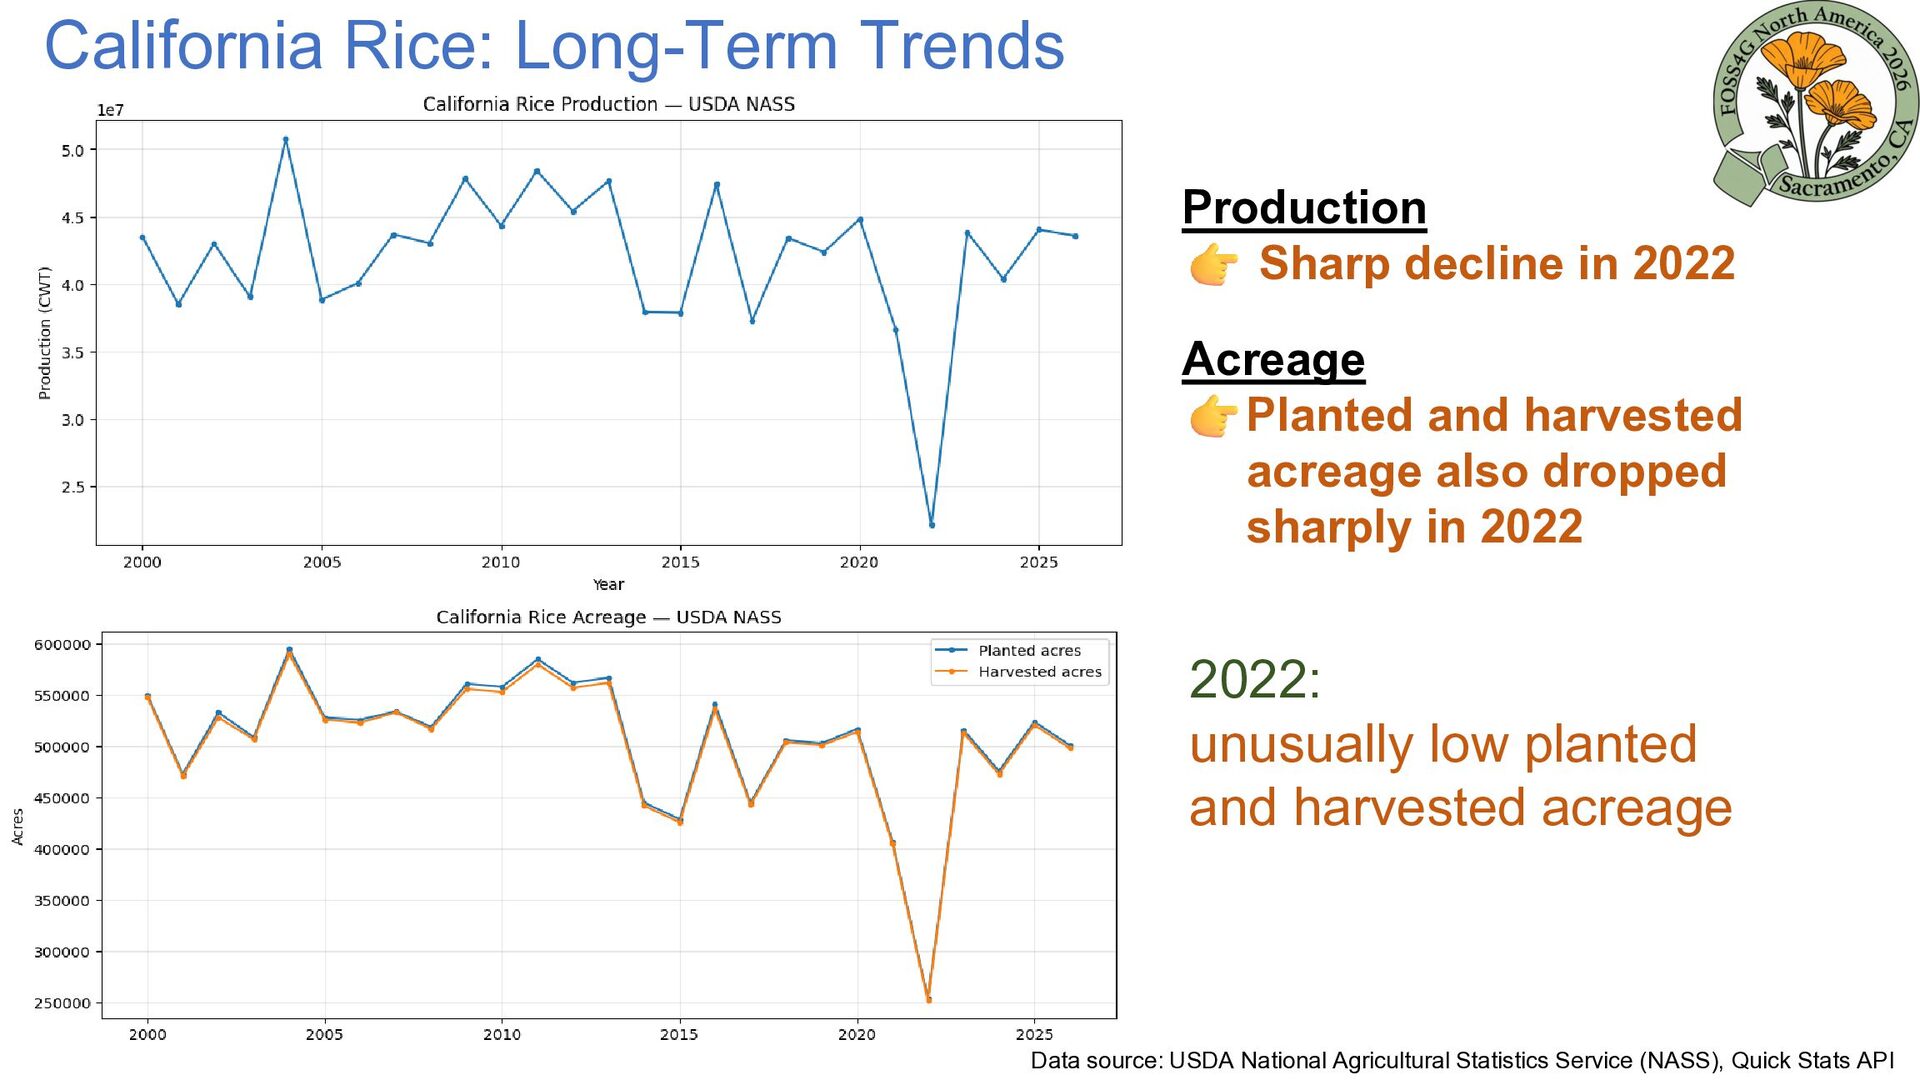
  4. California Rice: Long-Term Trends Production Sharp decline in 2022 Acreage

    Planted and harvested acreage also dropped sharply in 2022 2022: unusually low planted and harvested acreage Data source: USDA National Agricultural Statistics Service (NASS), Quick Stats API