Upgrade to Pro — share decks privately, control downloads, hide ads and more …

Data visualization: Mapping #ottflood

Data visualization: Mapping #ottflood

Trish Audette-Longo

May 13, 2019
Tweet

More Decks by Trish Audette-Longo

Other Decks in Education

Transcript

  1. Building a map • We are building a map using

    Google My Maps – for Exercise #2 you will build a test Google map, too.
  2. Building a map • We are building a map using

    Google My Maps – in Exercise #2 you will build a test Google map, too. • The key information we will need:
  3. Building a map • We are building a map using

    Google My Maps – in Exercise #2 you will build a test Google map, too. • The key information we will need: – Tweets that include locations. – Tweets that include images that can be embedded in our map. – Who posted the tweet, and when.
  4. Building a map • We are building a map using

    Google My Maps – in Exercise #2 you will build a test Google map, too. • The key information we will need: – Tweets that include locations. – Tweets that include images that can be embedded in our map. – Who posted the tweet, and when. • Information we do not need:
  5. Building a map • We are building a map using

    Google My Maps – in Exercise #2 you will build a test Google map, too. • The key information we will need: – Tweets that include locations. – Tweets that include images that can be embedded in our map. – Who posted the tweet, and when. • Information we do not need: – RTs, or retweets.
  6. Discuss: • Does it make sense to get rid of

    tweets from other media organizations?
  7. Does it make sense to get rid of tweets from

    other media organizations? • The finished map will be an example of “networked journalism” (Jarvis 2006; Beckett 2008): journalism that curates information shared by members of the community, and invites the community’s participation.
  8. Does it make sense to get rid of tweets from

    other media organizations? • The finished map will be an example of “networked journalism” (Jarvis 2006; Beckett 2008): journalism that curates information shared by members of the community and invites the community’s participation. • Once visualized and made legible for readers, the finished map should be augmented by your own original reporting.
  9. Does it make sense to get rid of tweets from

    other media organizations? • The finished map will be an example of “networked journalism” (Jarvis 2006; Beckett 2008): journalism that curates information shared by members of the community and invites the community’s participation. • Once visualized and made legible for readers, this information should be augmented by your own original reporting. • Practically, ridding the data set of other reporters and news organizations will also make the map less busy, and give your readers a new way of looking at how flooding affected Ottawa’s neighbourhoods and residents.
  10. Building a map • We are building a map using

    Google My Maps – in Exercise #2 you will build a test Google map, too. • The key information we will need: – Tweets that include locations. – Tweets that include images that can be embedded in our map. – Who posted the tweet, and when. • Information we do not need: – RTs, or retweets. – Tweets posted by news organizations like CBC or 1310 News. – Tweets posted by other news reporters.
  11. Getting rid of RTs… • Highlight the entire data set,

    then select “Sort.” • By sorting Column B, you are grouping all the tweets that start with “RT.”
  12. Getting rid of RTs… • Highlight the entire data set,

    then select “Sort.” • By sorting Column B, you are grouping all the tweets that start with “RT.” • WARNING: If you do not select all columns, Column B will be sorted but nothing else on your spreadsheet will move. This will shuffle tweet texts from their authors and their time stamps, and mash up your information.
  13. Getting rid of RTs… • Highlight the entire data set,

    then select “Sort.” • By sorting Column B, you are grouping all the tweets that start with “RT.” • Highlight all the tweets that start with “RT” and delete them (on a PC, right-click and select Delete; you can also click the Delete button in the top right-hand corner and select “Delete Sheet Rows”).
  14. Are there easier ways to do this? • Under the

    data tab, try “Remove duplicates” and select Column B. • This will quickly get rid of identical tweets. • Unfortunately, (1) it doesn’t get rid of all RTs, so you will still have to sort Column B and (2) it does get rid of identical tweets that only include hashtags (for example, if someone posted a series of photos with the hashtags #ottflood #constancebay #2019).
  15. • Highlight the whole data set again, and sort Column

    A to find and delete other news organizations or reporters (i.e. @1310NEWS @CBCOttawa @weathernetwork).
  16. • Make the date and time of tweets two separate

    columns instead of one, by clicking on “Text to Columns.”
  17. • Make the date and time of tweets two separate

    columns instead of one, by clicking on “Text to Columns.” • Following the prompts, first select “Fixed Width” to describe the data in the date and time field. Then, you will create one column for the date of the tweet, and one for the time of the tweet. Use “at” to break up this information.
  18. • Make the date and time of tweets two separate

    columns instead of one, by clicking on “Text to Columns.” • Following the prompts, first select “Fixed Width” to describe the data in the date and time field. Then, you will create one column for the date of the tweet, and one for the time of the tweet. Use “at” to break up this information. • Delete the “at” column.
  19. • If you are using Google Sheets, this is even

    easier: Under the Data tab, choose “Split text to columns” • A small pop-up box will appear asking you to select a “Separator” • Choose “custom” from the drag-down menu and type “at”
  20. • As we get ready to use this spreadsheet to

    build a map, save it a second time, this time as, “ottfloodmap2019.” • In “ottfloodmap2019” we are going to further prepare this data to weed out tweets that don’t include locations or compelling images. • We will still need all the information in “ottflood2” for our other data visualizations.
  21. • In your newly saved “ottfloodmap2019” spreadsheet, scroll to the

    top and right-click on the first row, then click “Insert” to insert a header row at the top of your spreadsheet.
  22. • Scroll to the top of the spreadsheet, and right-click

    on the first row, then click “Insert” to insert a header row at the top of your spreadsheet. • Add headings for each column, including, in Column F, “Location.”
  23. • Scroll to the top of the spreadsheet, and right-click

    on the first row, then click “Insert” to insert a header row at the top of your spreadsheet. • Add headings for each column, including, in Column F, “Location.” • Freeze your headings, by clicking on the View tab >> Freeze Panes >> Freeze Top Row
  24. Building a map • We are building a map using

    Google My Maps – in Exercise #2 you will build a test Google map, too. • The key information we will need: – Tweets that include locations. – Tweets that include images that can be embedded in our map. – Who posted the tweet, and when. • Information we do not need: – RTs, or retweets. – Tweets posted by news organizations like CBC or 1310 News. – Tweets posted by other news reporters.
  25. Building a map • We are building a map using

    Google My Maps – in Exercise #2 you will build a test Google map, too. • The key information we will need: – Tweets that include locations. – Tweets that include images that can be embedded in our map.
  26. Tips for building a map • Our finished map will

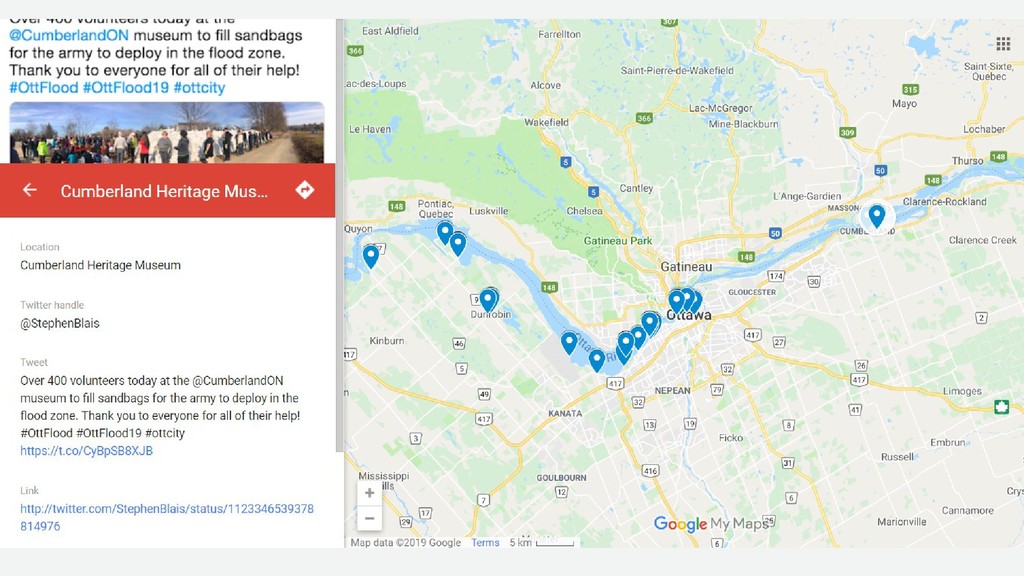
    include screenshots of individual tweets. – DO Google the images shared in individual tweets (if you are using Google Chrome, this is a right- click on the image); if they have appeared in media reports or have been widely reused by many people, exclude this tweet from the map. – DO consider the likelihood of an authentic image taken by a community member being taken from, for example, the sky – yes, people have drones, but if an image doesn’t seem likely to be original, don’t include it in your map, or do reach out to the author of the tweet to ask about the picture and if they can share others with you.
  27. Tips for building a map • Our finished map will

    include screenshots of individual tweets. – DO double-check images on Google Street View – can the same houses or buildings be seen standing beside each other at a particular location?
  28. Building a map • We are building a map using

    Google My Maps – in Exercise #2 you will build a test Google map, too. 1. Import your flood map spreadsheet as the first layer of the map. 2. Choose “Location” as the column for positioning and naming your placemarks.
  29. Building a map • We are building a map using

    Google My Maps – in Exercise #2 you will build a test Google map, too. 1. Import your flood map spreadsheet as the first layer of the map. 2. Choose “Location” as the column for positioning and naming your placemarks. 3. Open the data table to fix errors.
  30. Building a map • TIP: Search the unrecognized locations in

    Google, and use the location name that the search engine returns.
  31. Building a map • TIP: Once you have finished clarifying

    locations in the spreadsheet, pull back to ensure the placemarks are in the right part of the world.
  32. Building a map 4. Add a title and description of

    the map. 5. Add images to each placemark by clicking the camera icon in the bottom right-hand corner of the placemark info box.
  33. Building a map 4. Add a title and description of

    the map. 5. Add images to each placemaker by clicking the camera icon in the bottom right-hand corner of the placemark info box.
  34. 6. When your map is complete, click “Share” and make

    it public online. 7. To embed your map on a website, click on the top-right menu (the three vertical dots beside the title of your map) and select “Embed on my site.” In WordPress, add a “Custom HTML” block and copy and paste the embed code.
  35. Where we are in data visualization  How to clean

    up a spreadsheet and make it more legible.  How to build a Google My Map using a spreadsheet.  How to clean up, share and embed a Google My Map.
  36. Based on this data… • We are going to create

    three different data visualizations:  A map 2. A word cloud 3. A graph showing how #ottflood was used