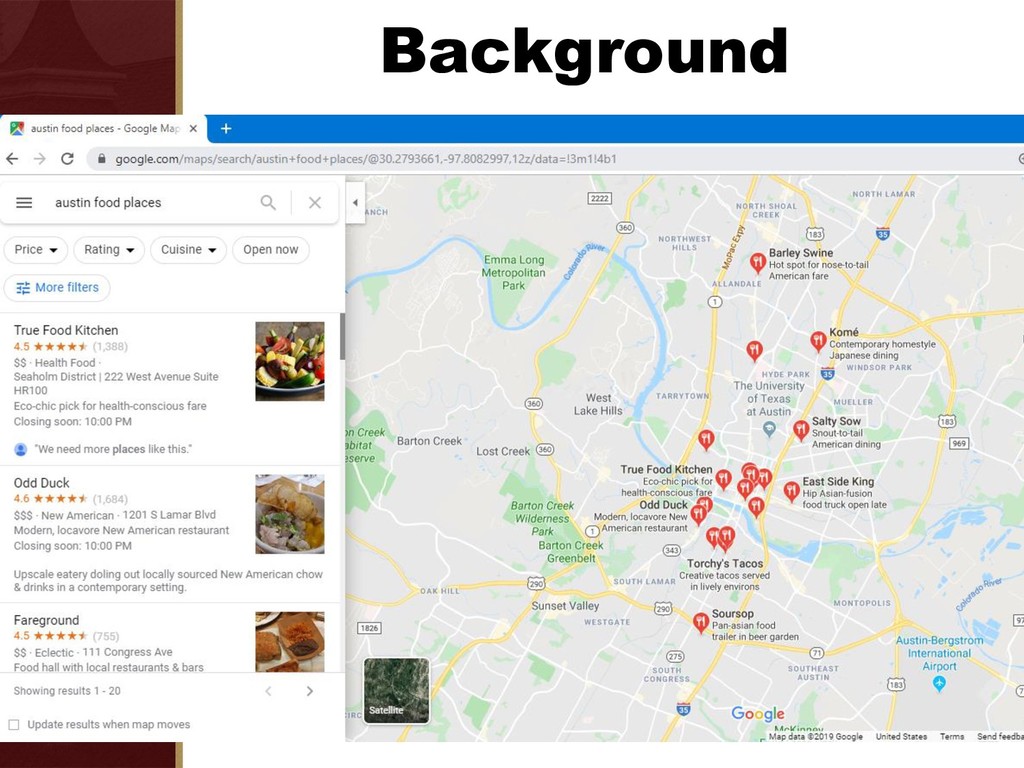
good hygiene is a critical public health issue. ❖Consumers generally rely on local government to regulate and inspect food establishments. ❖Yet, the public is largely ignorant about the inspection results of local food establishments. (Jin and Leslie 2005; Onyeneho and Hedberg, 2013; Liu and Lee, 2018)
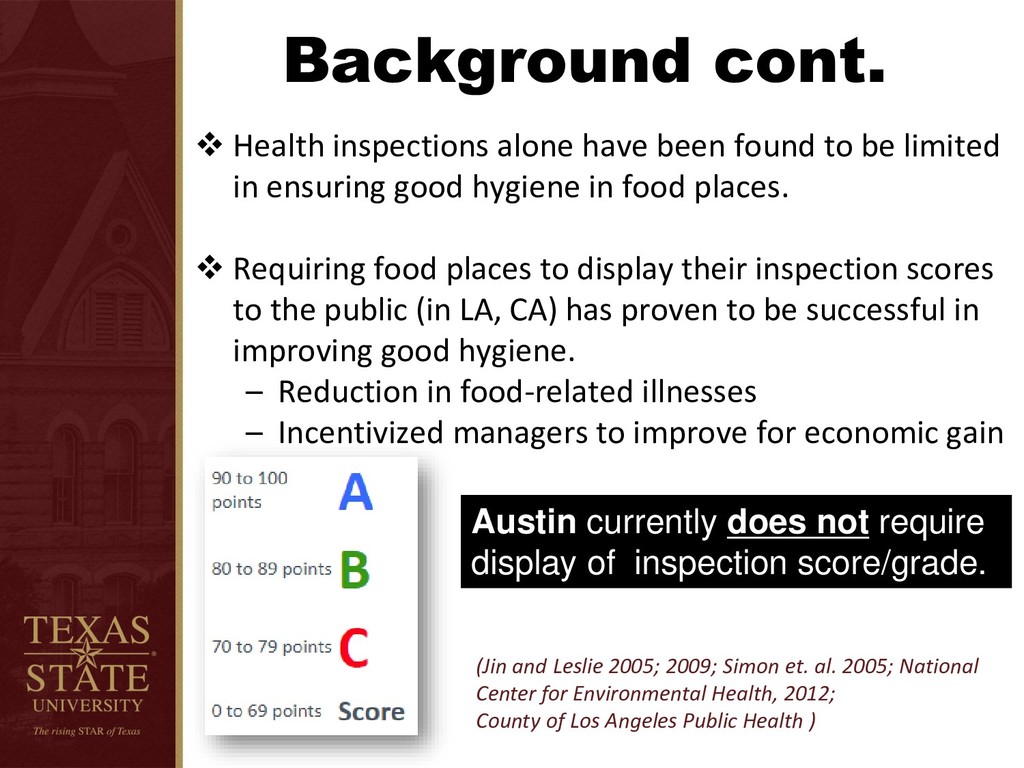
be limited in ensuring good hygiene in food places. ❖ Requiring food places to display their inspection scores to the public (in LA, CA) has proven to be successful in improving good hygiene. – Reduction in food-related illnesses – Incentivized managers to improve for economic gain (Jin and Leslie 2005; 2009; Simon et. al. 2005; National Center for Environmental Health, 2012; County of Los Angeles Public Health ) Austin currently does not require display of inspection score/grade.
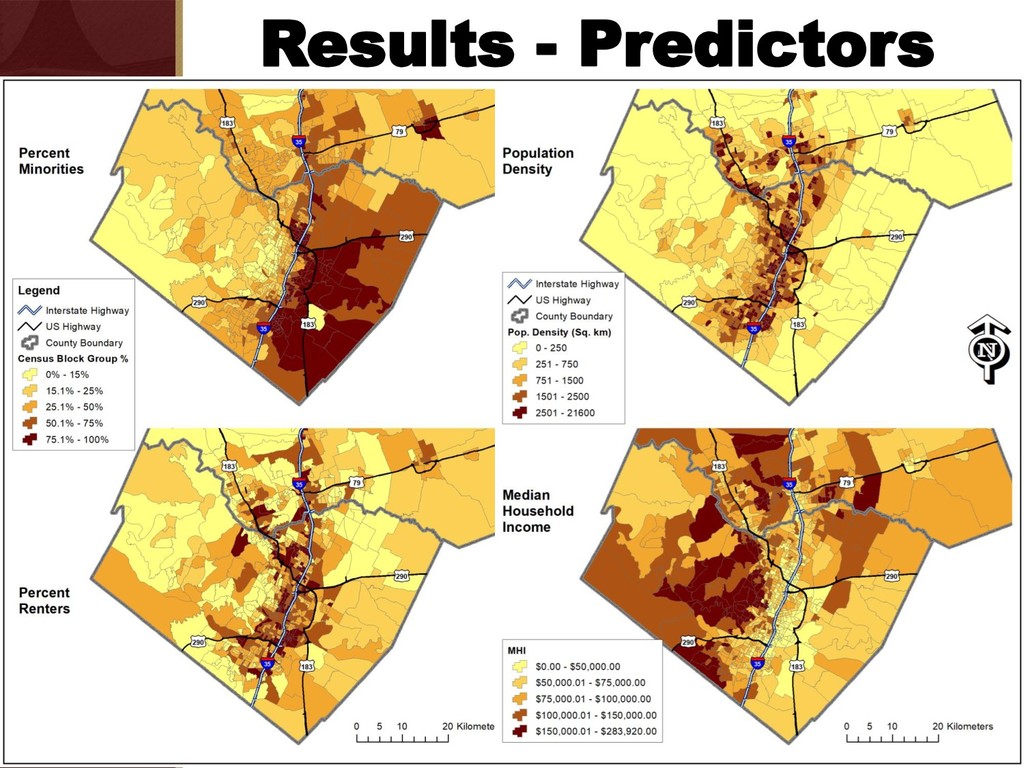
❖ Lack of/poor equipment and resources and managerial failings are known to be main causes of poor scorings of food places. ❖ What about external factors; the socio- demographic and economic environment in which the establishment is located? (National Center for Environmental Health, 2012; County of Los Angeles Public Health )
patterns of food establishment inspection scores; do they cluster or not? 2. What factors significantly explain the observed inspection scores of food establishments within Austin, TX?
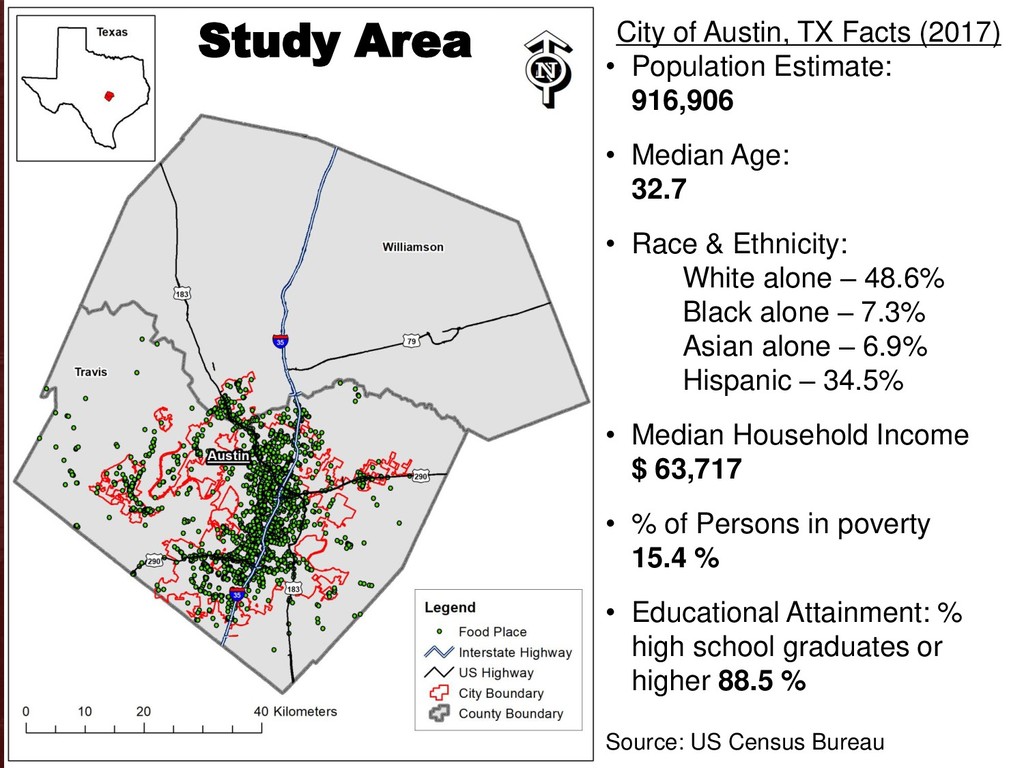
• Median Age: 32.7 • Race & Ethnicity: White alone – 48.6% Black alone – 7.3% Asian alone – 6.9% Hispanic – 34.5% • Median Household Income $ 63,717 • % of Persons in poverty 15.4 % • Educational Attainment: % high school graduates or higher 88.5 % Source: US Census Bureau Study Area
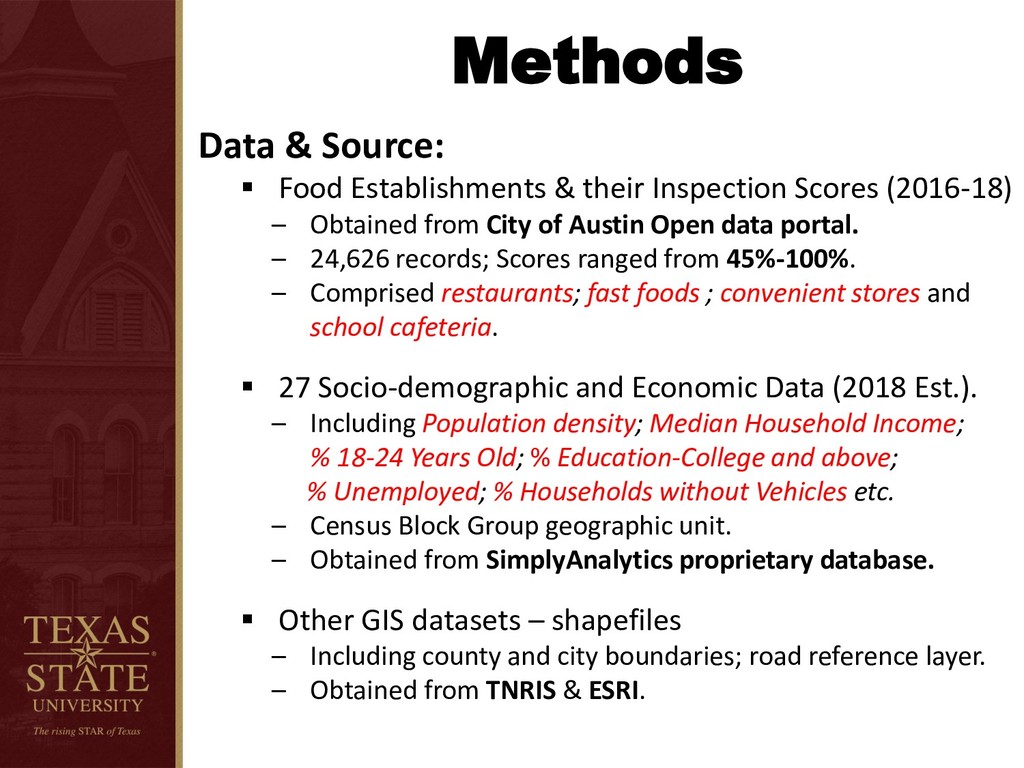
Scores (2016-18) – Obtained from City of Austin Open data portal. – 24,626 records; Scores ranged from 45%-100%. – Comprised restaurants; fast foods ; convenient stores and school cafeteria. ▪ 27 Socio-demographic and Economic Data (2018 Est.). – Including Population density; Median Household Income; % 18-24 Years Old; % Education-College and above; % Unemployed; % Households without Vehicles etc. – Census Block Group geographic unit. – Obtained from SimplyAnalytics proprietary database. ▪ Other GIS datasets – shapefiles – Including county and city boundaries; road reference layer. – Obtained from TNRIS & ESRI.
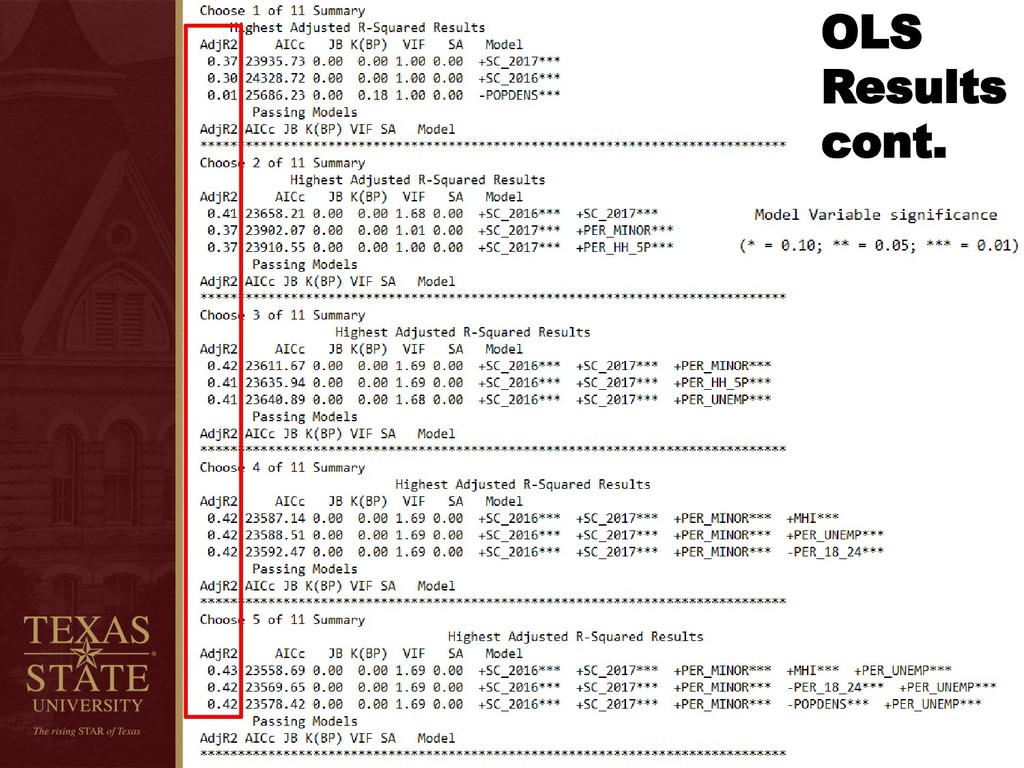
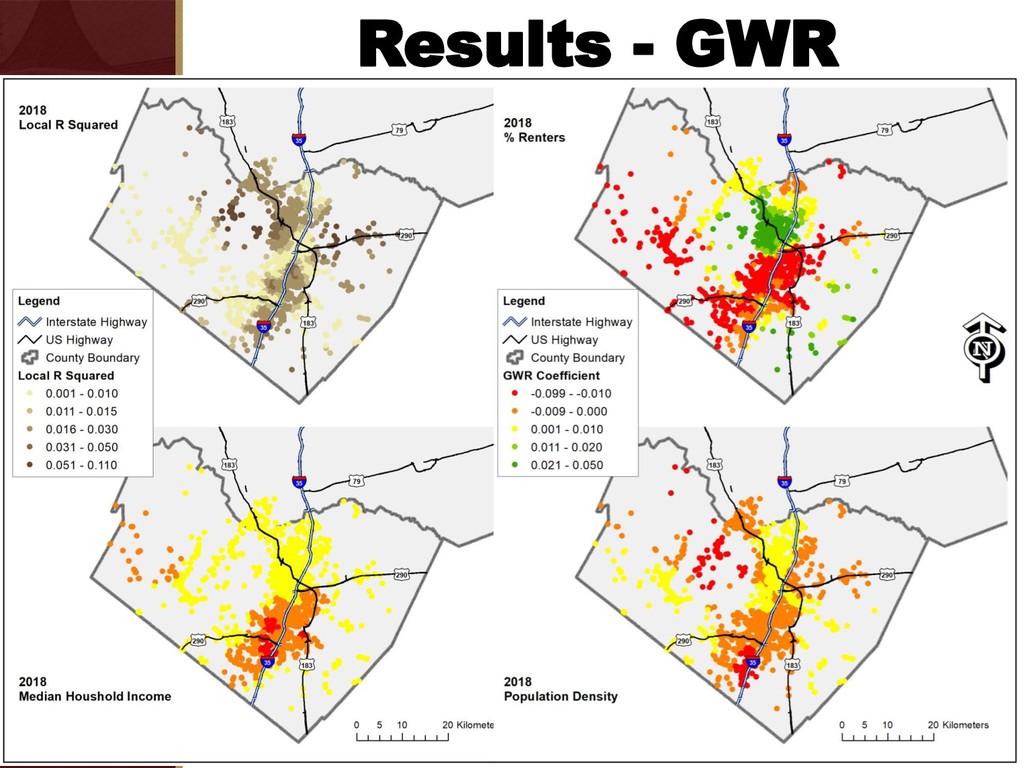
Removed incomplete data and duplicates (4,103 unique & completed records remained; Scores ranged from 70 to 100). ▪ Kernel Density (per square kilometer). ▪ Optimized Hot Spot Analysis (evaluates data to derive the optimal parameters) ▪ Exploratory Regression (evaluates all possible combinations of input explanatory variables to formulate the best OLS models that best explain the dependent variable within the context of user-specified criteria). ▪ Geographic Weighted Regression.
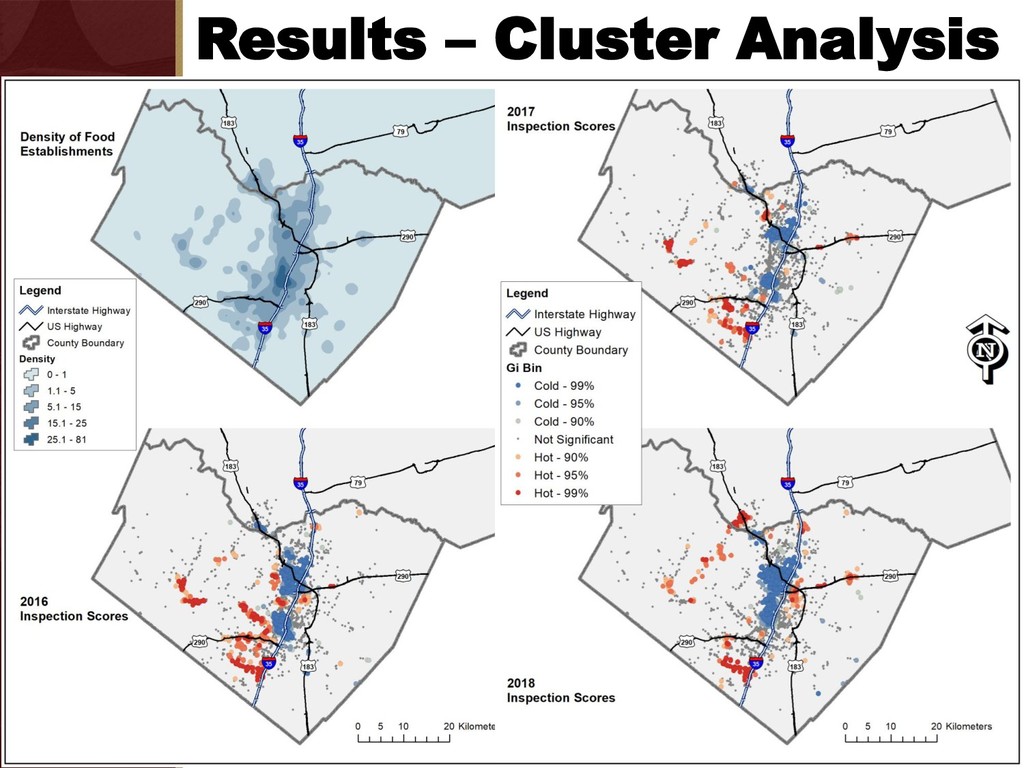
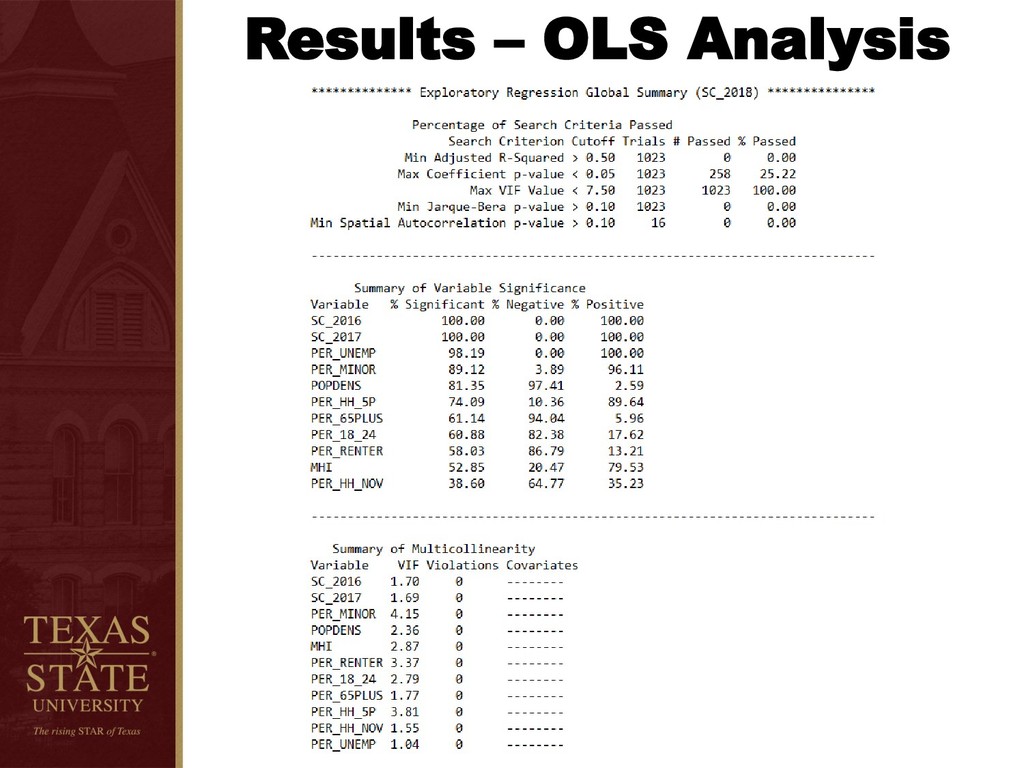
Significant Clustering of scores found: ❖ Cold spots () mainly in the downtown area. ❖ Hotspots () mainly in the urban fringes. ❖ Overall, weak prediction (≤ 11%) from Socio- demographic and economic data included. ❖ Evidence of Regional variation in prediction among the variables particularly % Renters. ❖ In OLS though, stronger prediction (42%) from previous years’ scores; a tendency that poor performance repeats itself.
in Austin, TX area. ❖ Search engines and apps to include H. Inspection Scores. ❖ Retest with latest data; Explore for other factors. ❖ Test first inspection scores scenario. ❖ Socio-demographic and economic data are projected data (estimates) thus, could alter reality. Recommendations & Limitations