Share
Embed
Logs & metrics: use the force, gain the insight - FIL2014
Centralized logging & metrics talk at Future Insights Live Las Vegas 2014

Thijs Feryn PRO
June 18, 2014
Transcript
118 slides
-
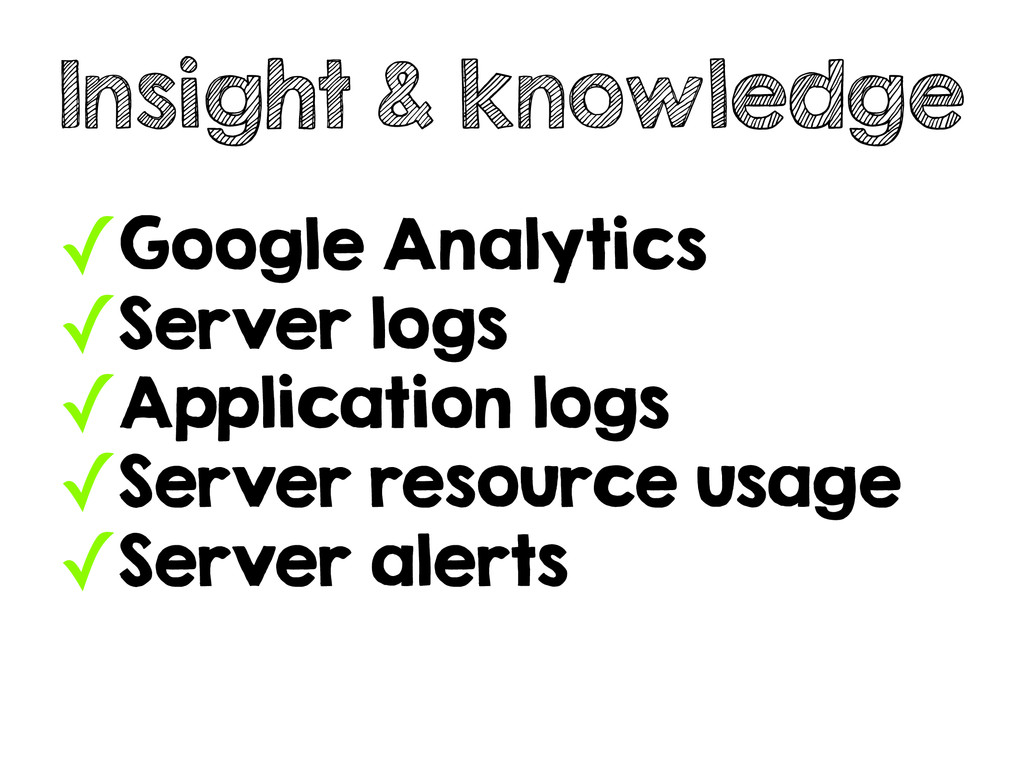
Insight & knowledge ✓Google Analytics ✓Server logs ✓Application logs ✓Server
resource usage ✓Server alerts -
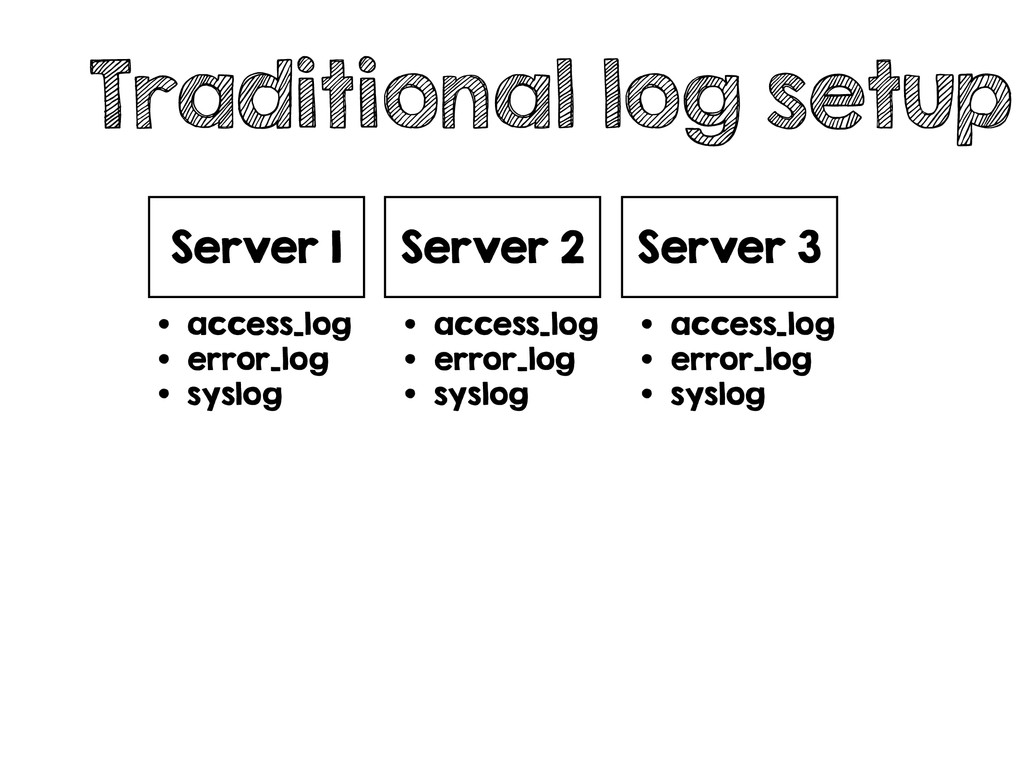
Traditional log setup Server 1 Server 2 Server 3 •
access_log • error_log • syslog • access_log • error_log • syslog • access_log • error_log • syslog -
Search? ✓Grep ✓Separate search on each machine ✓No graphing ✓Resource
intensive on large files -
syslog-ng? ✓Still grep ✓All logs are centrally stored ✓Still separate
files per server per date ✓Still no graphing ✓Still resource intensive on large files -
What do we need? ✓Single storage point ✓Search all data
at once ✓Fast & scalable search ✓Filter data ✓Convert logs into usable data ✓Visualize data -
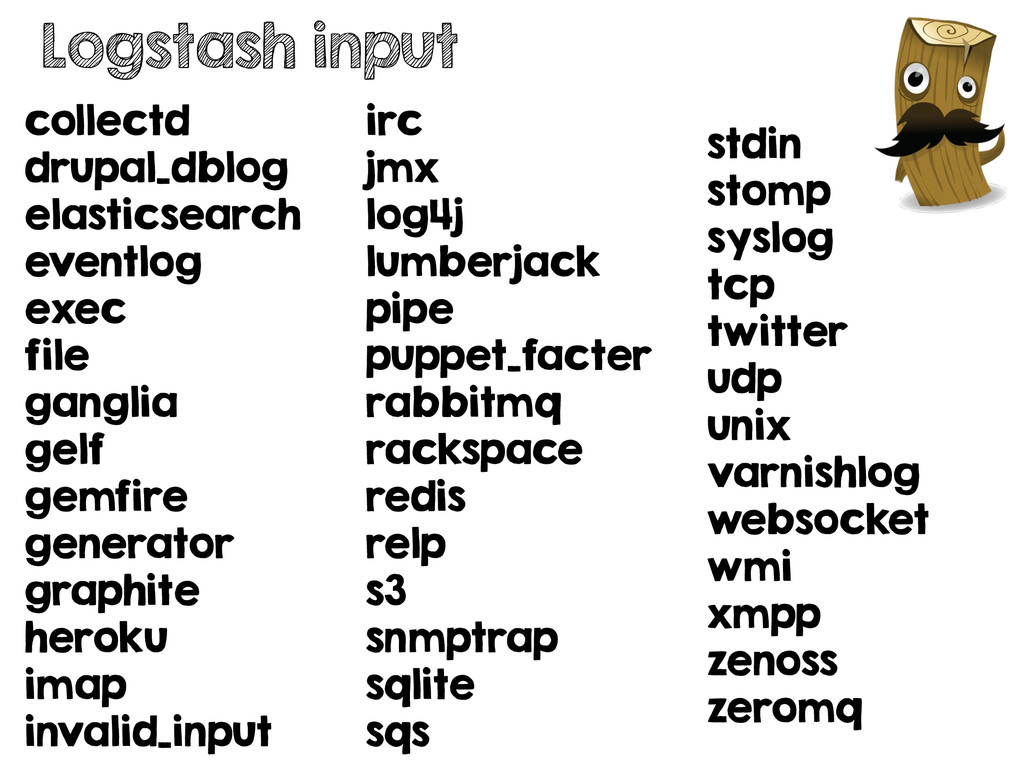
collectd drupal_dblog elasticsearch eventlog exec file ganglia gelf gemfire generator
graphite heroku imap invalid_input irc jmx log4j lumberjack pipe puppet_facter rabbitmq rackspace redis relp s3 snmptrap sqlite sqs stdin stomp syslog tcp twitter udp unix varnishlog websocket wmi xmpp zenoss zeromq Logstash input -
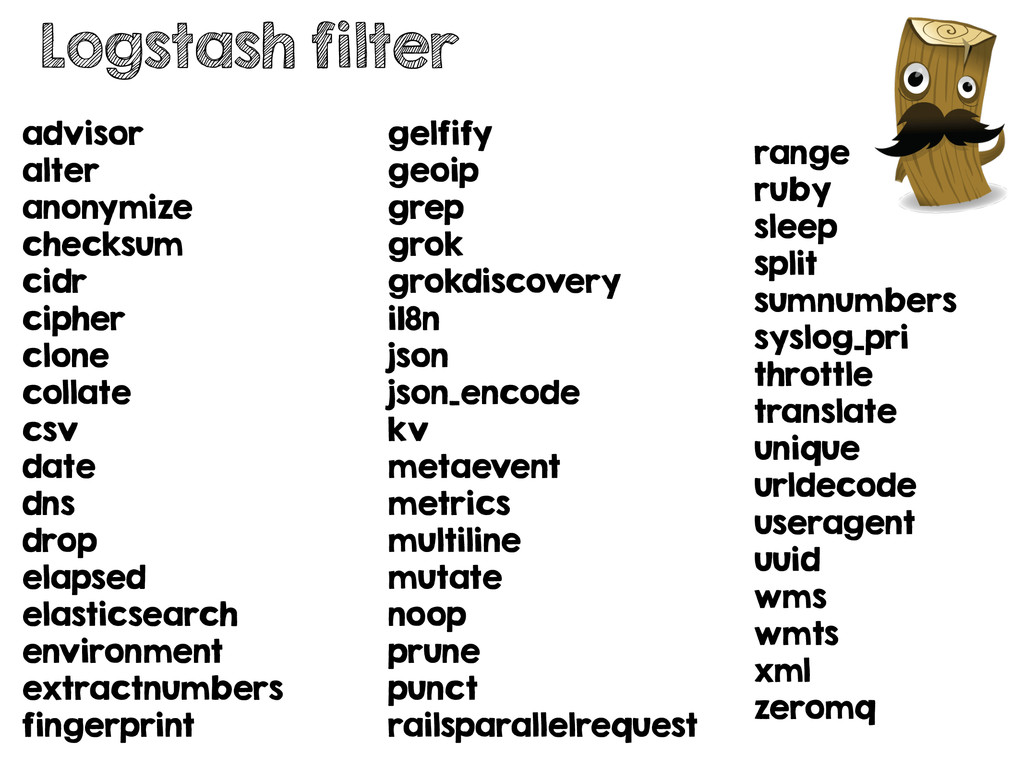
advisor alter anonymize checksum cidr cipher clone collate csv date
dns drop elapsed elasticsearch environment extractnumbers fingerprint gelfify geoip grep grok grokdiscovery i18n json json_encode kv metaevent metrics multiline mutate noop prune punct railsparallelrequest range ruby sleep split sumnumbers syslog_pri throttle translate unique urldecode useragent uuid wms wmts xml zeromq Logstash filter -
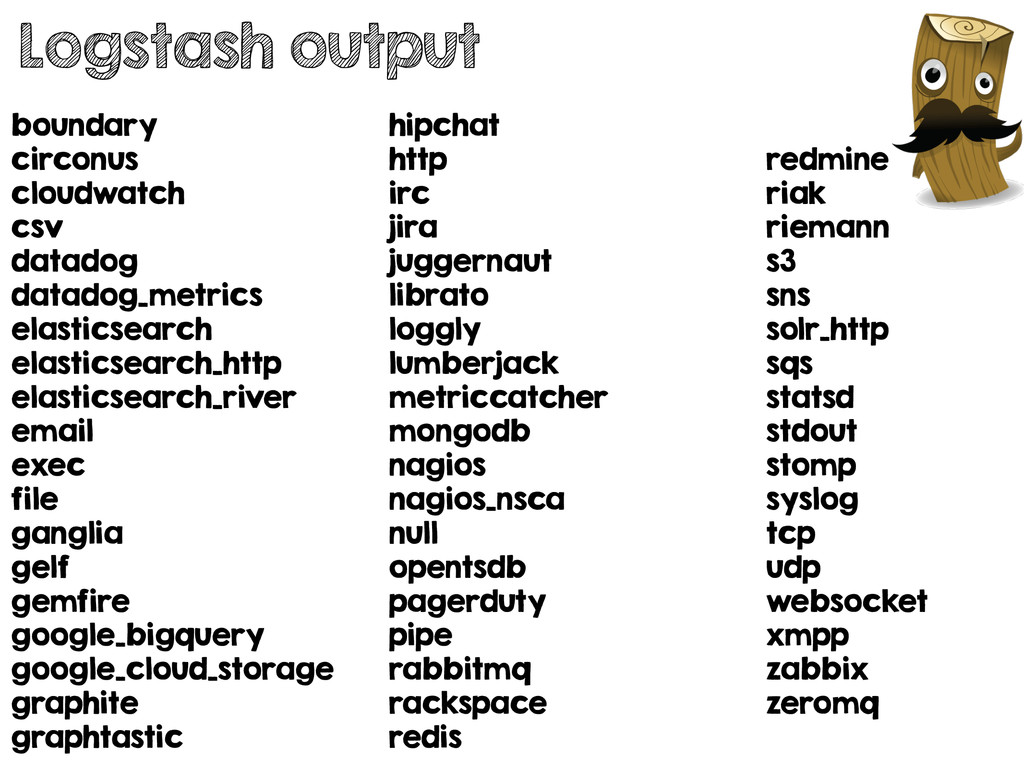
boundary circonus cloudwatch csv datadog datadog_metrics elasticsearch elasticsearch_http elasticsearch_river email
exec file ganglia gelf gemfire google_bigquery google_cloud_storage graphite graphtastic hipchat http irc jira juggernaut librato loggly lumberjack metriccatcher mongodb nagios nagios_nsca null opentsdb pagerduty pipe rabbitmq rackspace redis redmine riak riemann s3 sns solr_http sqs statsd stdout stomp syslog tcp udp websocket xmpp zabbix zeromq Logstash output -
217.21.177.69 -‐ -‐ [03/Jun/2014:12:37:52 +0000] "GET / HTTP/1.1" 200
483 "-‐" "Mozilla/5.0 (Macintosh; Intel Mac OS X 10.9; rv:29.0) Gecko/20100101 Firefox/29.0" /var/log/apache2/ access.log -
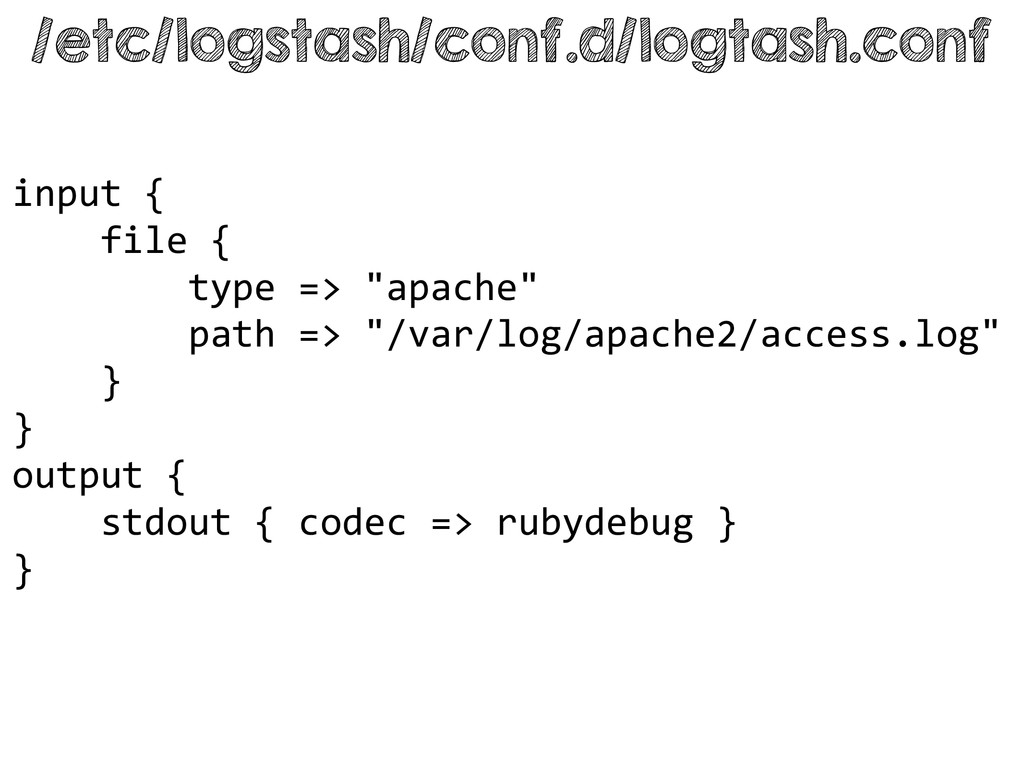
input { file {
type => "apache" path => "/var/log/apache2/access.log" } } output { stdout { codec => rubydebug } } /etc/logstash/conf.d/logtash.conf -
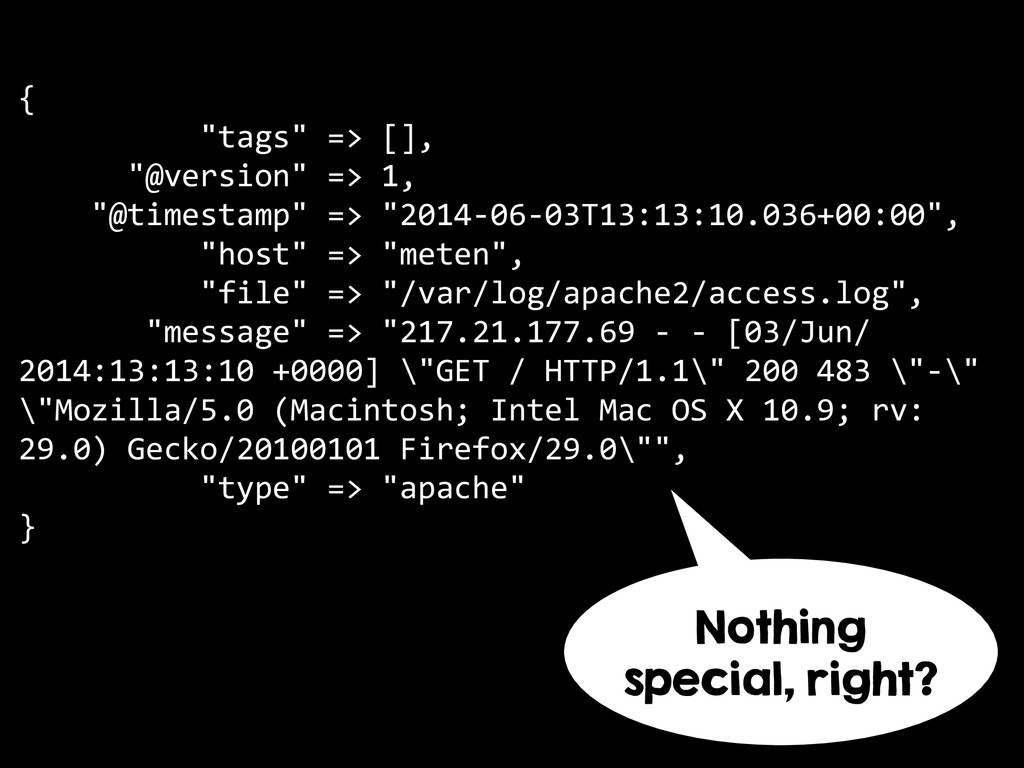
{
"tags" => [], "@version" => 1, "@timestamp" => "2014-‐06-‐03T13:13:10.036+00:00", "host" => "meten", "file" => "/var/log/apache2/access.log", "message" => "217.21.177.69 -‐ -‐ [03/Jun/ 2014:13:13:10 +0000] \"GET / HTTP/1.1\" 200 483 \"-‐\" \"Mozilla/5.0 (Macintosh; Intel Mac OS X 10.9; rv: 29.0) Gecko/20100101 Firefox/29.0\"", "type" => "apache" } Nothing special, right? -
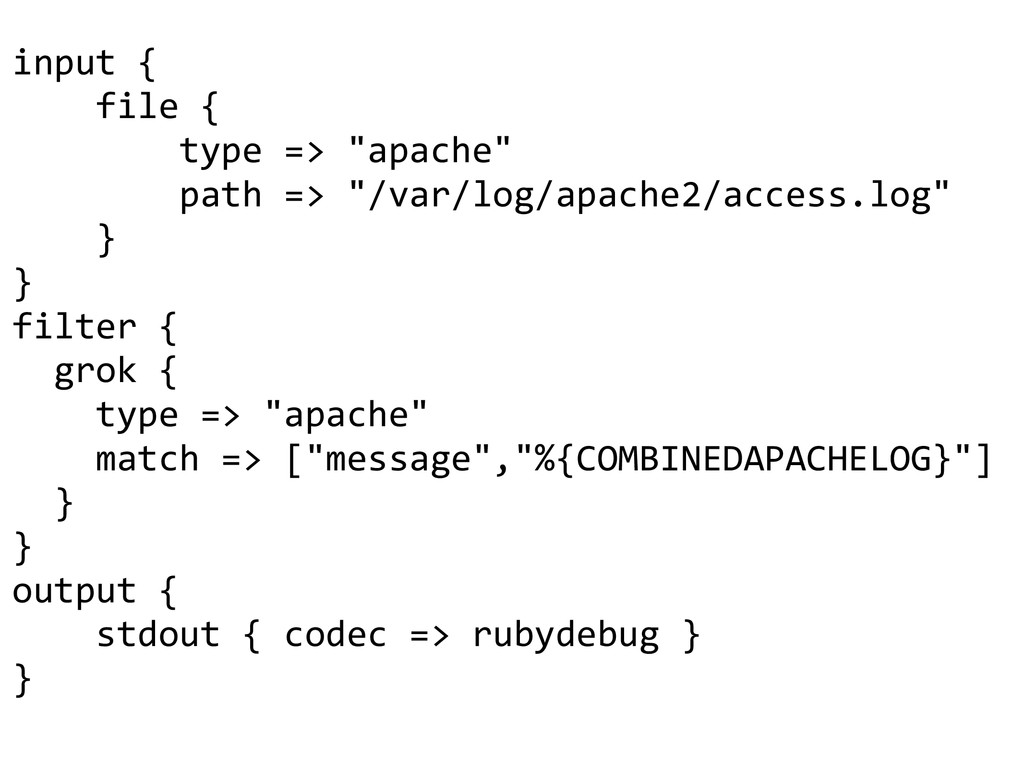
input { file {
type => "apache" path => "/var/log/apache2/access.log" } } filter { grok { type => "apache" match => ["message","%{COMBINEDAPACHELOG}"] } } output { stdout { codec => rubydebug } } -
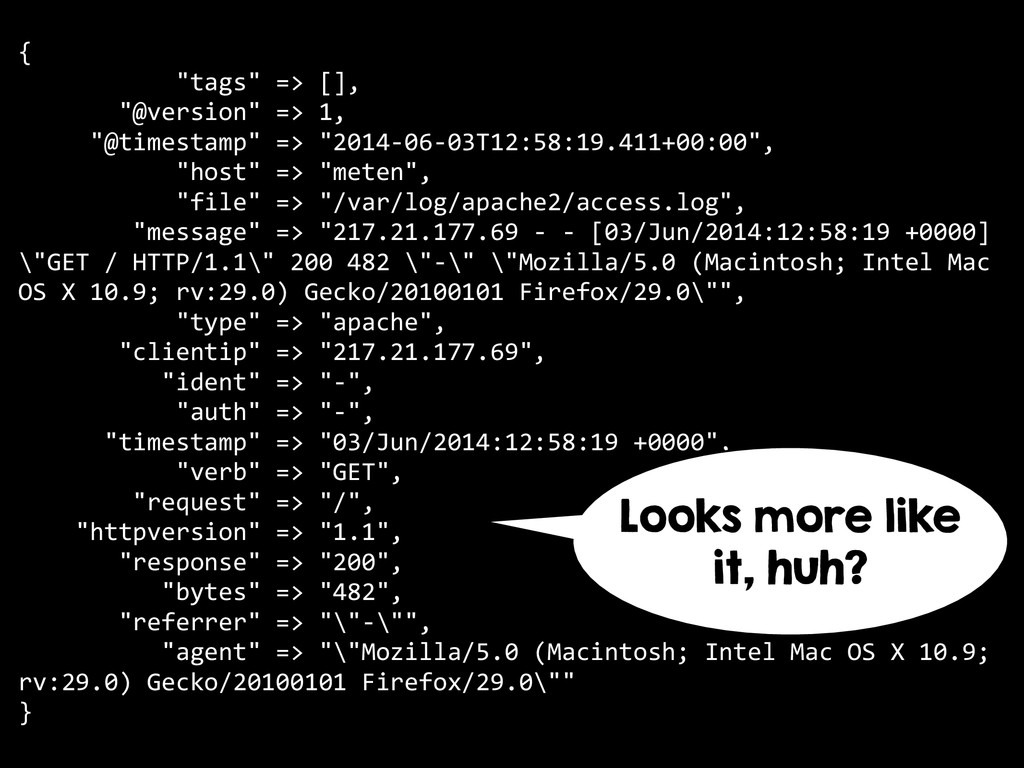
{
"tags" => [], "@version" => 1, "@timestamp" => "2014-‐06-‐03T12:58:19.411+00:00", "host" => "meten", "file" => "/var/log/apache2/access.log", "message" => "217.21.177.69 -‐ -‐ [03/Jun/2014:12:58:19 +0000] \"GET / HTTP/1.1\" 200 482 \"-‐\" \"Mozilla/5.0 (Macintosh; Intel Mac OS X 10.9; rv:29.0) Gecko/20100101 Firefox/29.0\"", "type" => "apache", "clientip" => "217.21.177.69", "ident" => "-‐", "auth" => "-‐", "timestamp" => "03/Jun/2014:12:58:19 +0000", "verb" => "GET", "request" => "/", "httpversion" => "1.1", "response" => "200", "bytes" => "482", "referrer" => "\"-‐\"", "agent" => "\"Mozilla/5.0 (Macintosh; Intel Mac OS X 10.9; rv:29.0) Gecko/20100101 Firefox/29.0\"" } Looks more like it, huh? -
input { file {
type => "apache" path => "/var/log/apache2/access.log" } } filter { grok { type => "apache" match => ["message","%{COMBINEDAPACHELOG}"] } } output { stdout { codec => rubydebug } } What’s this GROK thing? -
Grok is currently the best way in logstash to parse
crappy unstructured log data into something structured and queryable. This tool is perfect for syslog logs, apache and other webserver logs, mysql logs, and in general, any log format that is generally written for humans and not computer consumption. Logstash ships with about 120 patterns by default. You can find them here: https:// github.com/logstash/logstash/tree/v1.4.1/ patterns. You can add your own trivially. (See the patterns_dir setting) If you need help building patterns to match your logs, you will find the http:// grokdebug.herokuapp.com too quite useful! -
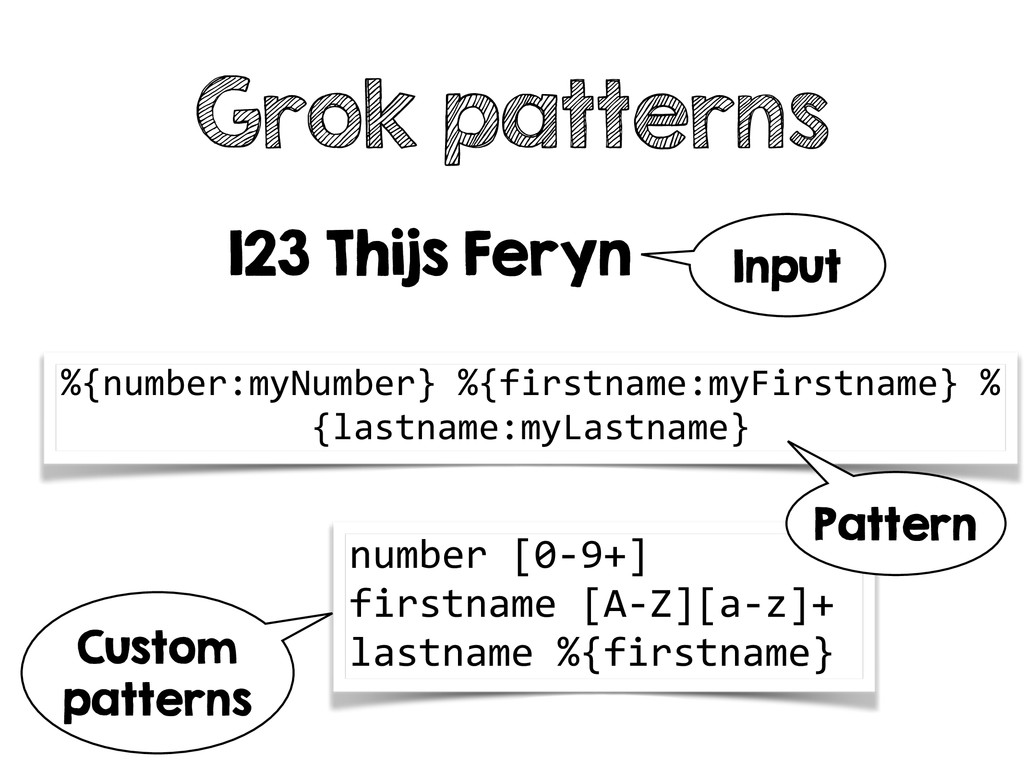
Grok patterns 123 Thijs Feryn %{number:myNumber} %{firstname:myFirstname} % {lastname:myLastname} number
[0-‐9+] firstname [A-‐Z][a-‐z]+ lastname %{firstname} Input Pattern Custom patterns -
{ "myNumber": [ [
"3" ] ], "myFirstname": [ [ "Thijs" ] ], "myLastname": [ [ "Feryn" ] ], "firstname": [ [ "Feryn" ] ] } Grok patterns Result -
SYSLOGTIMESTAMP %{MONTH} +%{MONTHDAY} %{TIME} PROG (?:[\w._/%-‐]+) SYSLOGPROG %{PROG:program}(?:\[%{POSINT:pid}\])?
SYSLOGHOST %{IPORHOST} SYSLOGFACILITY <%{NONNEGINT:facility}.%{NONNEGINT:priority} > HTTPDATE %{MONTHDAY}/%{MONTH}/%{YEAR}:%{TIME} %{INT} ! ! QS %{QUOTEDSTRING} ! SYSLOGBASE %{SYSLOGTIMESTAMP:timestamp} (?:% {SYSLOGFACILITY} )?%{SYSLOGHOST:logsource} %{SYSLOGPROG}: COMMONAPACHELOG %{IPORHOST:clientip} %{USER:ident} % {USER:auth} \[%{HTTPDATE:timestamp}\] "(?:%{WORD:verb} % {NOTSPACE:request}(?: HTTP/%{NUMBER:httpversion})?|% {DATA:rawrequest})" %{NUMBER:response} (?:% {NUMBER:bytes}|-‐) COMBINEDAPACHELOG %{COMMONAPACHELOG} %{QS:referrer} % {QS:agent} -
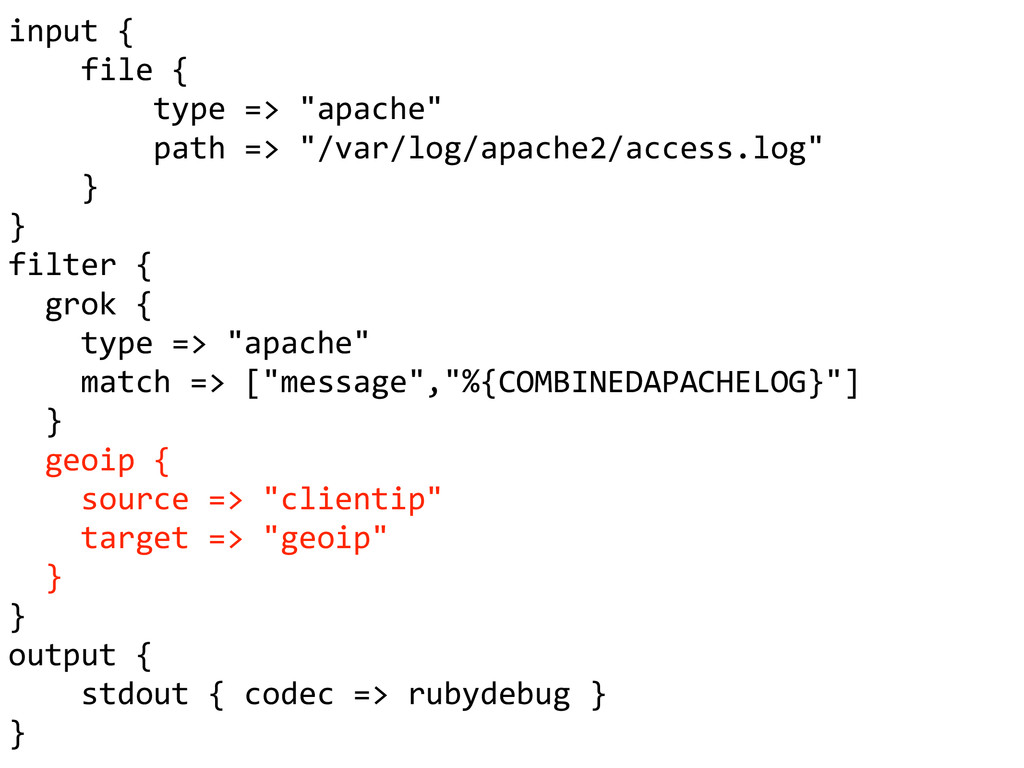
input { file {
type => "apache" path => "/var/log/apache2/access.log" } } filter { grok { type => "apache" match => ["message","%{COMBINEDAPACHELOG}"] } geoip { source => "clientip" target => "geoip" } } output { stdout { codec => rubydebug } } -
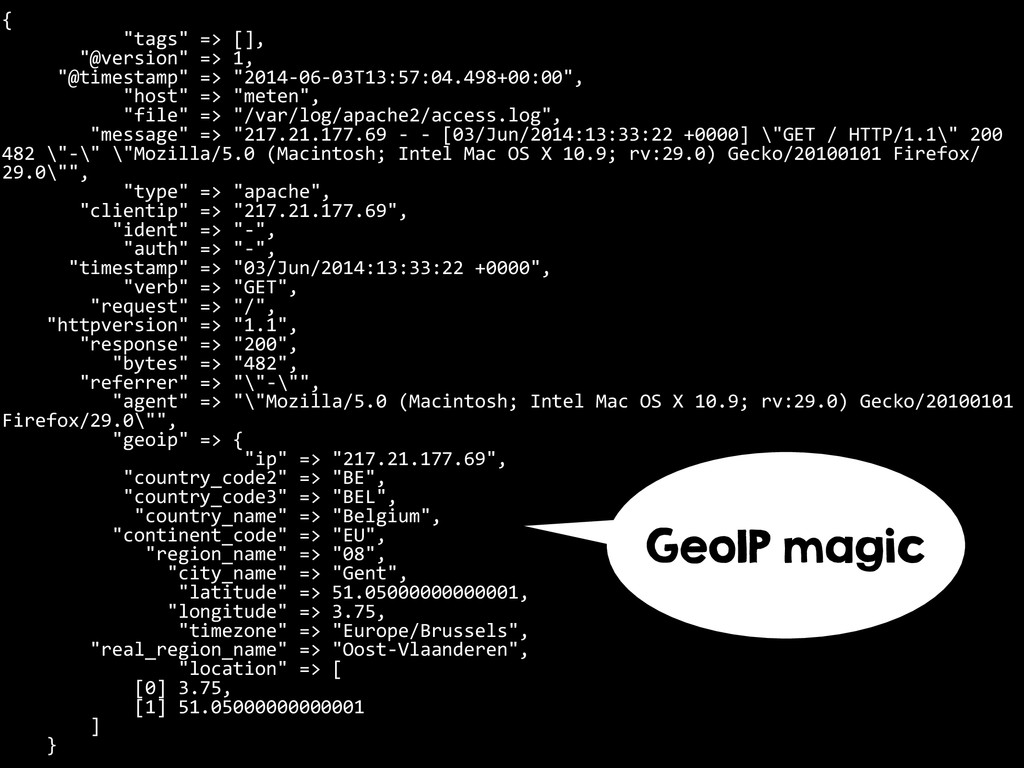
{
"tags" => [], "@version" => 1, "@timestamp" => "2014-‐06-‐03T13:57:04.498+00:00", "host" => "meten", "file" => "/var/log/apache2/access.log", "message" => "217.21.177.69 -‐ -‐ [03/Jun/2014:13:33:22 +0000] \"GET / HTTP/1.1\" 200 482 \"-‐\" \"Mozilla/5.0 (Macintosh; Intel Mac OS X 10.9; rv:29.0) Gecko/20100101 Firefox/ 29.0\"", "type" => "apache", "clientip" => "217.21.177.69", "ident" => "-‐", "auth" => "-‐", "timestamp" => "03/Jun/2014:13:33:22 +0000", "verb" => "GET", "request" => "/", "httpversion" => "1.1", "response" => "200", "bytes" => "482", "referrer" => "\"-‐\"", "agent" => "\"Mozilla/5.0 (Macintosh; Intel Mac OS X 10.9; rv:29.0) Gecko/20100101 Firefox/29.0\"", "geoip" => { "ip" => "217.21.177.69", "country_code2" => "BE", "country_code3" => "BEL", "country_name" => "Belgium", "continent_code" => "EU", "region_name" => "08", "city_name" => "Gent", "latitude" => 51.05000000000001, "longitude" => 3.75, "timezone" => "Europe/Brussels", "real_region_name" => "Oost-‐Vlaanderen", "location" => [ [0] 3.75, [1] 51.05000000000001 ] } GeoIP magic -
"geoip" =>
{ "ip" => "217.21.177.69", "country_code2" => "BE", "country_code3" => "BEL", "country_name" => "Belgium", "continent_code" => "EU", "region_name" => "08", "city_name" => "Gent", "latitude" => 51.05000000000001, "longitude" => 3.75, "timezone" => "Europe/Brussels", "real_region_name" => "Oost-‐Vlaanderen", "location" => [ [0] 3.75, [1] 51.05000000000001 ] } -
Elasticsearch is a flexible and powerful open source, distributed, real-time
search and analytics engine. Architected from the ground up for use in distributed environments where reliability and scalability are must haves, Elasticsearch gives you the ability to move easily beyond simple full-text search. Through its robust set of APIs and query DSLs, plus clients for the most popular programming languages, Elasticsearch delivers on the near limitless promises of search technology -
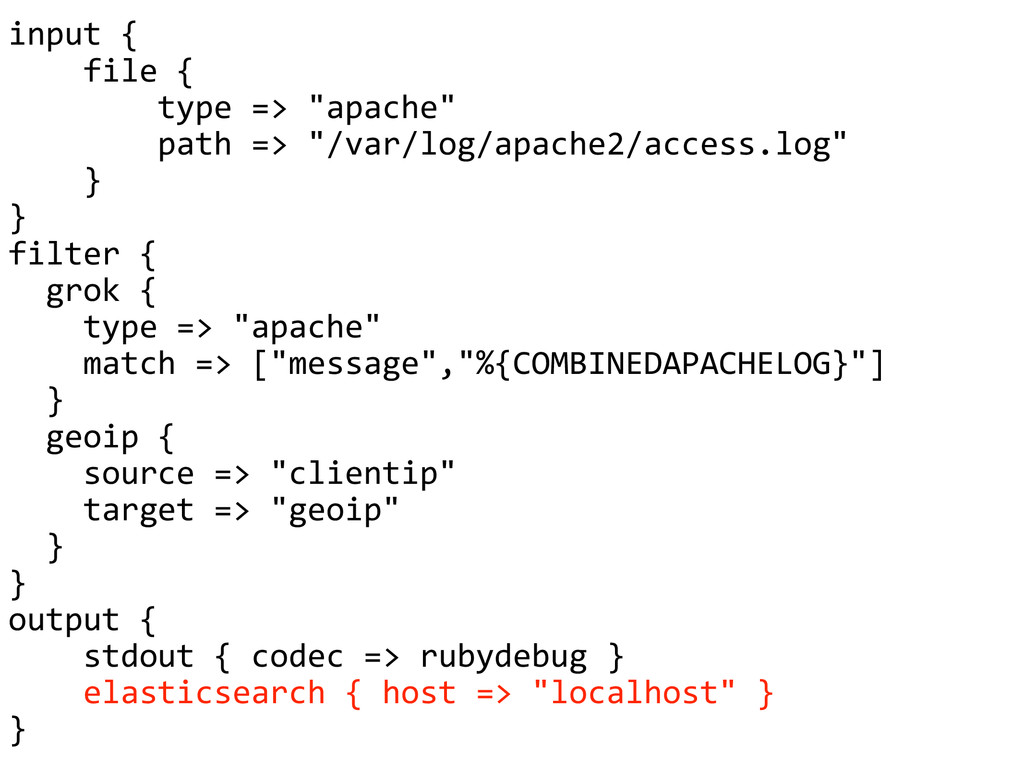
input { file {
type => "apache" path => "/var/log/apache2/access.log" } } filter { grok { type => "apache" match => ["message","%{COMBINEDAPACHELOG}"] } geoip { source => "clientip" target => "geoip" } } output { stdout { codec => rubydebug } elasticsearch { host => "localhost" } } -
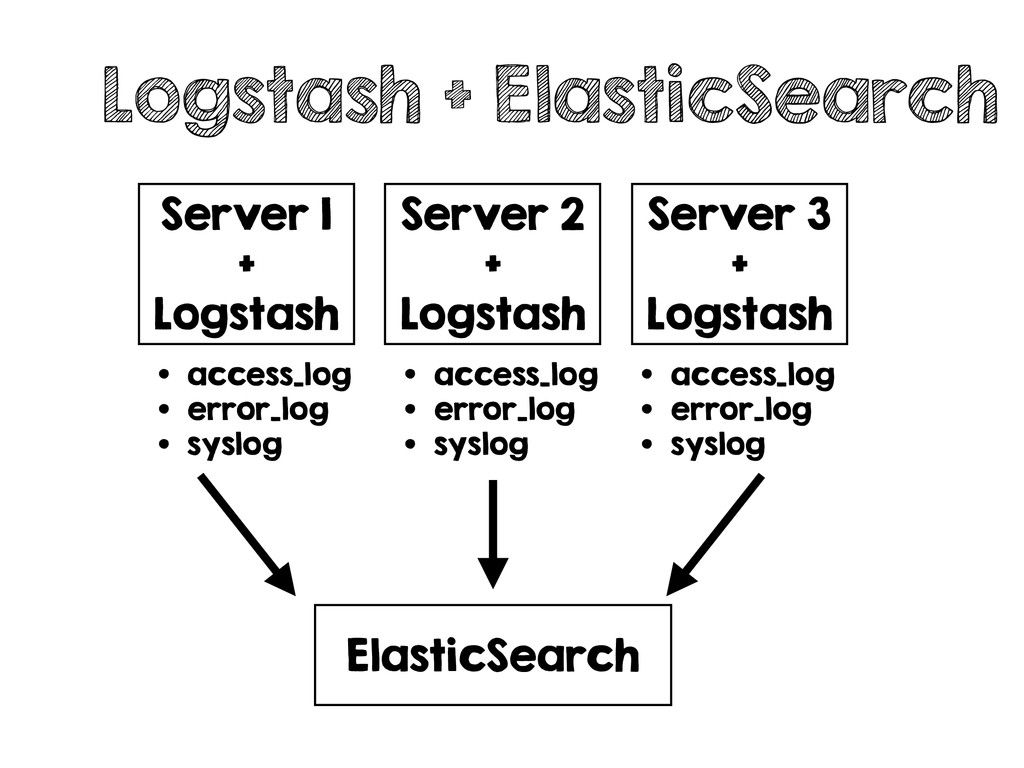
Logstash + ElasticSearch • access_log • error_log • syslog •
access_log • error_log • syslog • access_log • error_log • syslog ElasticSearch Server 2 + Logstash Server 1 + Logstash Server 3 + Logstash -
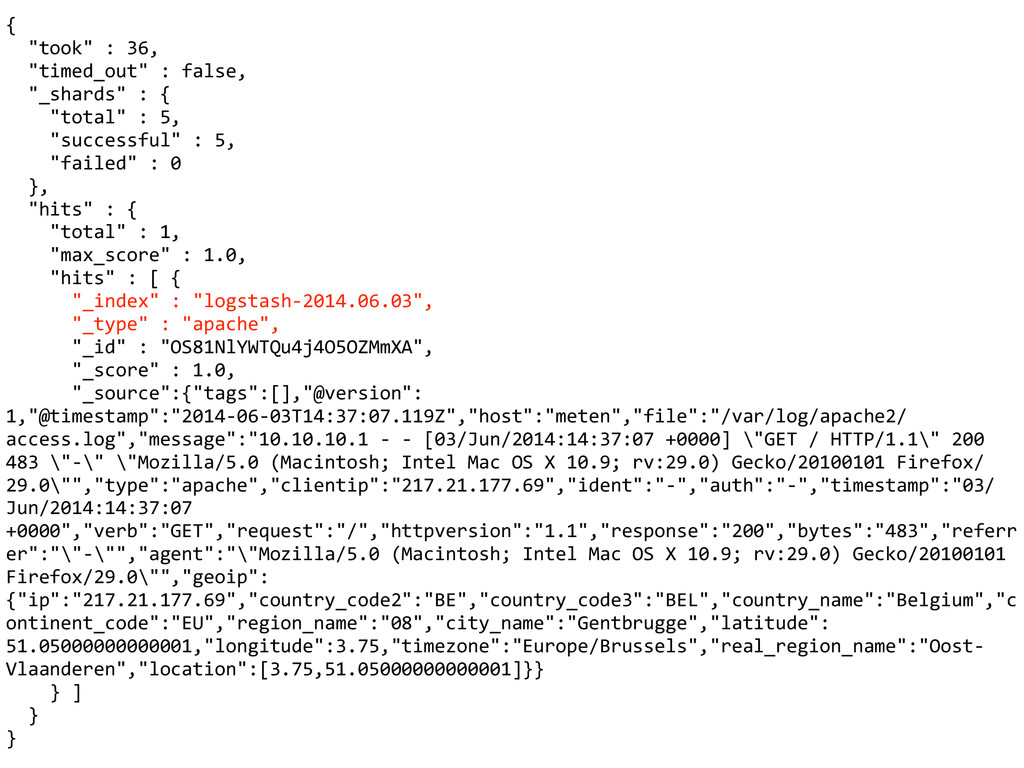
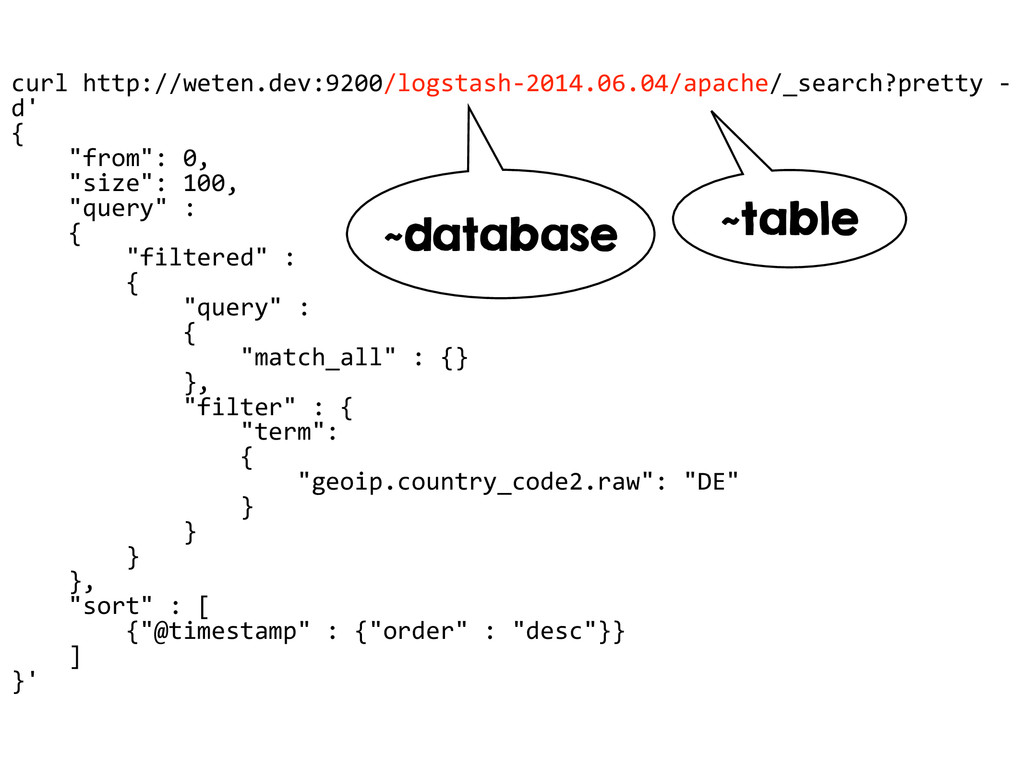
Logstash ElasticSearch glossary ✓Database is called an „index” ✓Table is
called a „type” ✓Row is called a „document” ✓Schema-less (sort of), but Logstash applies its own custom schema ✓Logstash creates a daily index ✓Input types are stored in ElasticSearch types ✓Each log is a document of a certain type in the index of that day. -
{ "took" : 36, "timed_out" :
false, "_shards" : { "total" : 5, "successful" : 5, "failed" : 0 }, "hits" : { "total" : 1, "max_score" : 1.0, "hits" : [ { "_index" : "logstash-‐2014.06.03", "_type" : "apache", "_id" : "OS81NlYWTQu4j4O5OZMmXA", "_score" : 1.0, "_source":{"tags":[],"@version": 1,"@timestamp":"2014-‐06-‐03T14:37:07.119Z","host":"meten","file":"/var/log/apache2/ access.log","message":"10.10.10.1 -‐ -‐ [03/Jun/2014:14:37:07 +0000] \"GET / HTTP/1.1\" 200 483 \"-‐\" \"Mozilla/5.0 (Macintosh; Intel Mac OS X 10.9; rv:29.0) Gecko/20100101 Firefox/ 29.0\"","type":"apache","clientip":"217.21.177.69","ident":"-‐","auth":"-‐","timestamp":"03/ Jun/2014:14:37:07 +0000","verb":"GET","request":"/","httpversion":"1.1","response":"200","bytes":"483","referr er":"\"-‐\"","agent":"\"Mozilla/5.0 (Macintosh; Intel Mac OS X 10.9; rv:29.0) Gecko/20100101 Firefox/29.0\"","geoip": {"ip":"217.21.177.69","country_code2":"BE","country_code3":"BEL","country_name":"Belgium","c ontinent_code":"EU","region_name":"08","city_name":"Gentbrugge","latitude": 51.05000000000001,"longitude":3.75,"timezone":"Europe/Brussels","real_region_name":"Oost-‐ Vlaanderen","location":[3.75,51.05000000000001]}} } ] } } -
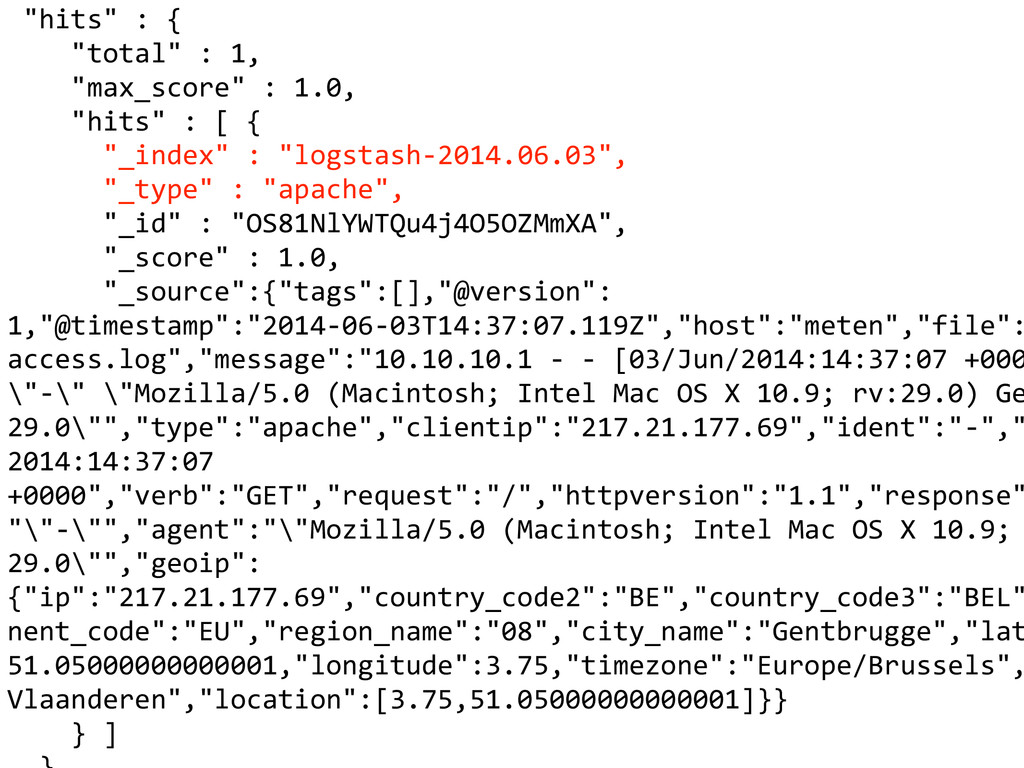
"hits" : { "total" : 1,
"max_score" : 1.0, "hits" : [ { "_index" : "logstash-‐2014.06.03", "_type" : "apache", "_id" : "OS81NlYWTQu4j4O5OZMmXA", "_score" : 1.0, "_source":{"tags":[],"@version": 1,"@timestamp":"2014-‐06-‐03T14:37:07.119Z","host":"meten","file": access.log","message":"10.10.10.1 -‐ -‐ [03/Jun/2014:14:37:07 +000 \"-‐\" \"Mozilla/5.0 (Macintosh; Intel Mac OS X 10.9; rv:29.0) Ge 29.0\"","type":"apache","clientip":"217.21.177.69","ident":"-‐"," 2014:14:37:07 +0000","verb":"GET","request":"/","httpversion":"1.1","response" "\"-‐\"","agent":"\"Mozilla/5.0 (Macintosh; Intel Mac OS X 10.9; 29.0\"","geoip": {"ip":"217.21.177.69","country_code2":"BE","country_code3":"BEL" nent_code":"EU","region_name":"08","city_name":"Gentbrugge","lat 51.05000000000001,"longitude":3.75,"timezone":"Europe/Brussels", Vlaanderen","location":[3.75,51.05000000000001]}} } ] -
{ "template" : "logstash-‐*", "settings" :
{ "index.refresh_interval" : "5s" }, "mappings" : { "_default_" : { "_all" : {"enabled" : true}, "dynamic_templates" : [ { "string_fields" : { "match" : "*", "match_mapping_type" : "string", "mapping" : { "type" : "string", "index" : "analyzed", "omit_norms" : true, "fields" : { "raw" : {"type": "string", "index" : "not_analyzed", "ignore_above" : 256} } } } } ], "properties" : { "@version": { "type": "string", "index": "not_analyzed" }, "geoip" : { "type" : "object", "dynamic": true, "path": "full", "properties" : { "location" : { "type" : "geo_point" } } } } } } } Logstash mapping -
Logstash ElasticSearch ✓Centralized storage ✓„Infinitely” scalable ( -> clustering) ✓Fast
& detailed search ✓Automatic schema mapping ✓Simple to configure ✓Simple to query ✓Ménage à 3 -
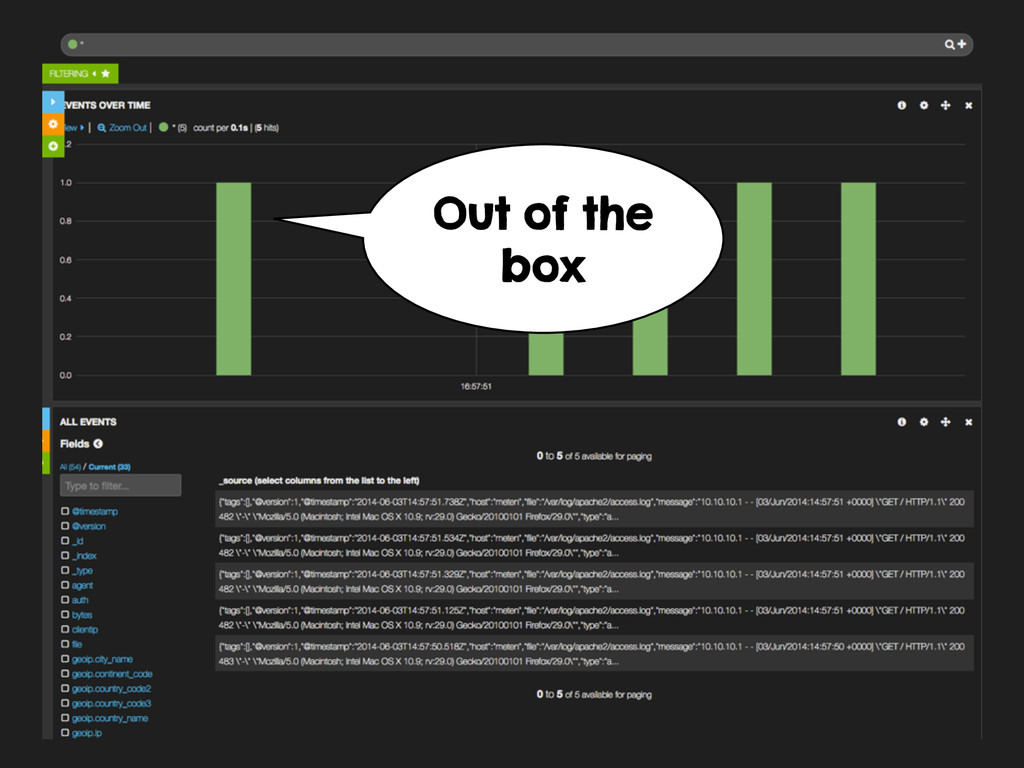
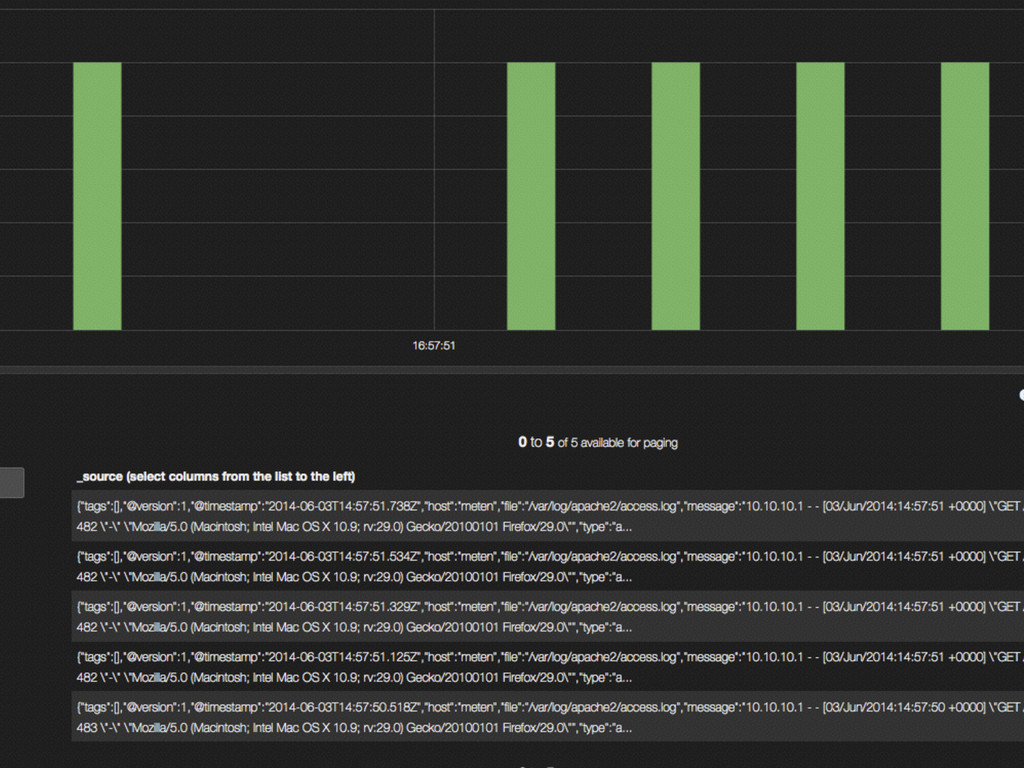
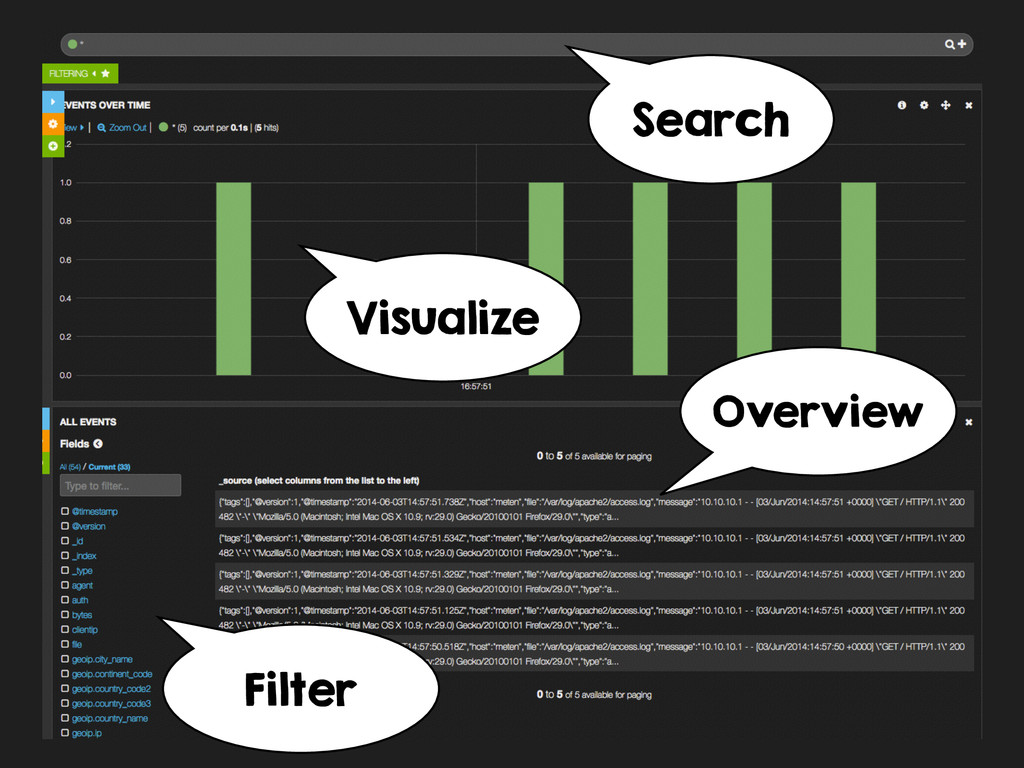
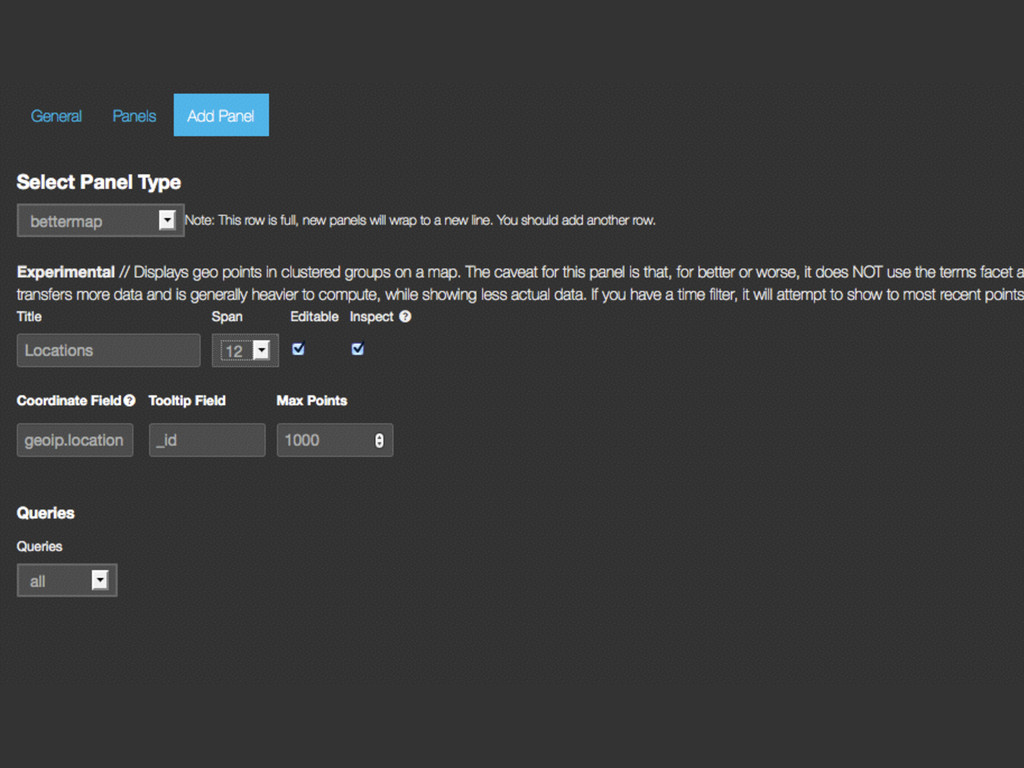
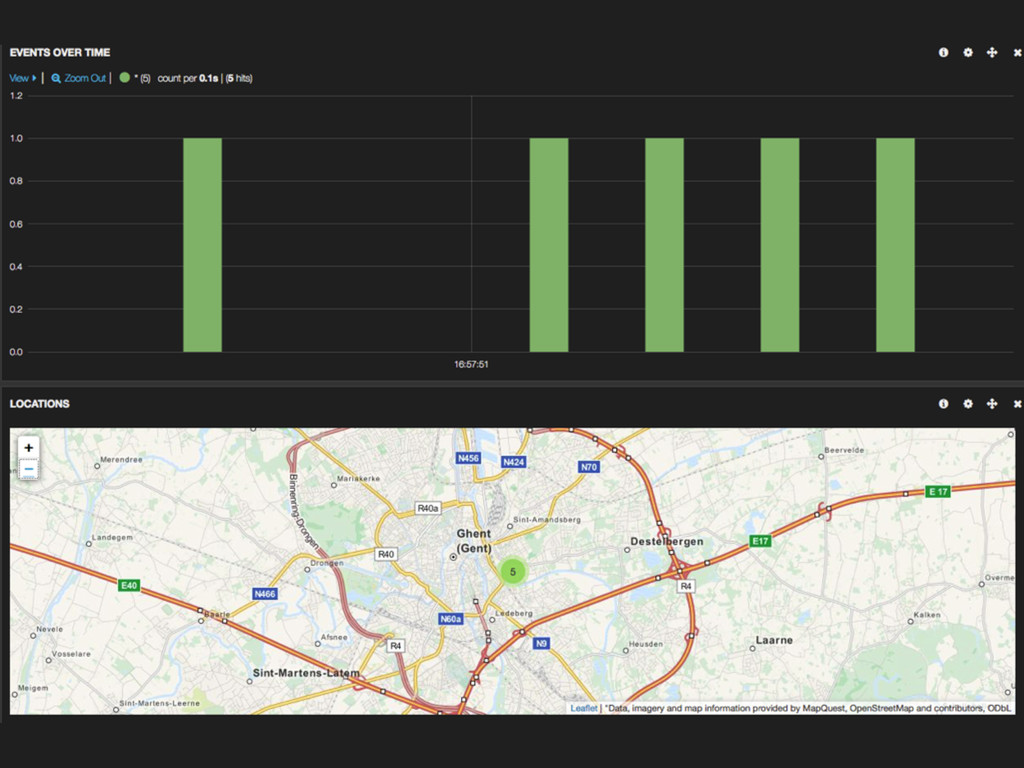
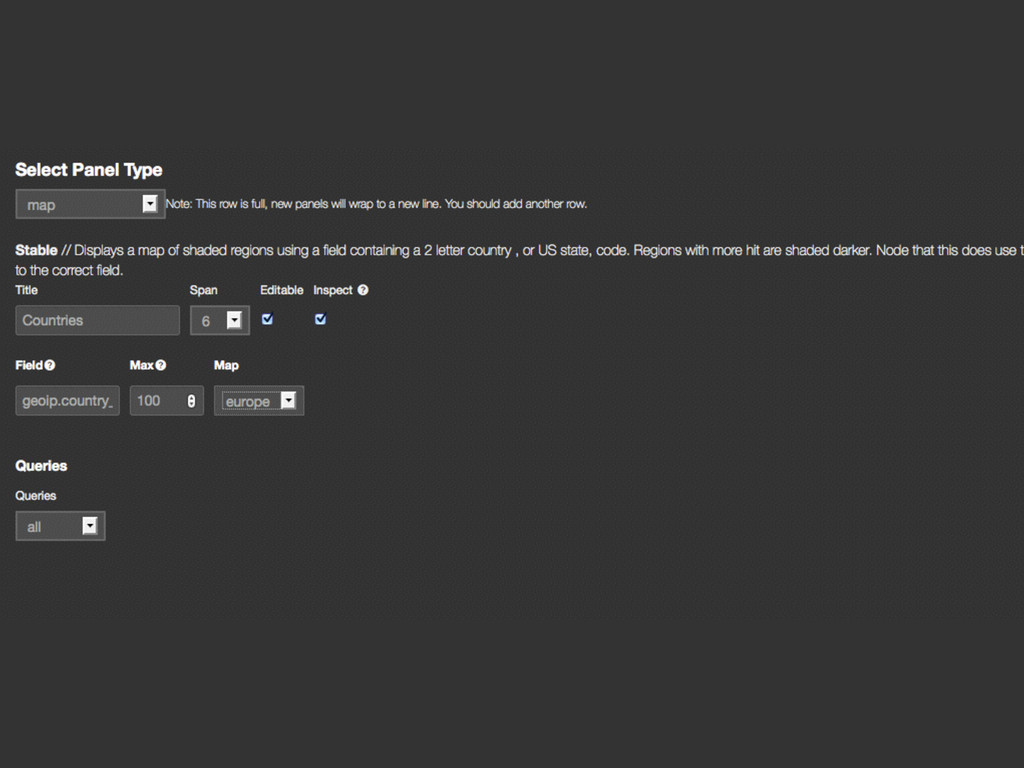
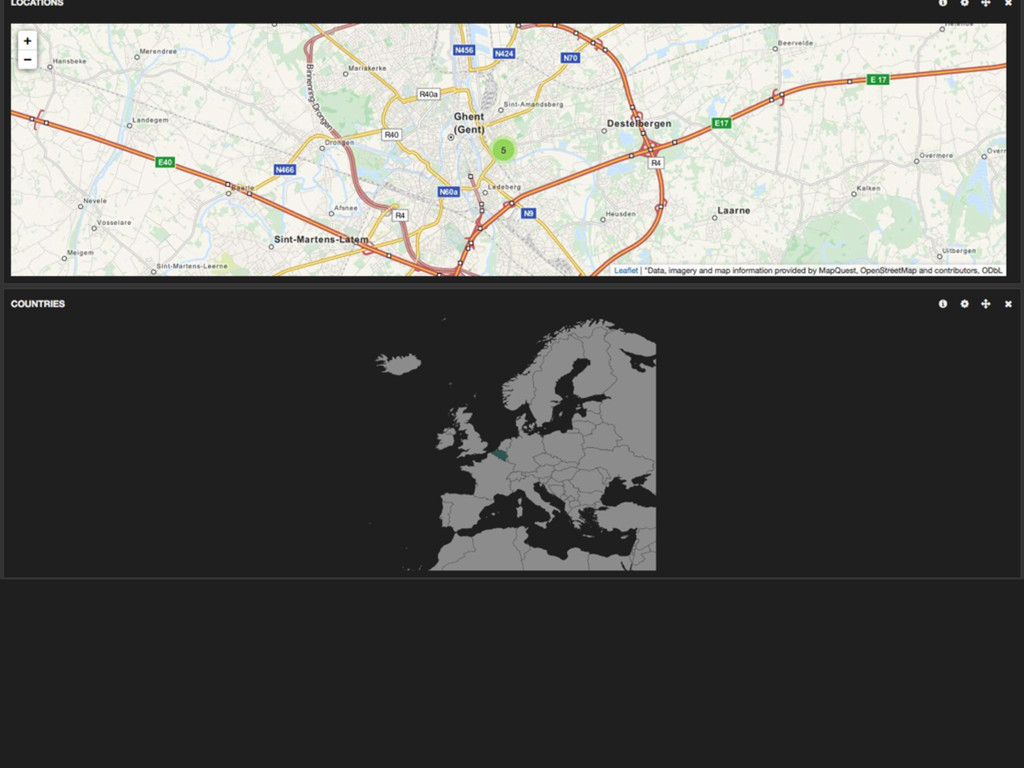
Kibana ✓Reads Logstash data out of ElasticSearch ✓Written entirely in
HTML, Javascript & CSS (no server-side code) ✓Visualizes logs ✓Customizable panels ✓Supported by the ElasticSearch & Logstash team ✓Almost zero config -
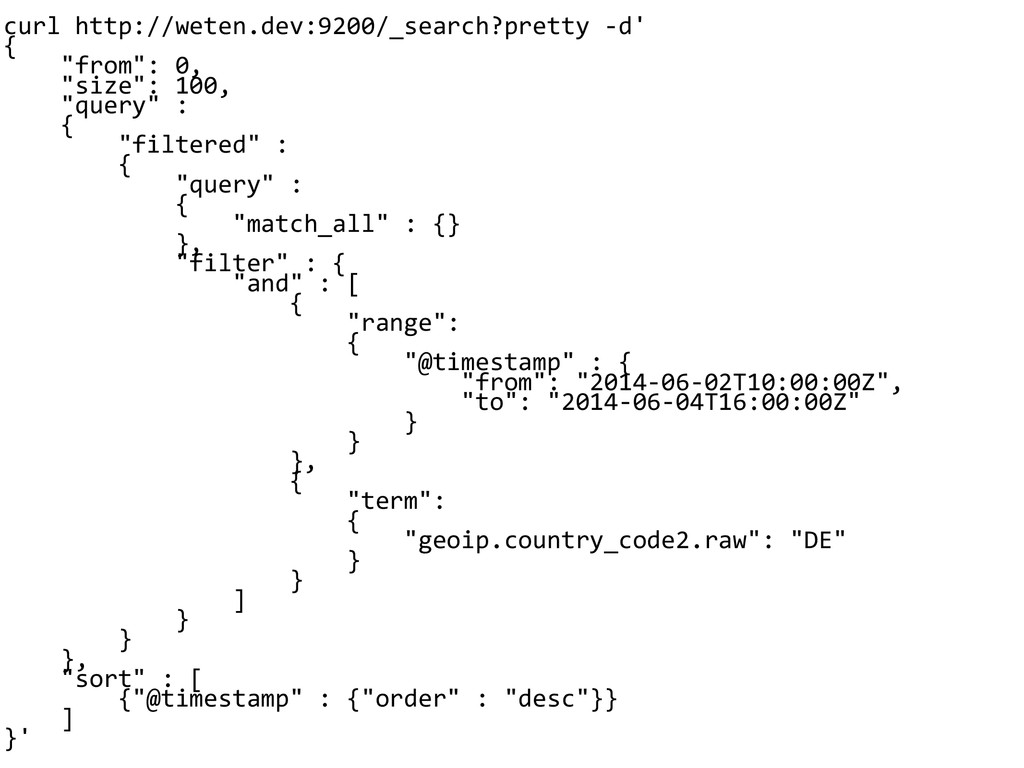
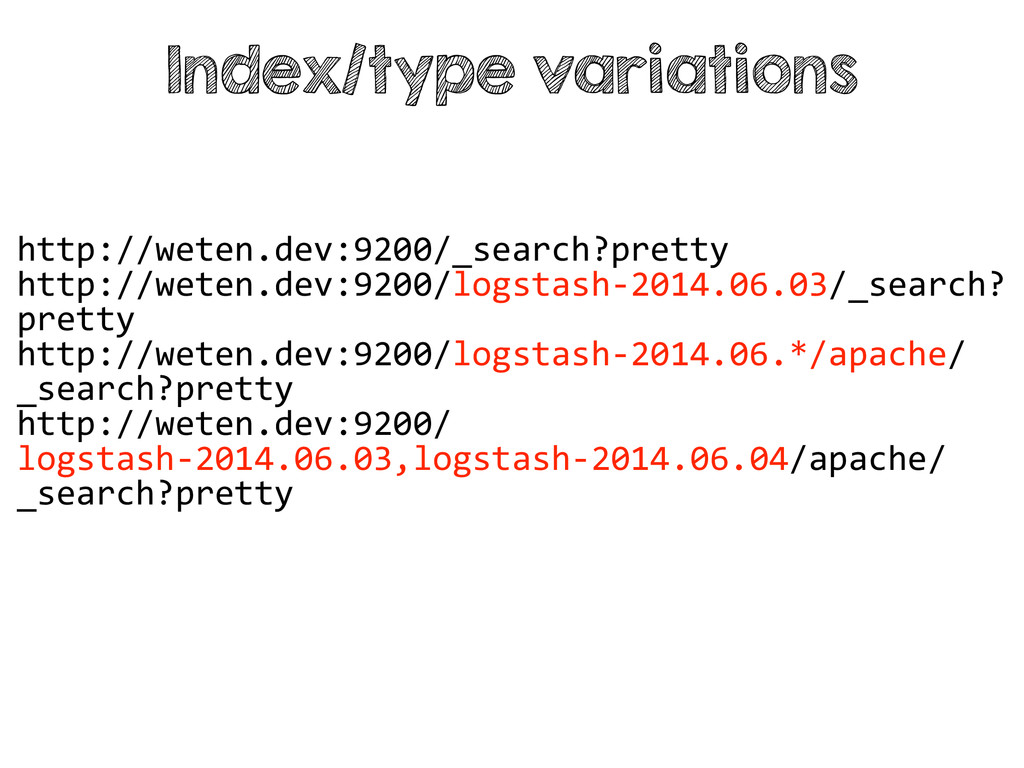
curl http://weten.dev:9200/_search?pretty -‐d' { "from":
0, "size": 100, "query" : { "filtered" : { "query" : { "match_all" : {} }, "filter" : { "and" : [ { "range": { "@timestamp" : { "from": "2014-‐06-‐02T10:00:00Z", "to": "2014-‐06-‐04T16:00:00Z" } } }, { "term": { "geoip.country_code2.raw": "DE" } } ] } } }, "sort" : [ {"@timestamp" : {"order" : "desc"}} ] }' -
curl http://weten.dev:9200/logstash-‐2014.06.04/apache/_search?pretty -‐ d' {
"from": 0, "size": 100, "query" : { "filtered" : { "query" : { "match_all" : {} }, "filter" : { "term": { "geoip.country_code2.raw": "DE" } } } }, "sort" : [ {"@timestamp" : {"order" : "desc"}} ] }' ~database ~table -
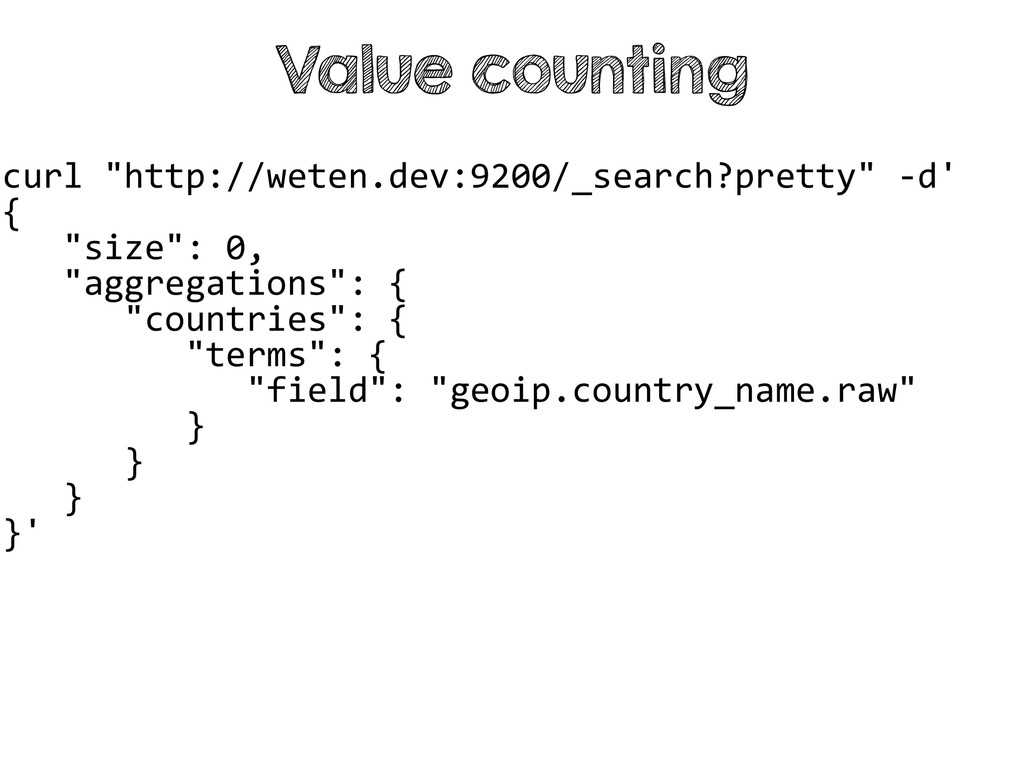
curl "http://weten.dev:9200/_search?pretty" -‐d' { "size": 0,
"aggregations": { "countries": { "terms": { "field": "geoip.country_name.raw" } } } }' Value counting -
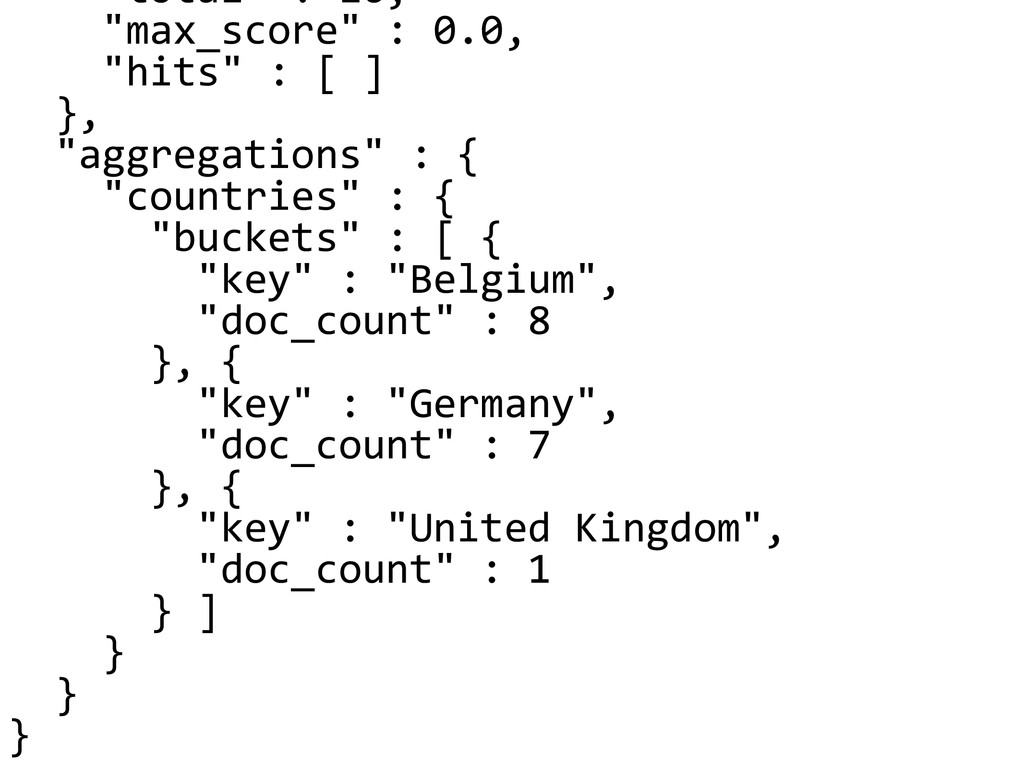
"total" : 16,
"max_score" : 0.0, "hits" : [ ] }, "aggregations" : { "countries" : { "buckets" : [ { "key" : "Belgium", "doc_count" : 8 }, { "key" : "Germany", "doc_count" : 7 }, { "key" : "United Kingdom", "doc_count" : 1 } ] } } } -
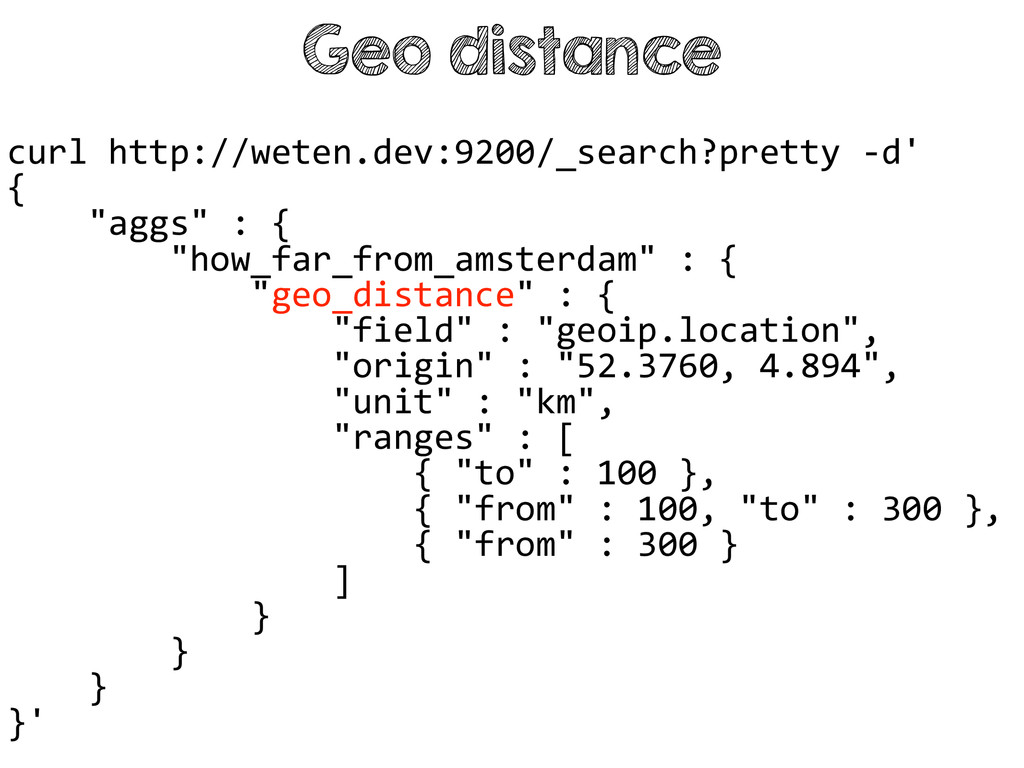
curl http://weten.dev:9200/_search?pretty -‐d' { "aggs"
: { "how_far_from_amsterdam" : { "geo_distance" : { "field" : "geoip.location", "origin" : "52.3760, 4.894", "unit" : "km", "ranges" : [ { "to" : 100 }, { "from" : 100, "to" : 300 }, { "from" : 300 } ] } } } }' Geo distance -
"hits" : [ ] },
"aggregations" : { "how_far_from_amsterdam" : { "buckets" : [ { "key" : "*-‐100.0", "from" : 0.0, "to" : 100.0, "doc_count" : 0 }, { "key" : "100.0-‐300.0", "from" : 100.0, "to" : 300.0, "doc_count" : 8 }, { "key" : "300.0-‐*", "from" : 300.0, "doc_count" : 8 } ] } } } -
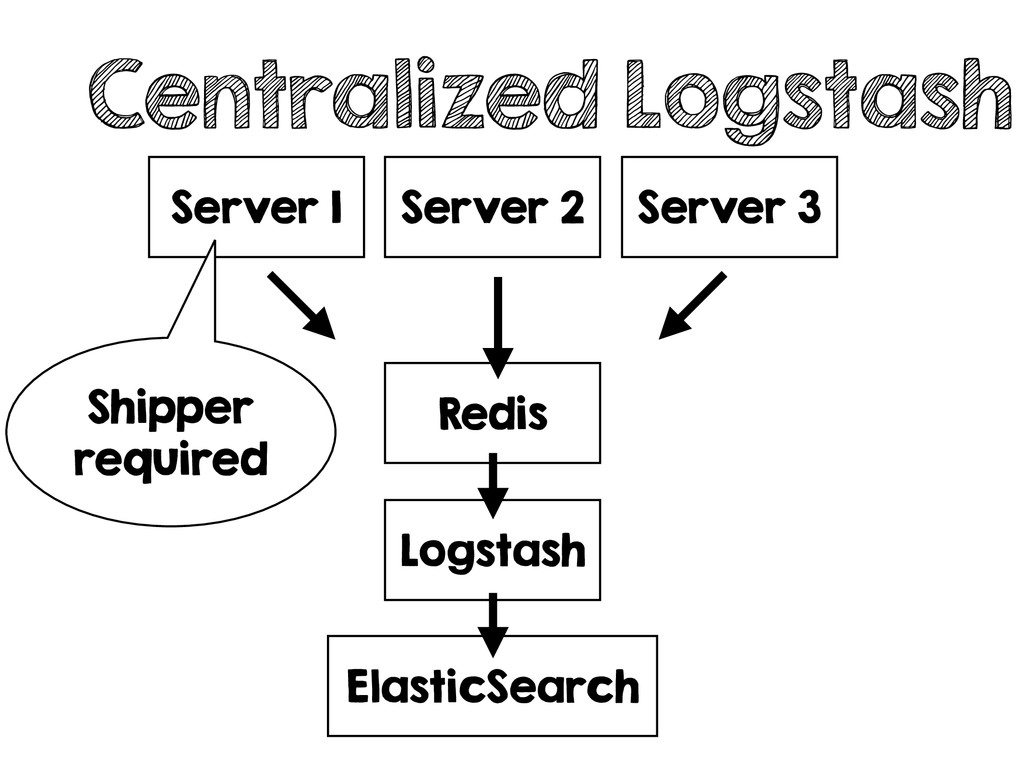
Centralized Logstash Server 1 Server 2 Server 3 Redis Logstash
ElasticSearch Shipper required -
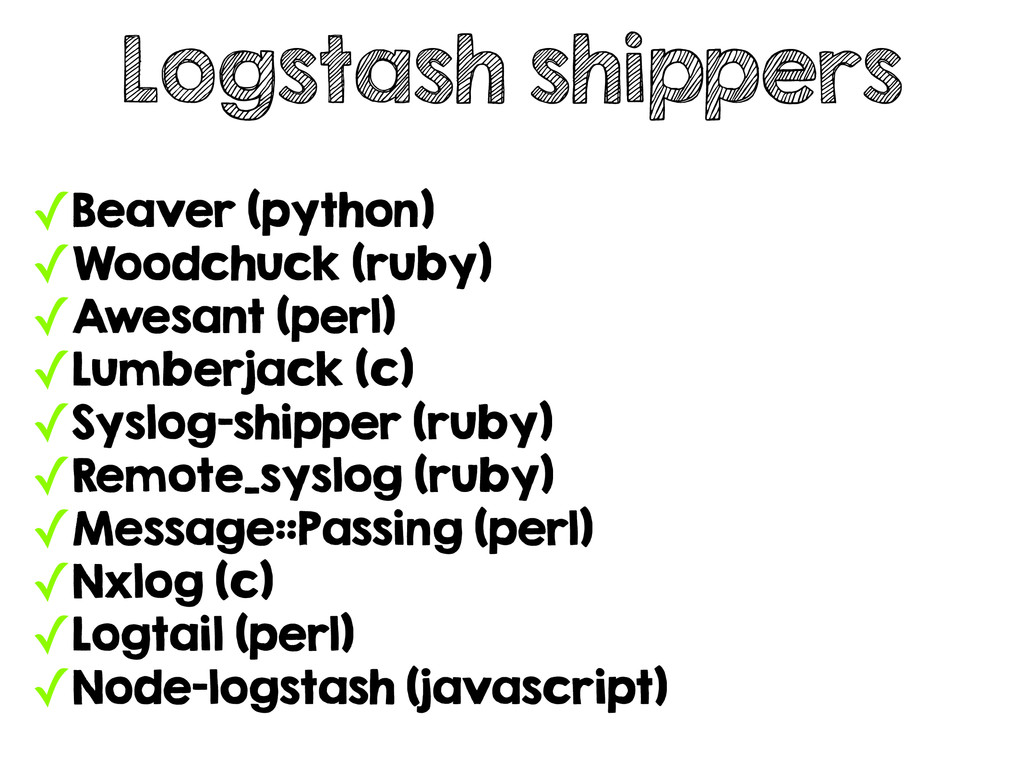
Logstash shippers ✓Beaver (python) ✓Woodchuck (ruby) ✓Awesant (perl) ✓Lumberjack (c)
✓Syslog-shipper (ruby) ✓Remote_syslog (ruby) ✓Message::Passing (perl) ✓Nxlog (c) ✓Logtail (perl) ✓Node-logstash (javascript) -
[beaver] transport: redis redis_url: redis://10.10.10.37:6379/0 redis_namespace: apache
logstash_version: 1 [/var/log/apache2/access.log] type: apache Beaver conf file -
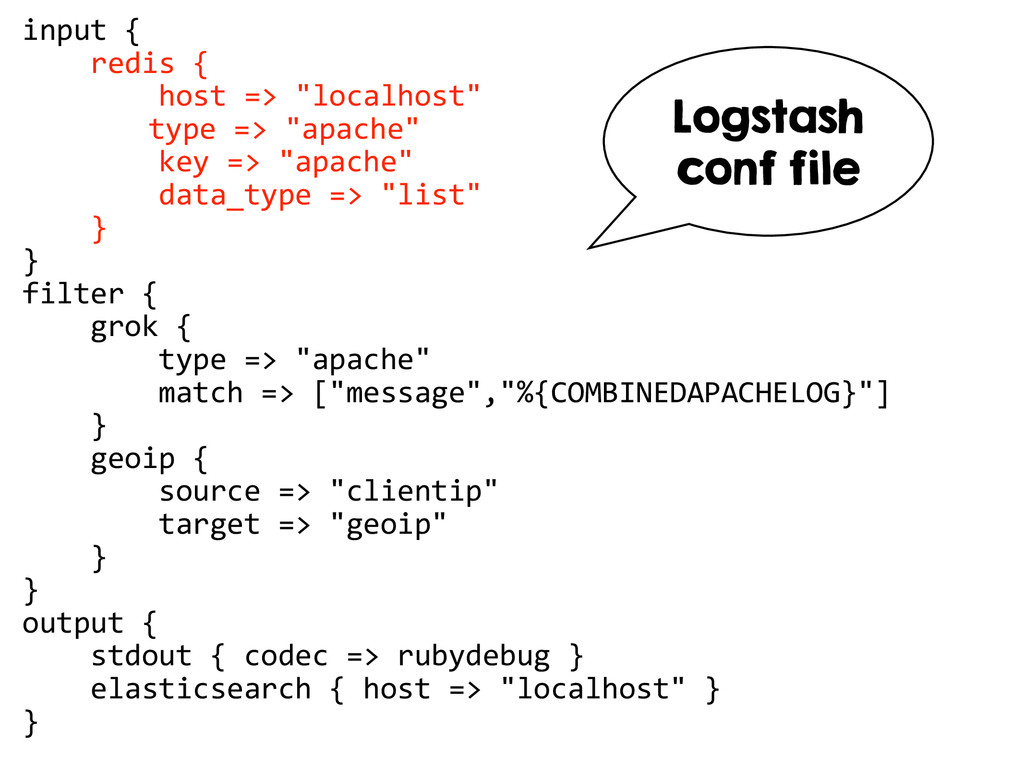
input { redis {
host => "localhost" type => "apache" key => "apache" data_type => "list" } } filter { grok { type => "apache" match => ["message","%{COMBINEDAPACHELOG}"] } geoip { source => "clientip" target => "geoip" } } output { stdout { codec => rubydebug } elasticsearch { host => "localhost" } } Logstash conf file -
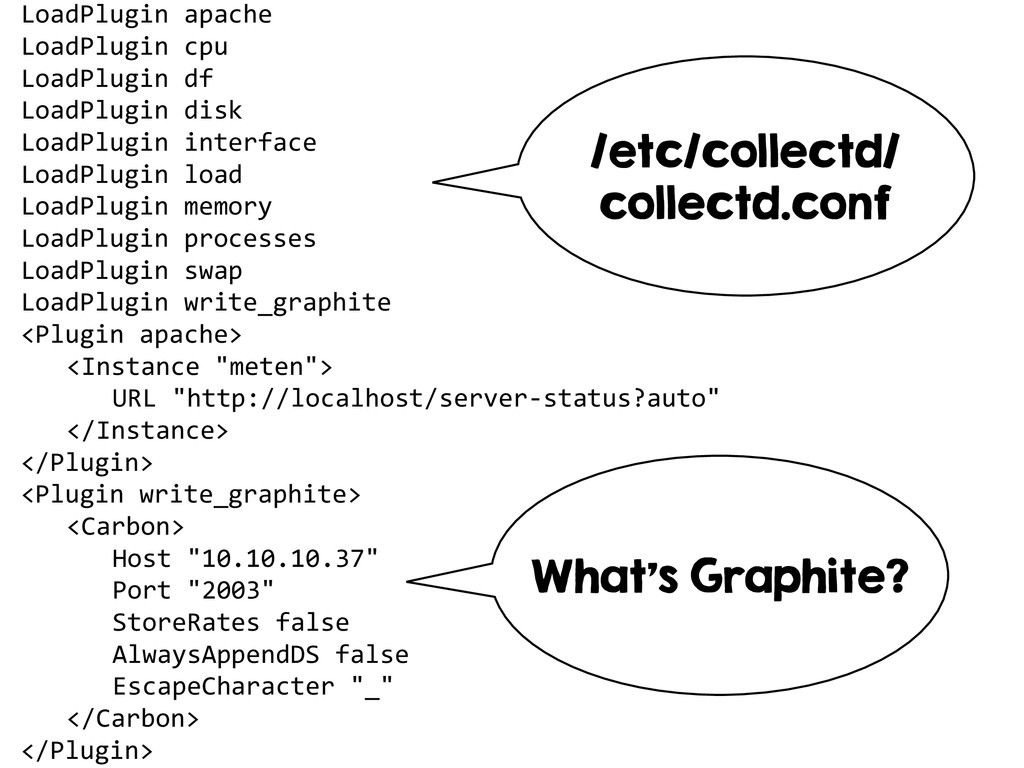
LoadPlugin apache LoadPlugin cpu LoadPlugin df LoadPlugin
disk LoadPlugin interface LoadPlugin load LoadPlugin memory LoadPlugin processes LoadPlugin swap LoadPlugin write_graphite <Plugin apache> <Instance "meten"> URL "http://localhost/server-‐status?auto" </Instance> </Plugin> <Plugin write_graphite> <Carbon> Host "10.10.10.37" Port "2003" StoreRates false AlwaysAppendDS false EscapeCharacter "_" </Carbon> </Plugin> /etc/collectd/ collectd.conf What’s Graphite? -
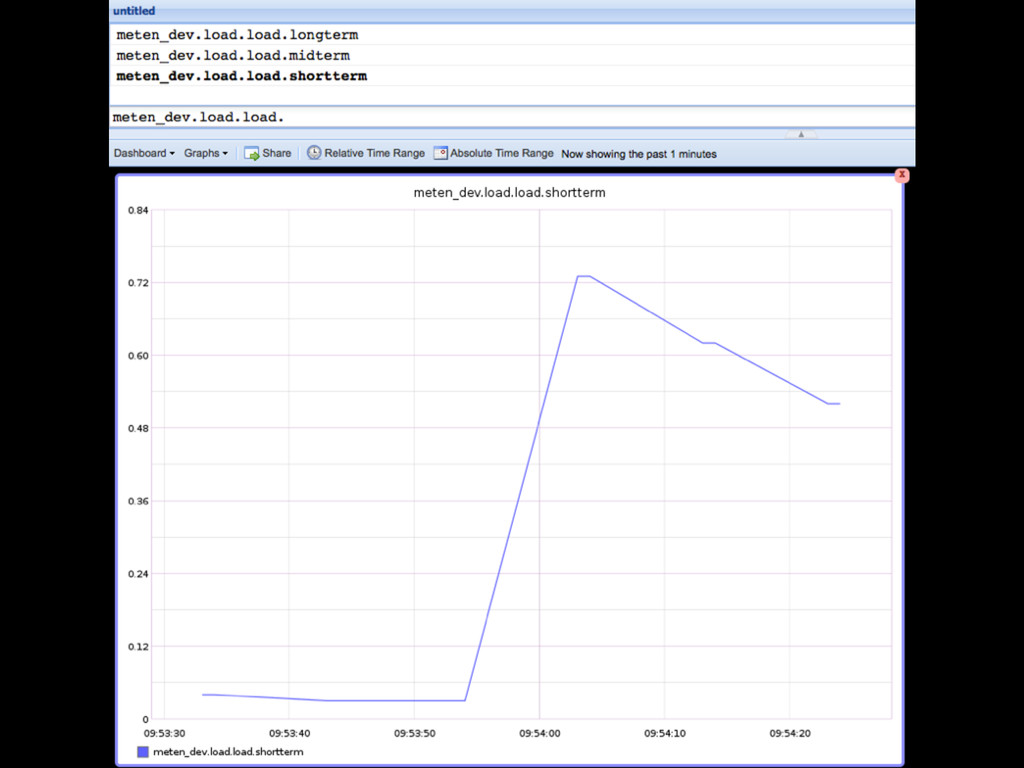
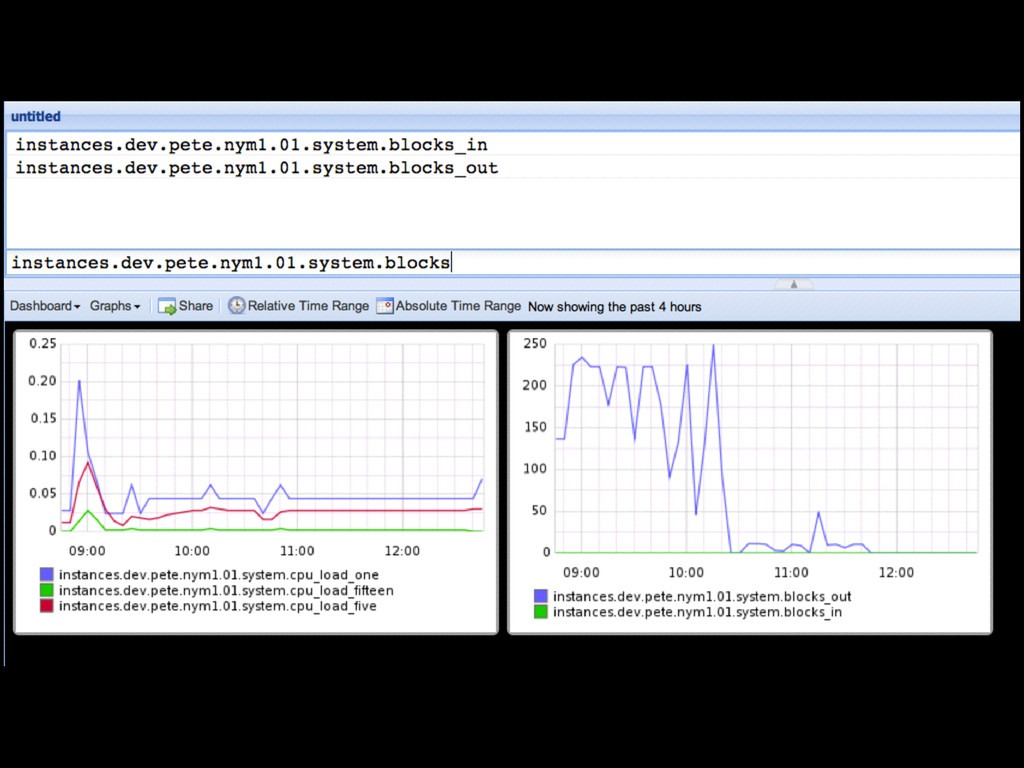
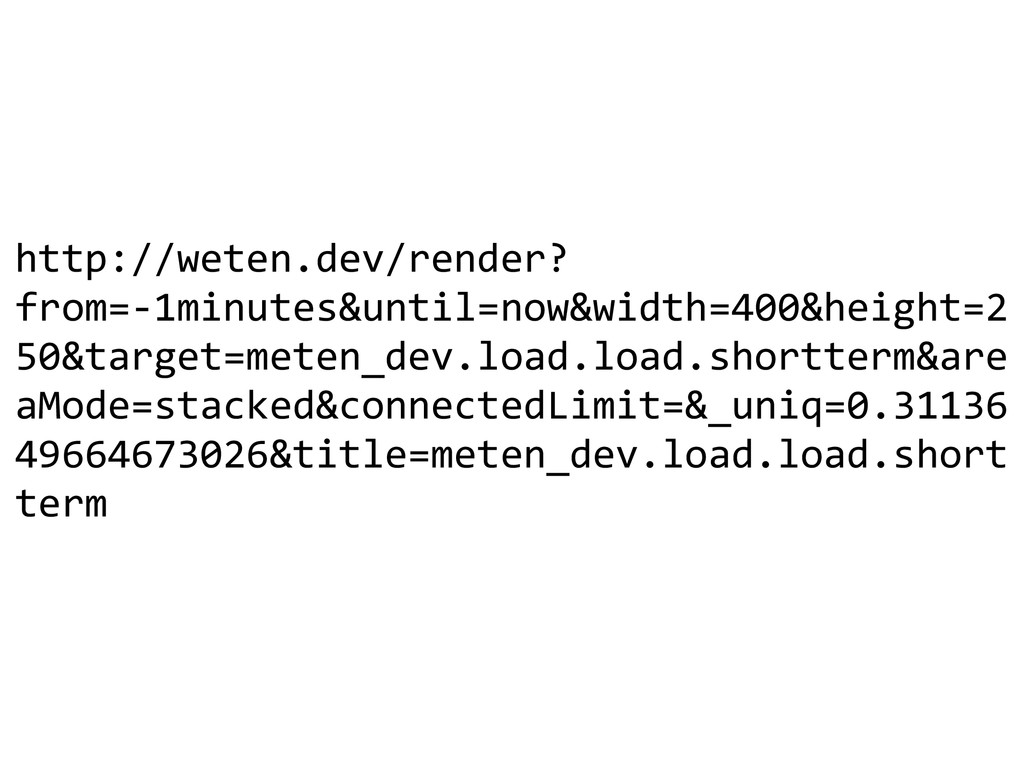
Graphite Store numeric, time-series data & render real-time graphs on
demand http://graphite.wikidot.com -
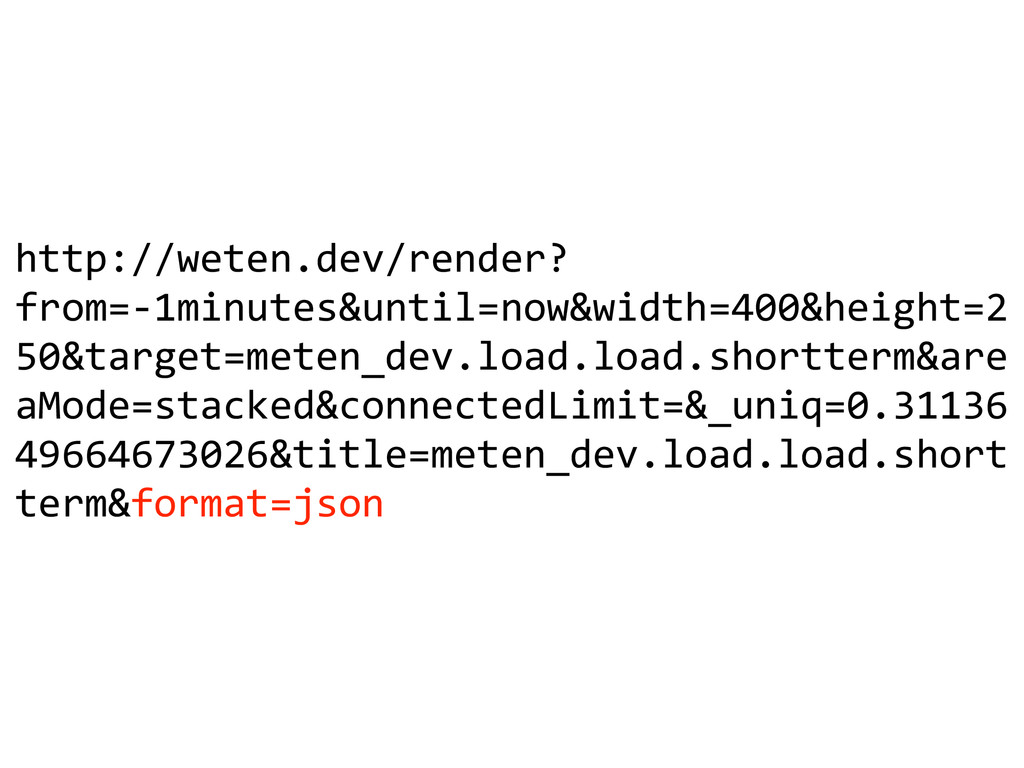
[{"target": "meten_dev.load.load.shortterm", "datapoints": [[null, 1401810412], [null, 1401810413], [null,
1401810414], [1.27, 1401810415], [null, 1401810416], [null, 1401810417], [null, 1401810418], [null, 1401810419], [null, 1401810420], [null, 1401810421], [null, 1401810422], [null, 1401810423], [null, 1401810424], [1.07, 1401810425], [null, 1401810426], [null, 1401810427], [null, 1401810428], [null, 1401810429], [null, 1401810430], [null, 1401810431], [null, 1401810432], [null, 1401810433], [null, 1401810434], [1.05, 1401810435], [null, 1401810436], [null, 1401810437], [null, 1401810438], [null, 1401810439], [null, 1401810440], [null, 1401810441], [null, 1401810442], [null, 1401810443], [null, 1401810444], [1.59, 1401810445], [null, 1401810446], [null, 1401810447], [null, 1401810448], [null, 1401810449], [null, 1401810450], [null, 1401810451], [null, 1401810452], [null, -
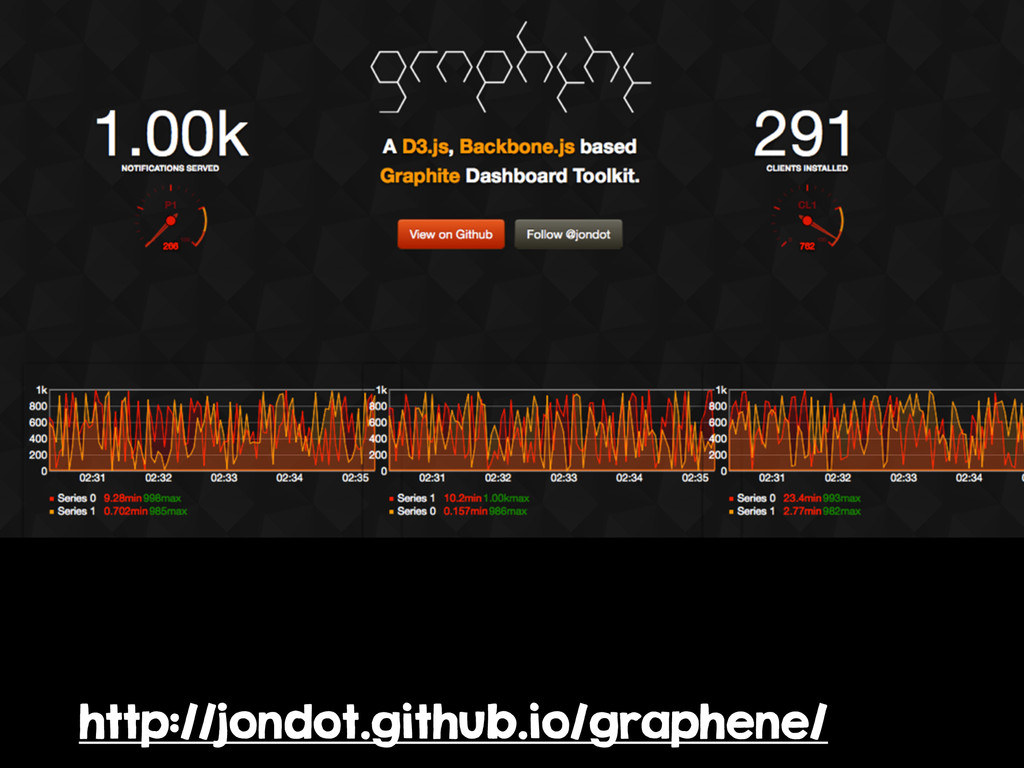
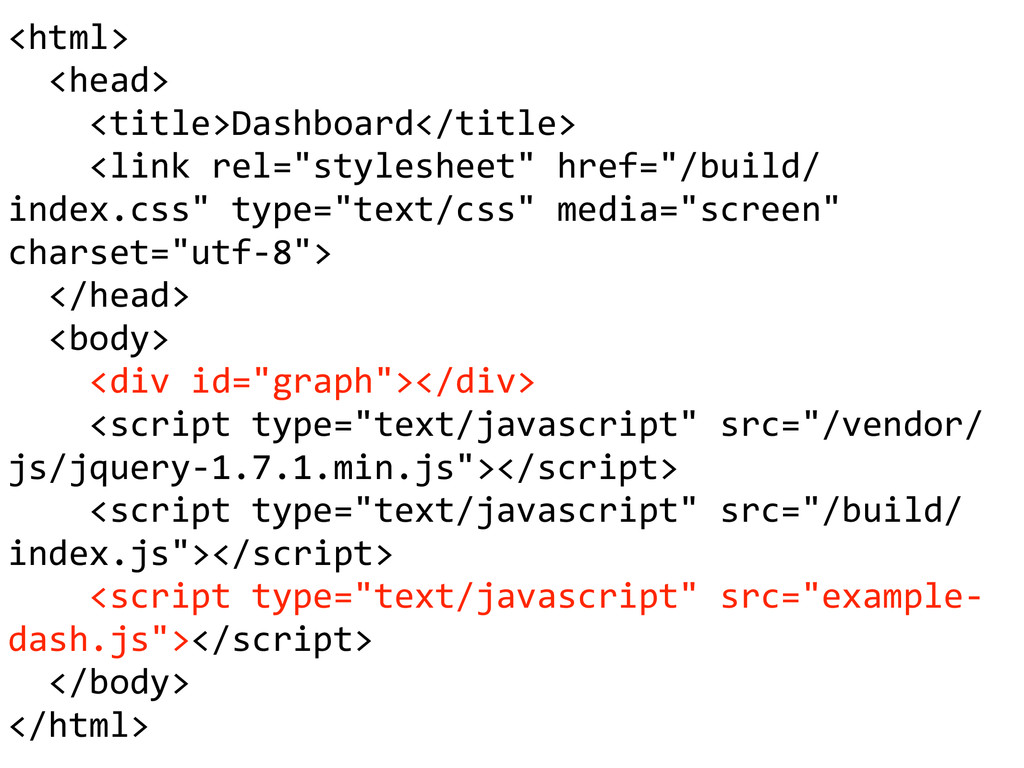
<html> <head> <title>Dashboard</title>
<link rel="stylesheet" href="/build/ index.css" type="text/css" media="screen" charset="utf-‐8"> </head> <body> <div id="graph"></div> <script type="text/javascript" src="/vendor/ js/jquery-‐1.7.1.min.js"></script> <script type="text/javascript" src="/build/ index.js"></script> <script type="text/javascript" src="example-‐ dash.js"></script> </body> </html> -
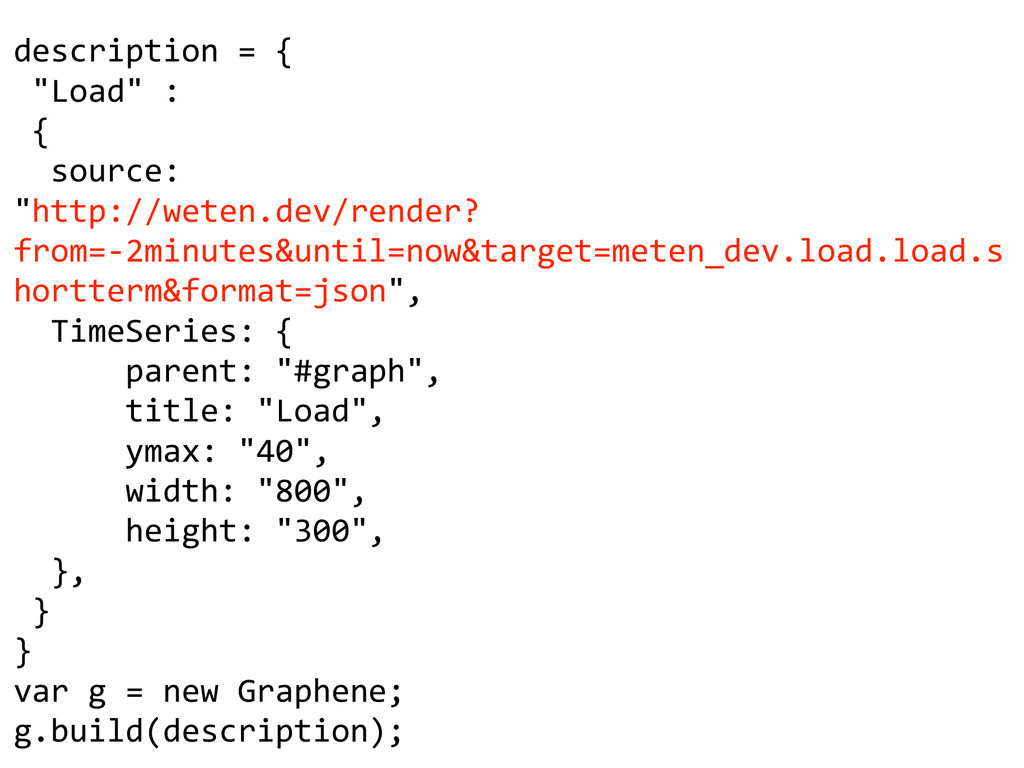
description = { "Load" : {
source: "http://weten.dev/render? from=-‐2minutes&until=now&target=meten_dev.load.load.s hortterm&format=json", TimeSeries: { parent: "#graph", title: "Load", ymax: "40", width: "800", height: "300", }, } } var g = new Graphene; g.build(description); -
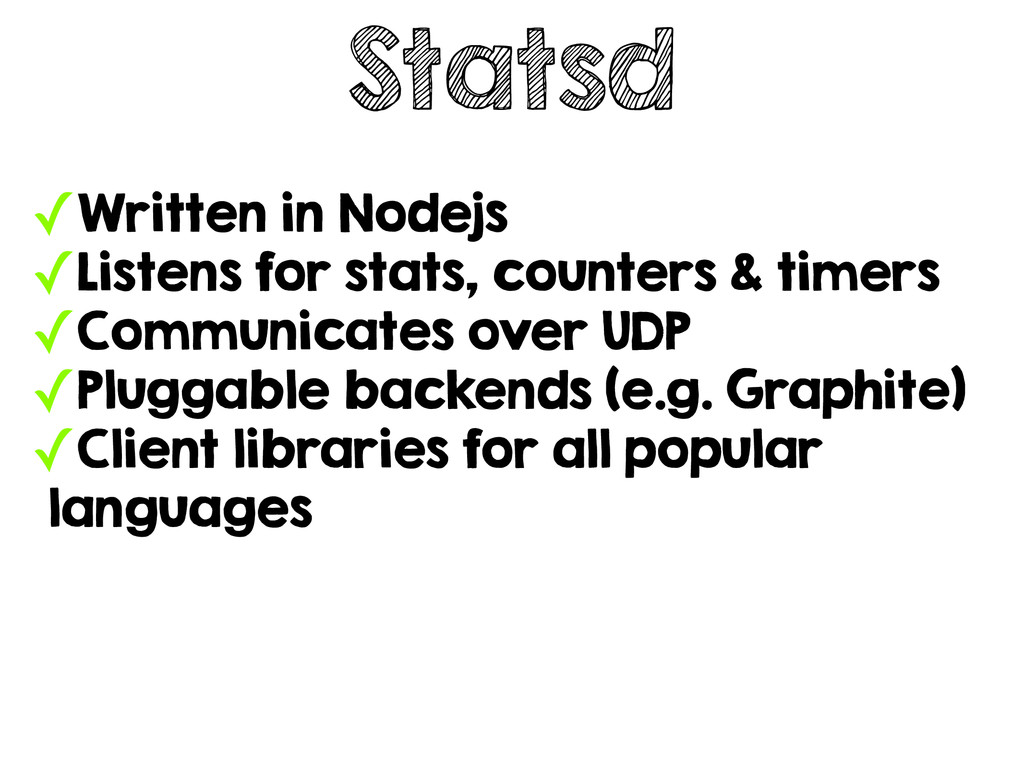
Statsd ✓Written in Nodejs ✓Listens for stats, counters & timers
✓Communicates over UDP ✓Pluggable backends (e.g. Graphite) ✓Client libraries for all popular languages -
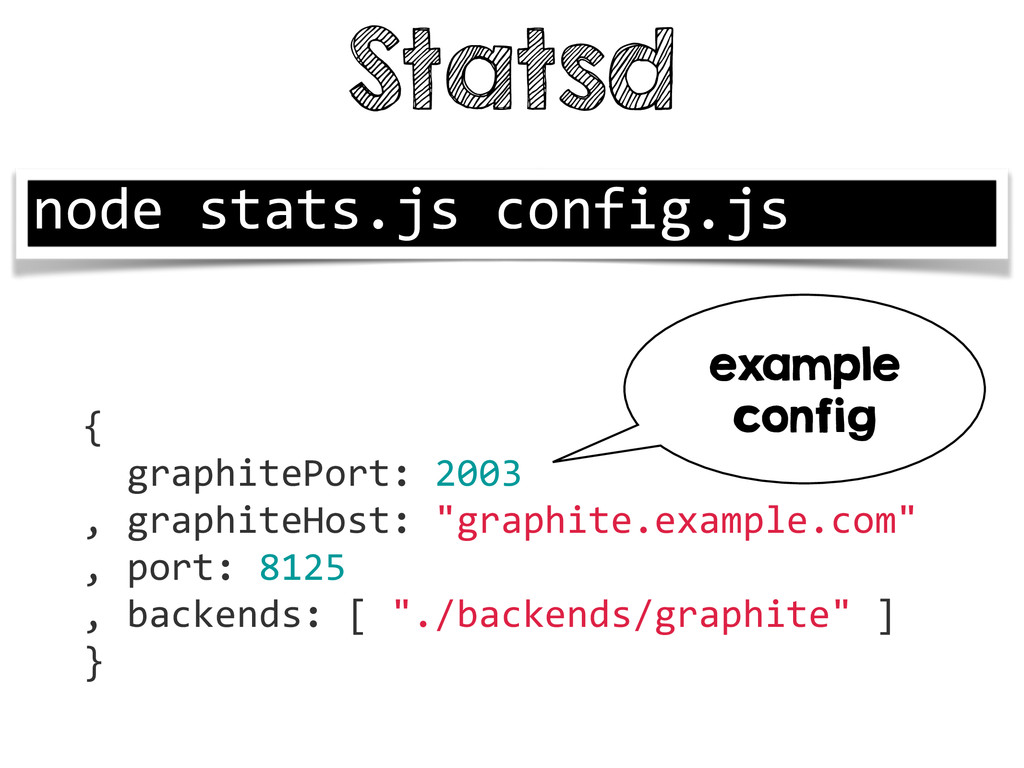
Statsd node stats.js config.js { graphitePort: 2003
, graphiteHost: "graphite.example.com" , port: 8125 , backends: [ "./backends/graphite" ] } example config -
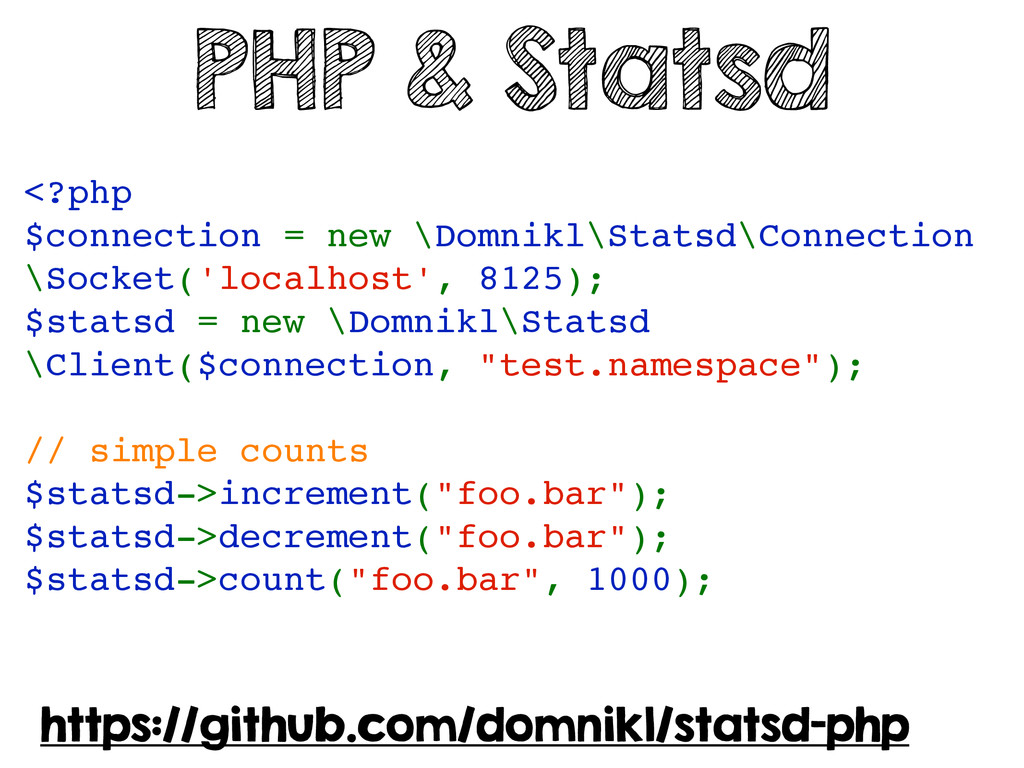
PHP & Statsd https://github.com/domnikl/statsd-php <?php! $connection = new \Domnikl\Statsd\Connection \Socket('localhost',
8125);! $statsd = new \Domnikl\Statsd \Client($connection, "test.namespace");! ! // simple counts! $statsd->increment("foo.bar");! $statsd->decrement("foo.bar");! $statsd->count("foo.bar", 1000); -
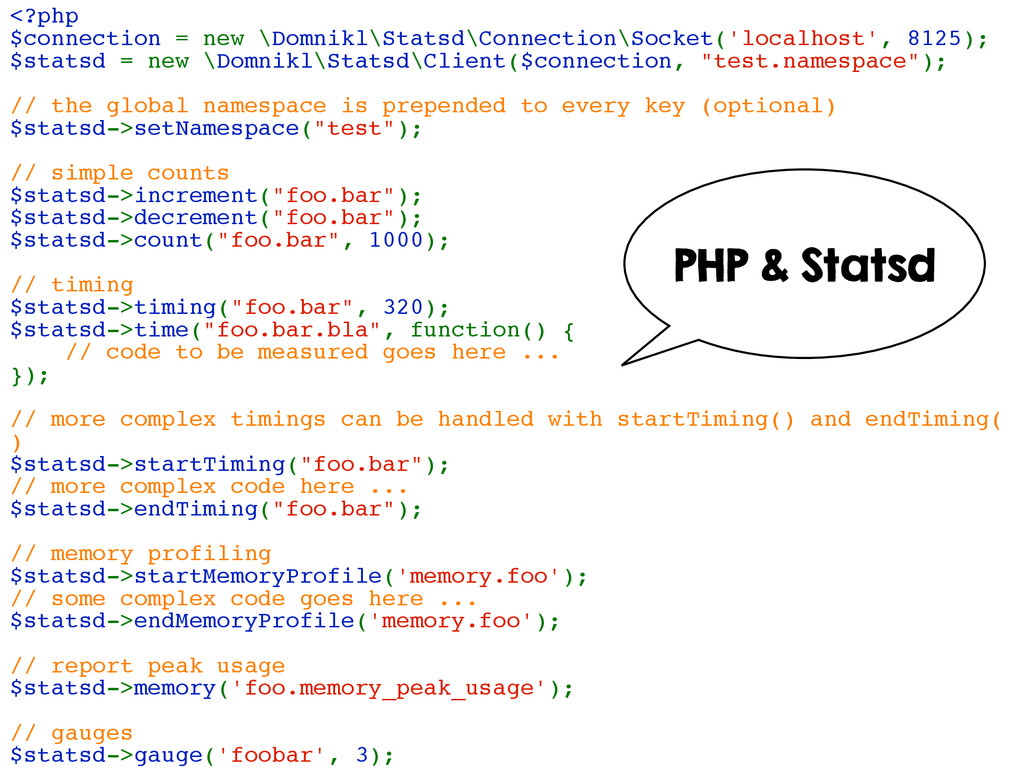
<?php! $connection = new \Domnikl\Statsd\Connection\Socket('localhost', 8125);! $statsd = new \Domnikl\Statsd\Client($connection,
"test.namespace");! ! // the global namespace is prepended to every key (optional)! $statsd->setNamespace("test");! ! // simple counts! $statsd->increment("foo.bar");! $statsd->decrement("foo.bar");! $statsd->count("foo.bar", 1000);! ! // timing! $statsd->timing("foo.bar", 320);! $statsd->time("foo.bar.bla", function() {! // code to be measured goes here ...! });! ! // more complex timings can be handled with startTiming() and endTiming( )! $statsd->startTiming("foo.bar");! // more complex code here ...! $statsd->endTiming("foo.bar");! ! // memory profiling! $statsd->startMemoryProfile('memory.foo');! // some complex code goes here ...! $statsd->endMemoryProfile('memory.foo');! ! // report peak usage! $statsd->memory('foo.memory_peak_usage');! ! // gauges! $statsd->gauge('foobar', 3); PHP & Statsd -
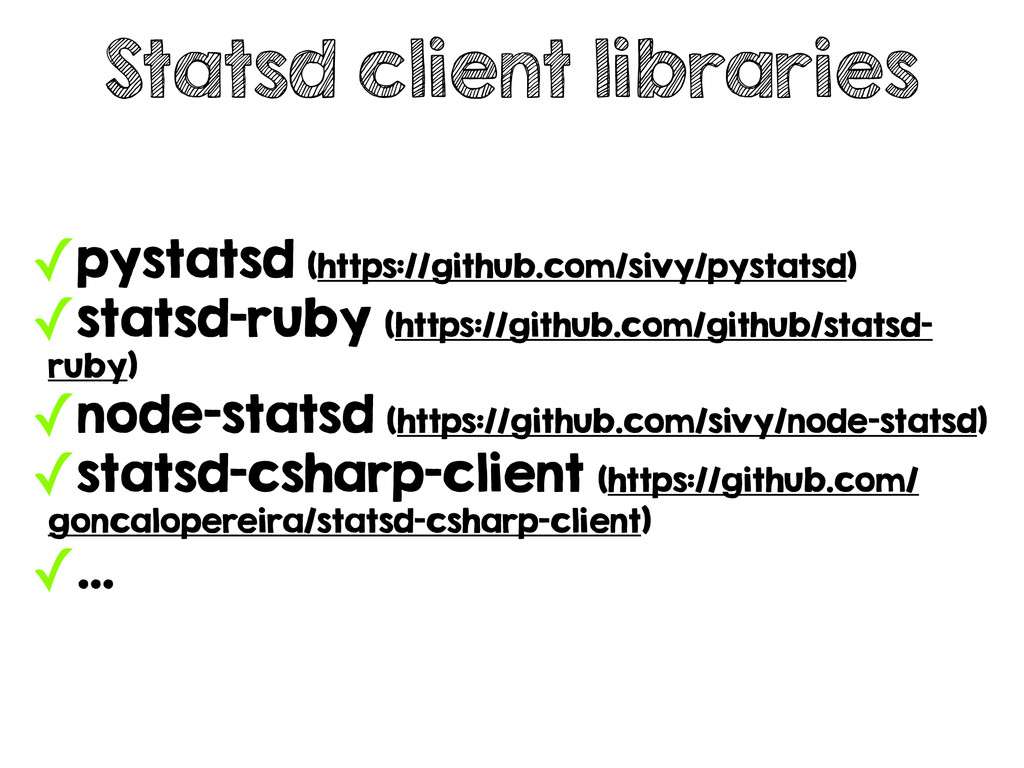
Statsd client libraries ✓pystatsd (https://github.com/sivy/pystatsd) ✓statsd-ruby (https://github.com/github/statsd- ruby) ✓node-statsd (https://github.com/sivy/node-statsd)
✓statsd-csharp-client (https://github.com/ goncalopereira/statsd-csharp-client) ✓… -
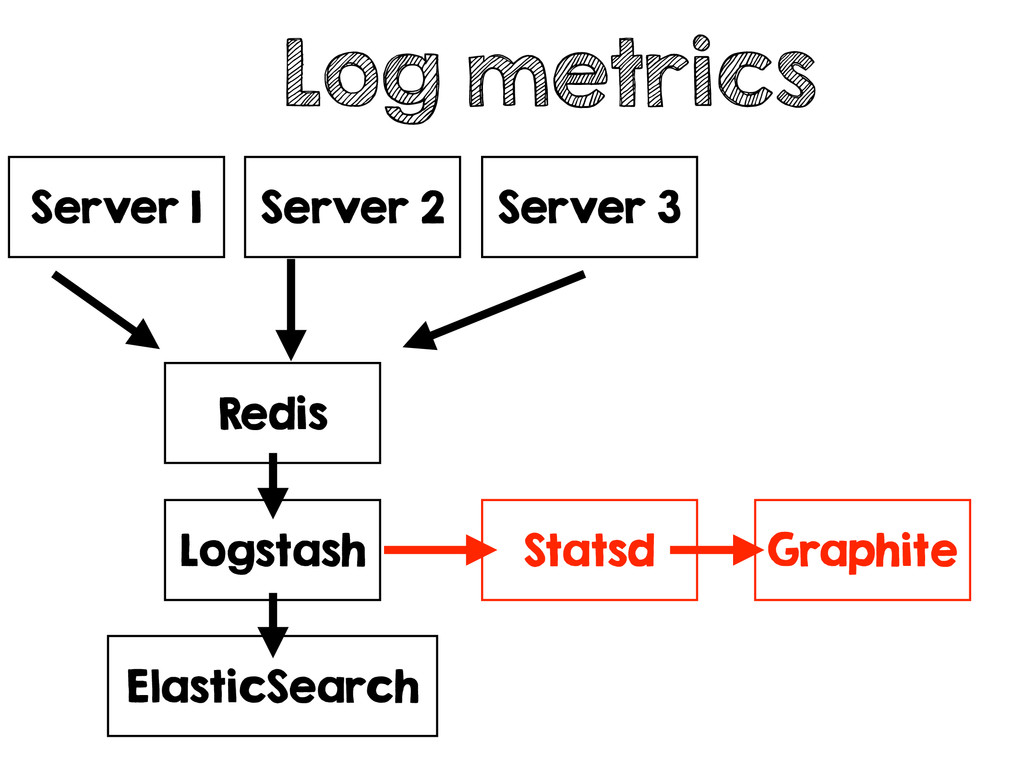
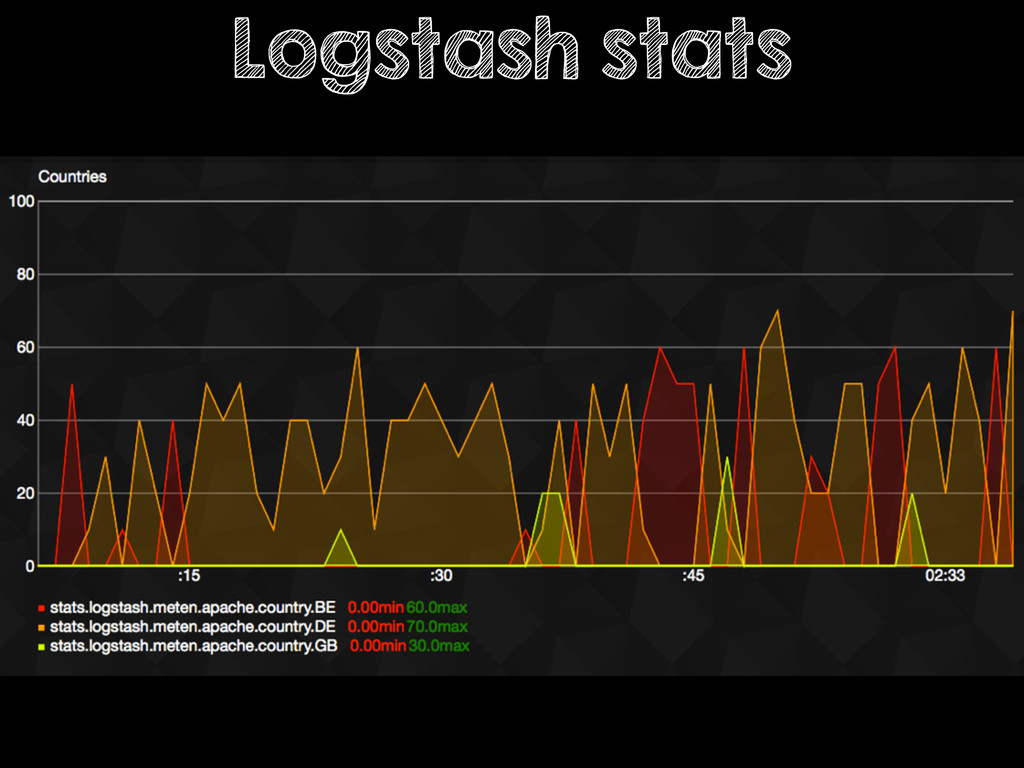
Log metrics Server 1 Server 2 Server 3 Redis Logstash
ElasticSearch Statsd Graphite -
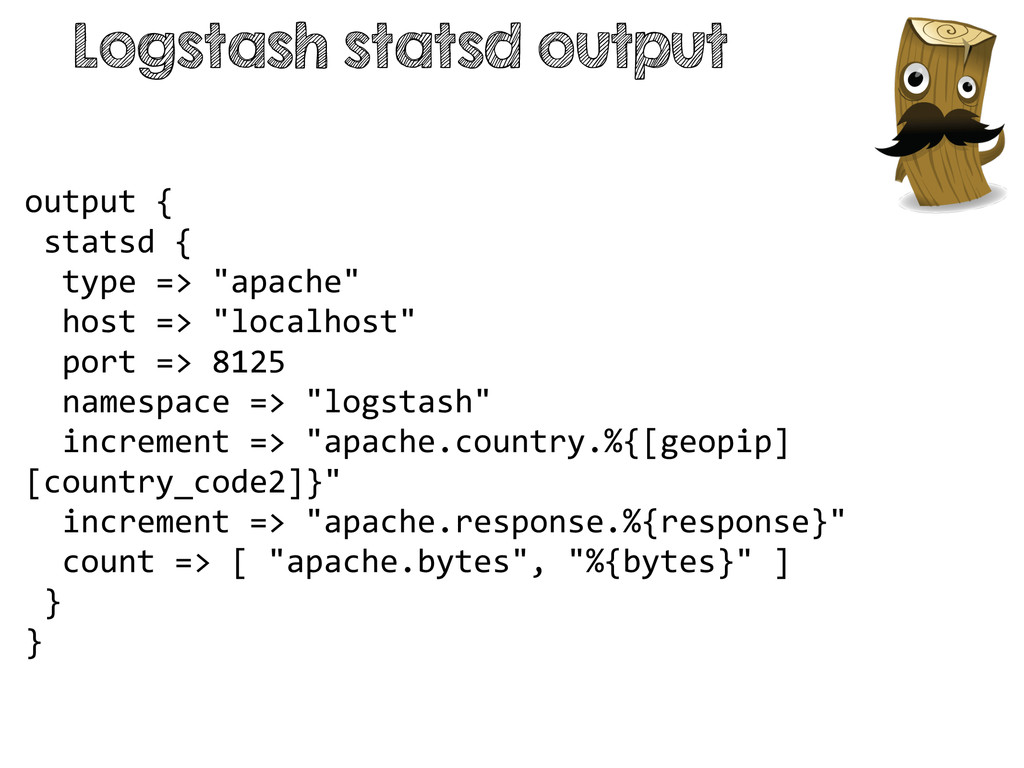
output { statsd {
type => "apache" host => "localhost" port => 8125 namespace => "logstash" increment => "apache.country.%{[geopip] [country_code2]}" increment => "apache.response.%{response}" count => [ "apache.bytes", "%{bytes}" ] } } Logstash statsd output
 thijsferyn
 nori_shinoda
 rmetzger
 shinyaa31
 oidfj
 amixedcolor
 inariku
 akuwano
 ryouto715
 shift_evolve
 iwamot
 sergicalsix
 jmmastey
 portentint
 tanoku
 jeffersonlam
 hatefulcrawdad
 stuffmc
 inesmontani
 takai
 reverentgeek
 jnunemaker
 raygrieselhuber
 jonoalderson





















![{ "myNumber": [ [](https://files.speakerdeck.com/presentations/f13afce0dcf30131b4bb7abe6293b58c/slide_32.jpg)





























![[{"target": "meten_dev.load.load.shortterm", "datapoints": [[null, 1401810412], [null, 1401810413], [null,](https://files.speakerdeck.com/presentations/f13afce0dcf30131b4bb7abe6293b58c/slide_88.jpg)