Upgrade to Pro — share decks privately, control downloads, hide ads and more …

Observability: more data, more questions

Observability: more data, more questions

This presentation was given at the second API-days event in Amsterdam.

In this presentation I talk about KPN's API-Store and our observability experiences with the platform.

Albert W. Alberts

June 19, 2019
Tweet

More Decks by Albert W. Alberts

Other Decks in Technology

Transcript

  1. Albert Alberts architect KPN since January 1999: - Previous functions:

    developer, designer, software architect - Worked on several KPN patents - Currently architect for VPC, SDN and the KPN API Store Meetup Organizer: - devNetNoord, a developer community (589 members) - domoticaGrunn, a home automation community (240 members) Spare time: (Open water) swimming, water polo, cycling [email protected]
  2. SLA Service Level Agreement SLO Service Level Objective SLI Service

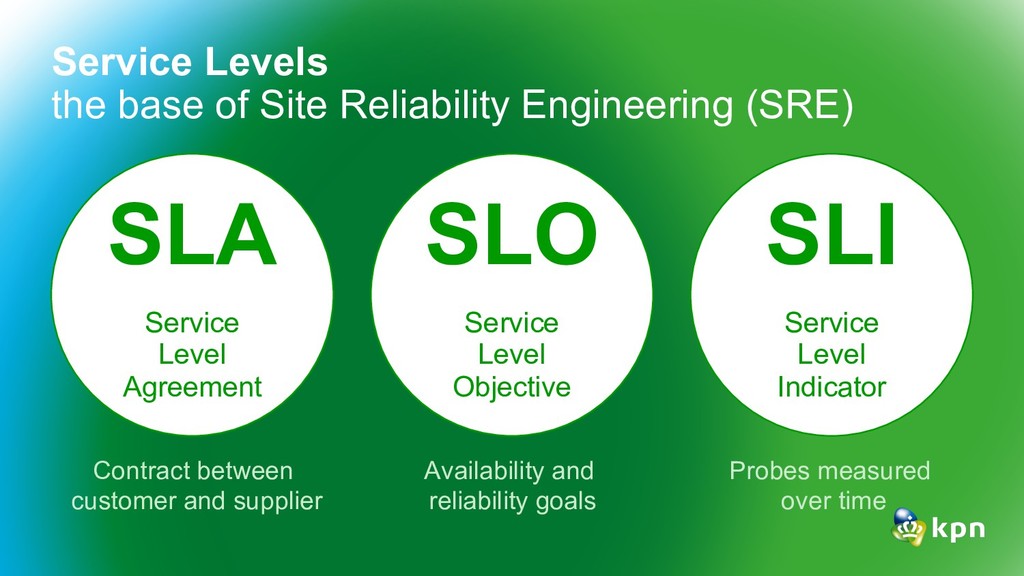
    Level Indicator Service Levels the base of Site Reliability Engineering (SRE) Contract between customer and supplier Availability and reliability goals Probes measured over time
  3. is about known-unknowns and actionable alerts Monitoring is for symptom

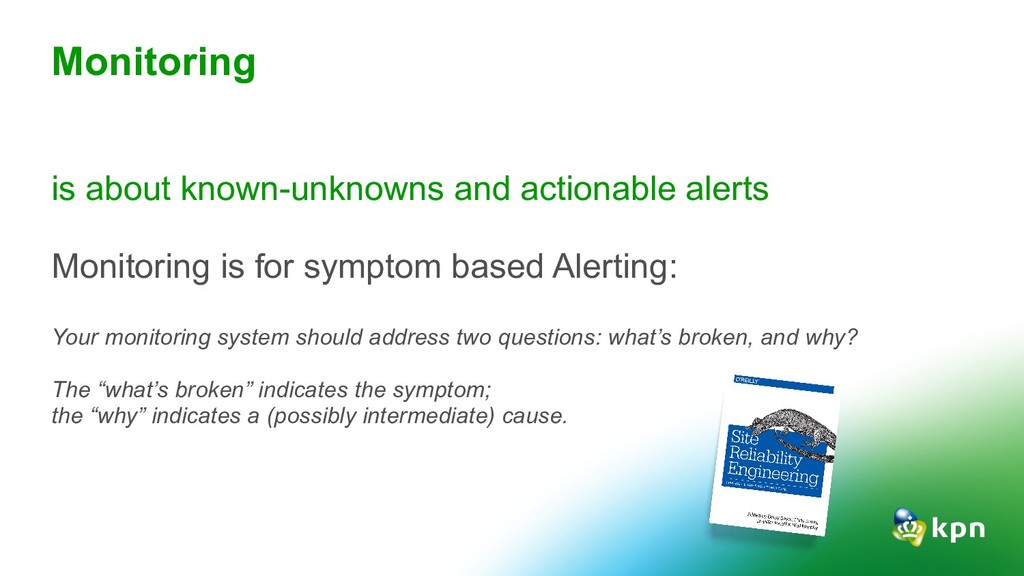
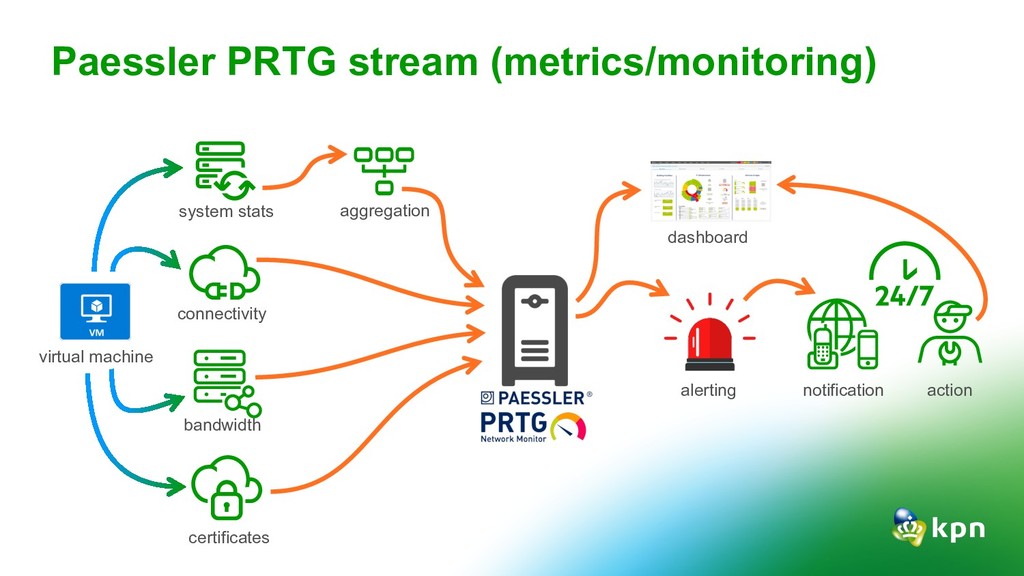
    based Alerting: Your monitoring system should address two questions: what’s broken, and why? The “what’s broken” indicates the symptom; the “why” indicates a (possibly intermediate) cause. Monitoring
  4. is about unknown-unknowns Empowering you to ask new questions and

    answer questions yet to be formulated … Observability
  5. Metrics Metrics are raw measurements of resource usage or behavior

    that can be observed and collected over time.
  6. Monitoring Monitoring is the process of collecting, aggregating, and analyzing

    metrics to improve awareness of your components' characteristics and behavior.
  7. Tracing A trace is a representation of a series of

    causally related distributed events that encode the end-to-end request flow through a distributed system.
  8. Alerting Alerting is the responsive component of a monitoring system

    that performs actions based on changes in metric values.
  9. Paessler PRTG stream (metrics/monitoring) virtual machine bandwidth system stats connectivity

    certificates aggregation alerting notification action dashboard
  10. Tracing with JavaScript Object Notation {JSON} Elastic process info virtual

    machine (nested) JSON fluentd Kibana Grafana InfluxDB
  11. Tracing with JavaScript Object Notation {JSON} process info virtual machine

    (nested) JSON Nesting JSON and dynamic structure are hard to ”read” by the backend systems Keep it simple, understand TSDB and close the dev-ops gap
  12. Tracing data flow rsyslog Telegraf InfluxDB Elastic Filebeat Grafana process

    info log files system stats virtual machine Dashboard
  13. What did work and what didn’t? rsyslog Telegraf InfluxDB Elastic

    Filebeat Grafana process info log files system stats virtual machine Dashboard
  14. Notification rsyslog Telegraf InfluxDB Elastic Filebeat Grafana process info log

    files system stats virtual machine Dashboard Notification
  15. Slack notification rsyslog Telegraf InfluxDB Elastic Filebeat Grafana process info

    log files system stats virtual machine Dashboard Notification
  16. Example NGINX data flow log files process info rsyslog Telegraf

    InfluxDB Elastic Filebeat Grafana system stats Dashboard Notification
  17. Monitoring: Hardware metrics alone is not enough. Logging: Logging required

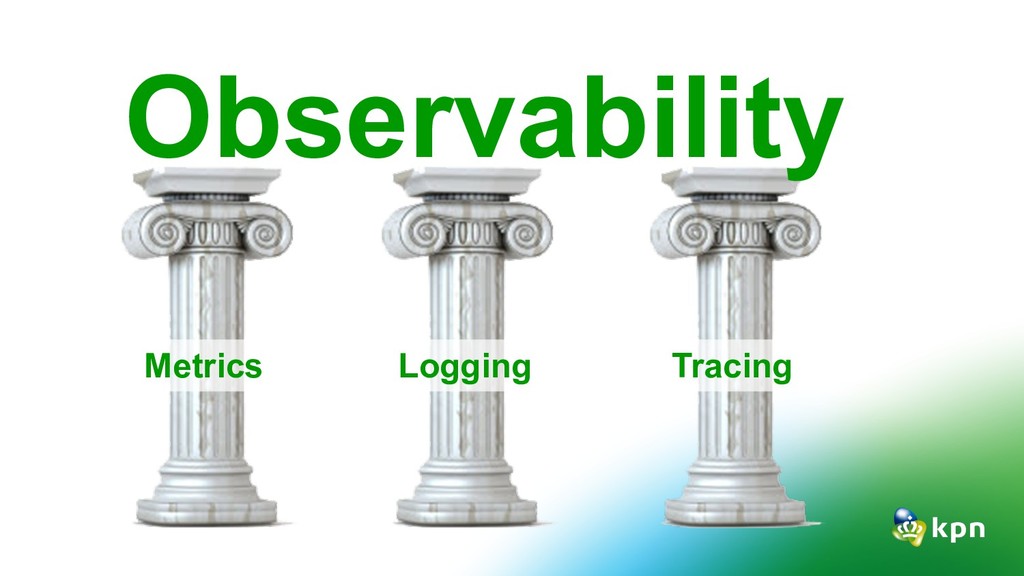
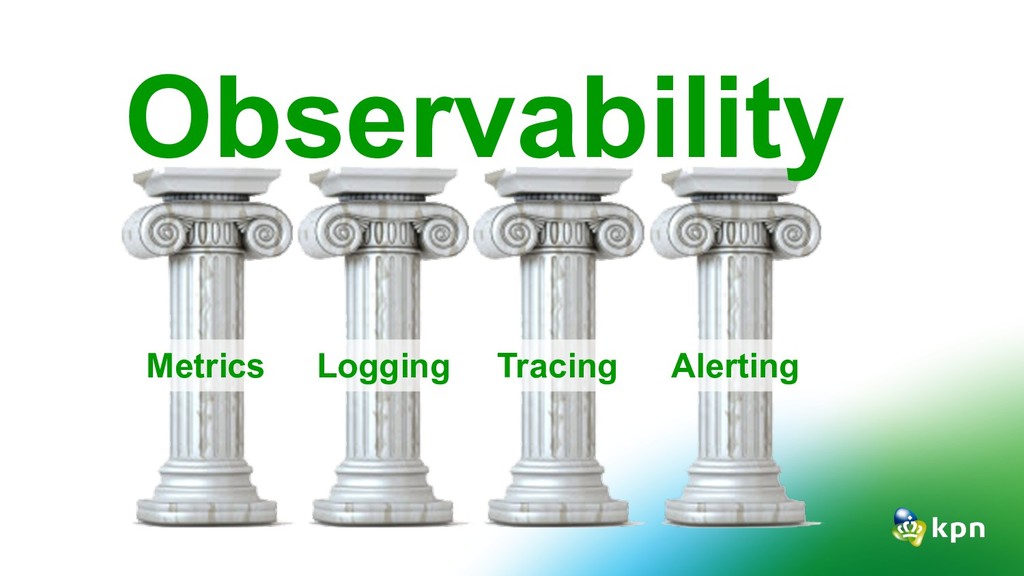
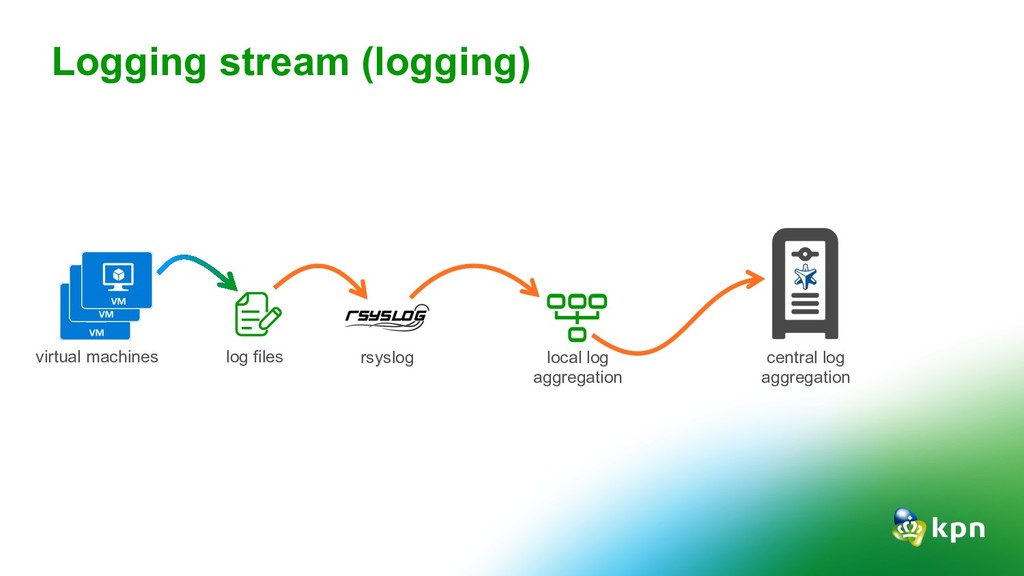
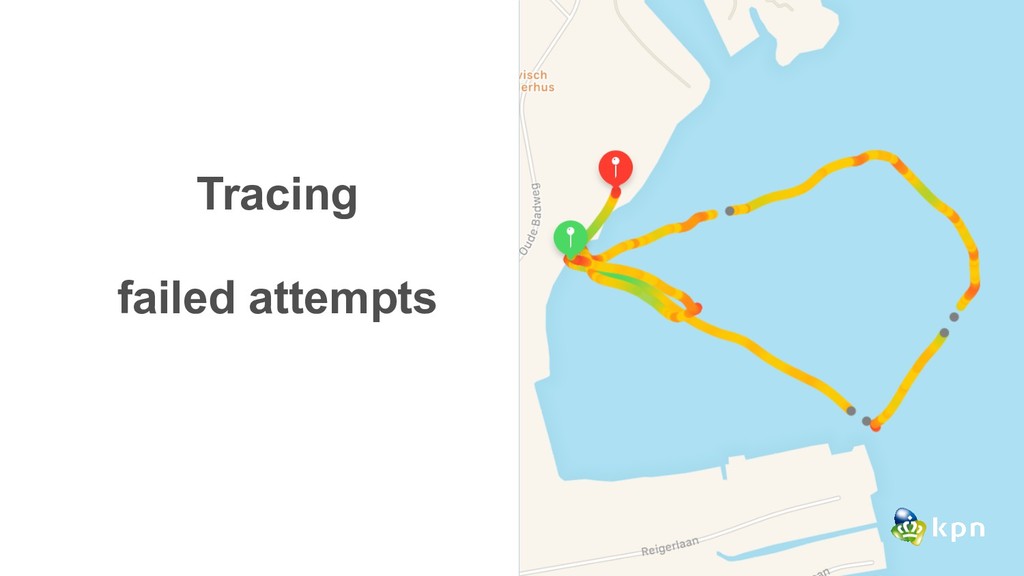
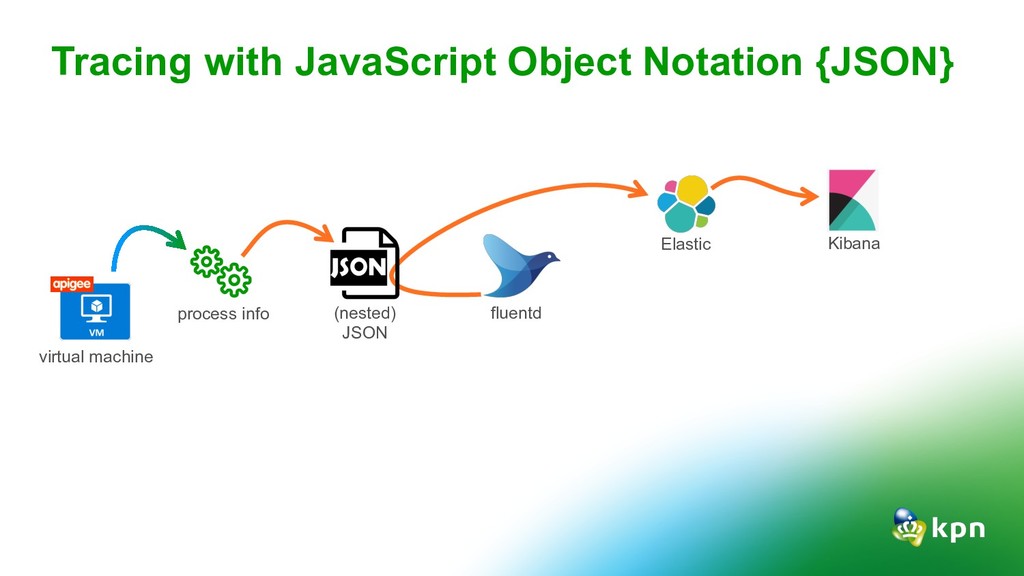
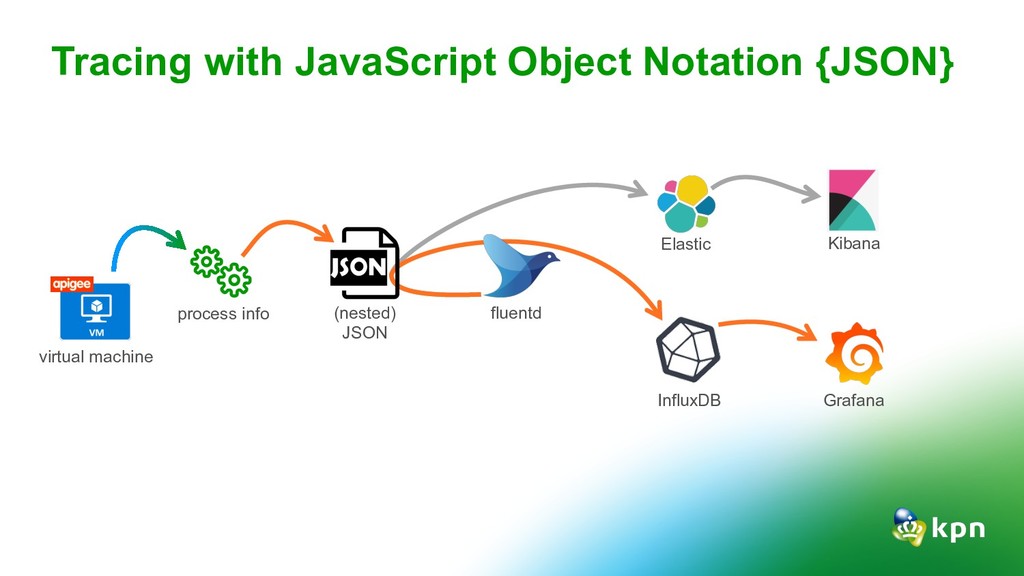
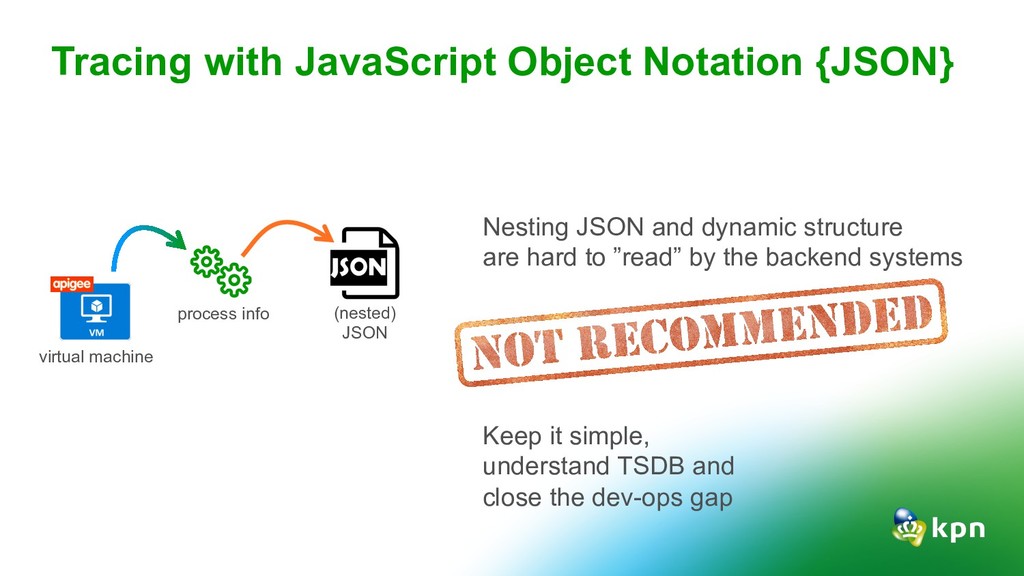
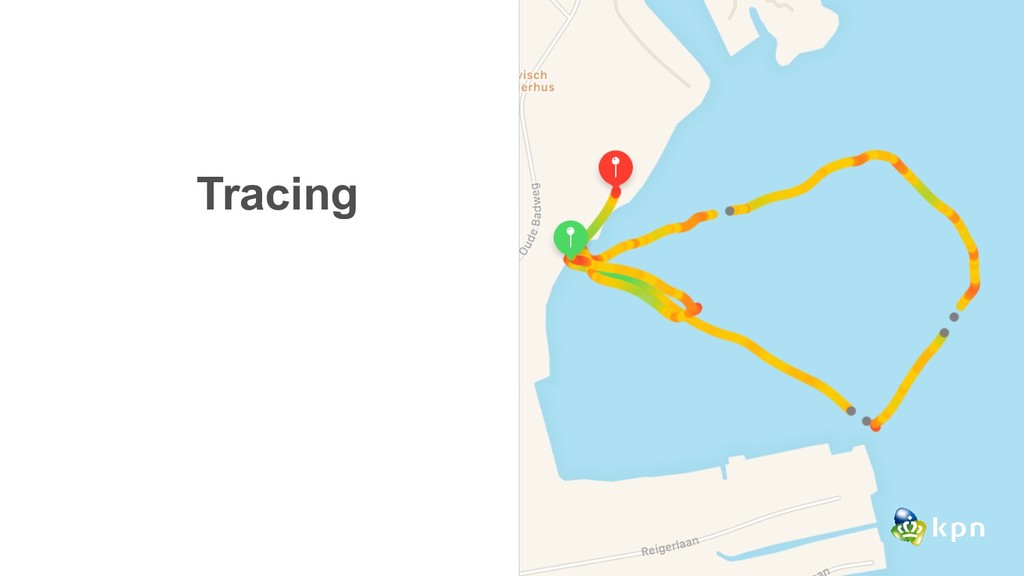
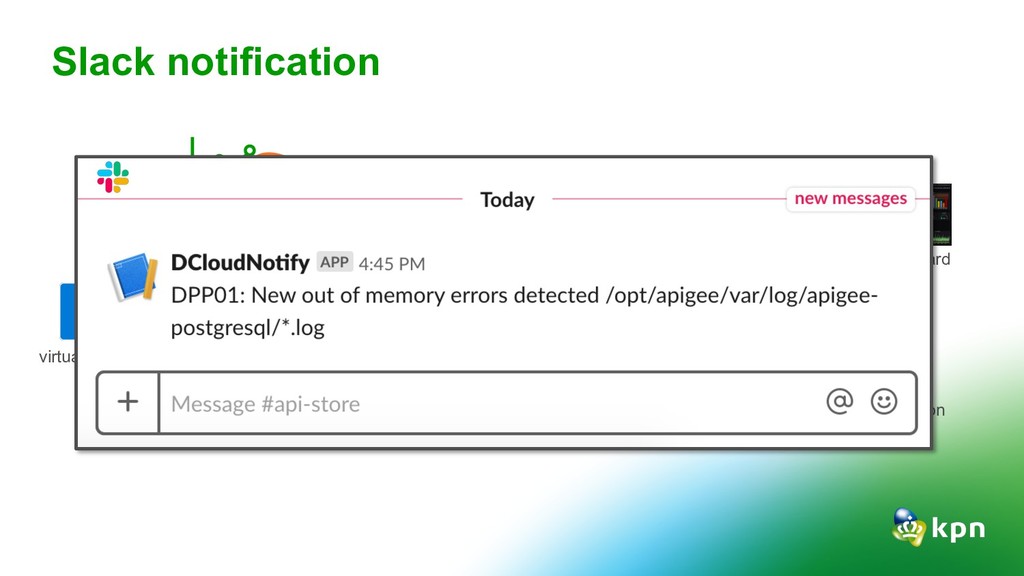
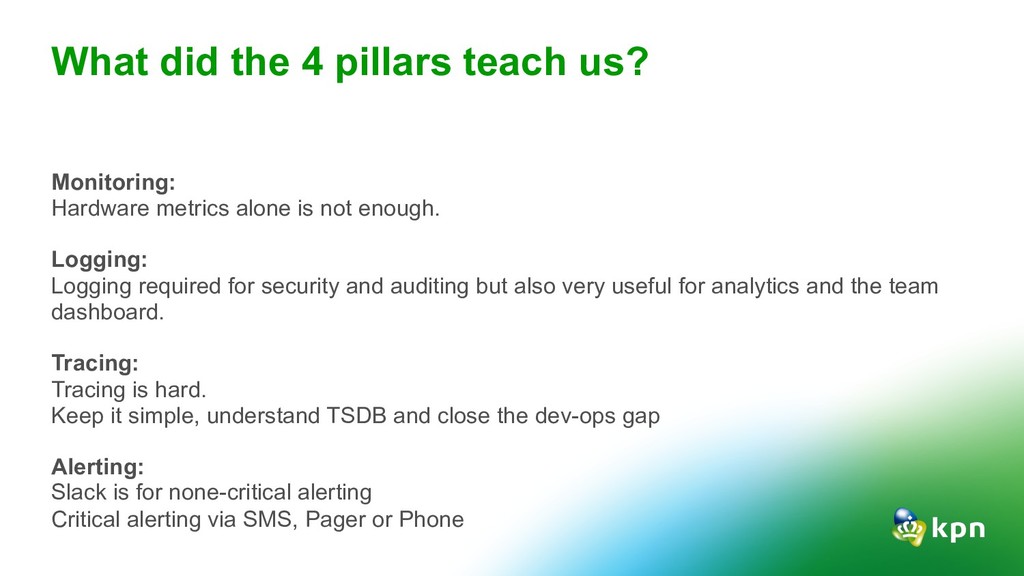
    for security and auditing but also very useful for analytics and the team dashboard. Tracing: Tracing is hard. Keep it simple, understand TSDB and close the dev-ops gap Alerting: Slack is for none-critical alerting Critical alerting via SMS, Pager or Phone What did the 4 pillars teach us?
  18. • Get a platform dashboard on-screen. • Beware of the

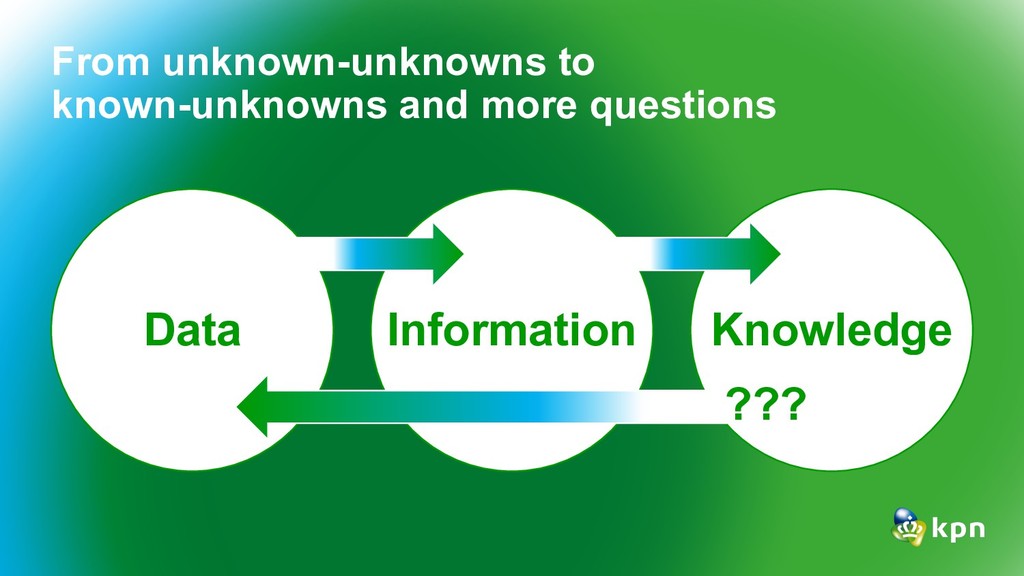
    anti-pattern of monitoring everything. • Understand the social and financial implications. • From unknown-unknowns to known-unknowns and more questions Observability lessons
  19. KPN: KPN API Store Medium: “Monitoring and Observability” O’Reilly: “Distributed

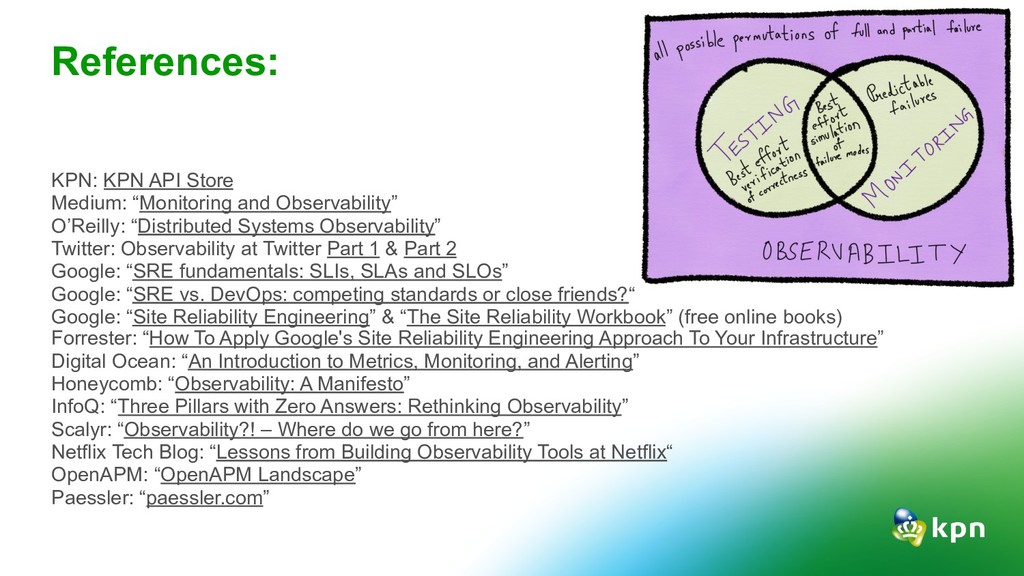
    Systems Observability” Twitter: Observability at Twitter Part 1 & Part 2 Google: “SRE fundamentals: SLIs, SLAs and SLOs” Google: “SRE vs. DevOps: competing standards or close friends?“ Google: “Site Reliability Engineering” & “The Site Reliability Workbook” (free online books) Forrester: “How To Apply Google's Site Reliability Engineering Approach To Your Infrastructure” Digital Ocean: “An Introduction to Metrics, Monitoring, and Alerting” Honeycomb: “Observability: A Manifesto” InfoQ: “Three Pillars with Zero Answers: Rethinking Observability” Scalyr: “Observability?! – Where do we go from here?” Netflix Tech Blog: “Lessons from Building Observability Tools at Netflix“ OpenAPM: “OpenAPM Landscape” Paessler: “paessler.com” References: