Upgrade to Pro — share decks privately, control downloads, hide ads and more …

Application monitoring with Prometheus

tnir
April 10, 2017

Application monitoring with Prometheus

A talk entitled "Application monitoring with Prometheus" for Prometheus Tokyo Meetup #1

tnir

April 10, 2017
Tweet

More Decks by tnir

Other Decks in Technology

Transcript

  1. @tnir / @tn961ir Takuya Noguchi Software Engineer (Digital Transformation for

    20yrs) GitLab contributor Organizer of Kamiyacho.k8s/GitLab Tokyo/Prometheus Tokyo Loves CNCF SRE/DevOps/Dev at iRidge, Inc.
  2. Prometheus Casual Talk (2016) # p r o m e

    t h e u s c a s u a l Casual Talk #1 6/14 (97 partipants) Casual Talk #2 11/10 w/Brian Brazil
  3. Prometheus Developed by SoundCloud since 2012 Inspired by Borgmon (Google's

    internal monitoring) Written in Go Accepted as 2nd project of CNCF (May 2016)
  4. Prometheus Architecture pull metrics HDD / SSD Pushgateway Short-lived jobs

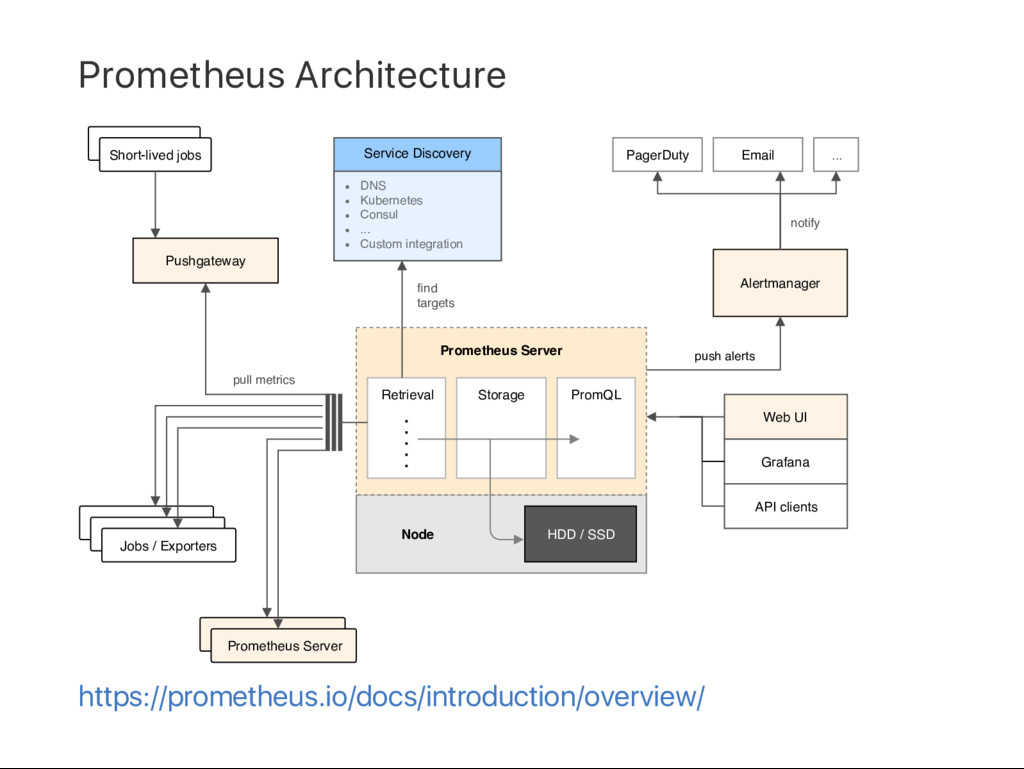
    Jobs / Exporters Storage Retrieval PromQL Prometheus Server Node Service Discovery find targets Prometheus Server Alertmanager push alerts Web UI Grafana API clients PagerDuty Email DNS Kubernetes Consul ... Custom integration notify ... https://prometheus.io/docs/introduction/overview/
  5. Installation https://prometheus.io/docs/introduction/install/ d o c k e r r u

    n - v / t m p / p r o m e t h e u s . y m l : / e t c / p r o m e t h e u s / p r o m e t h e u s . y m - p 9 0 9 0 : 9 0 9 0 p r o m / p r o m e t h e u s
  6. Cloud‑native monitoring "Let's go to SaaS!!!" DataDog https://www.quora.com/Is‑DataDog‑any‑good one for

    t2.micro? (50% monitoring cost) Stackdriver Monitoring Only for GCP/AWS AWS CloudWatch Only for AWS
  7. How can we monitor our system? Our apps Fully‑containerized apps

    (Docker) Deployed on Kubernetes Code‑hosted on GitLab Answer Prometheus
  8. GitLab and Prometheus Review Apps (inspired by Heroku) Each PR

    (MR) can be reviewed in CI environments We can see performance degradation in each commit.
  9. Architecture GitLab ‑‑> Prometheus ‑‑> Kubernetes SD k u b

    e r n e t e s _ s d _ c o n f i g ‑‑> Kubernetes ‑‑> containers
  10. node_exporter https://github.com/prometheus/node_exporter n o d e _ e x p

    o r t e r provides machine metrics (OS, CPU, Mem)
  11. Monitoring applications with Prometheus GitLab now has Prometheus integration. Requirements

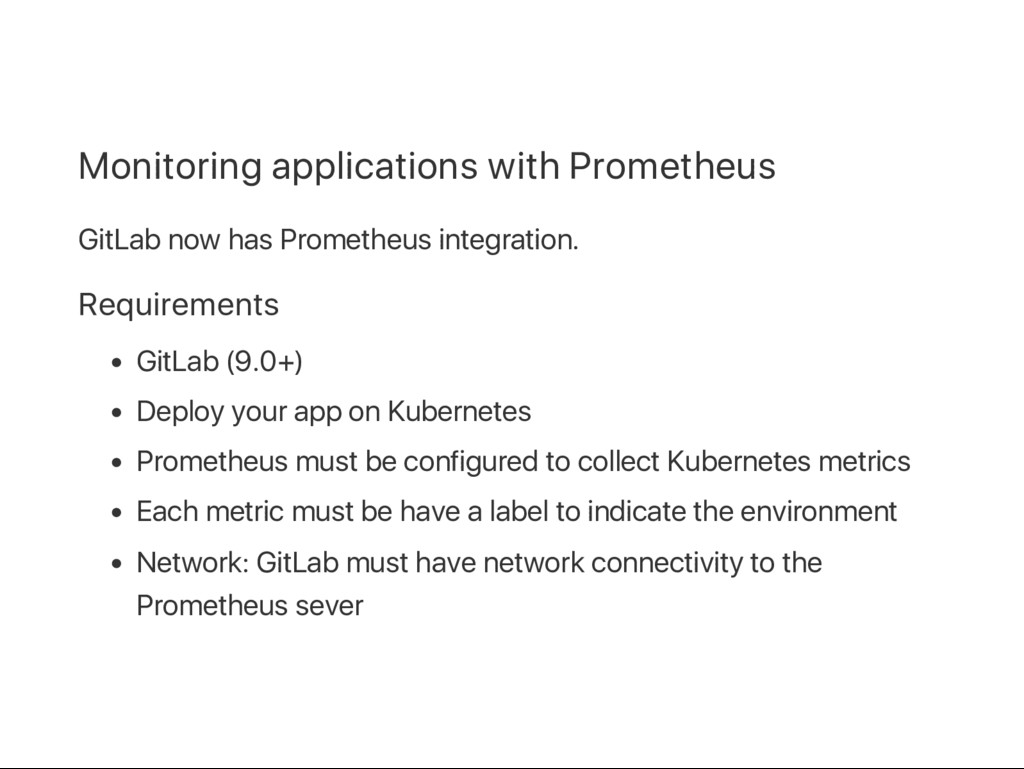
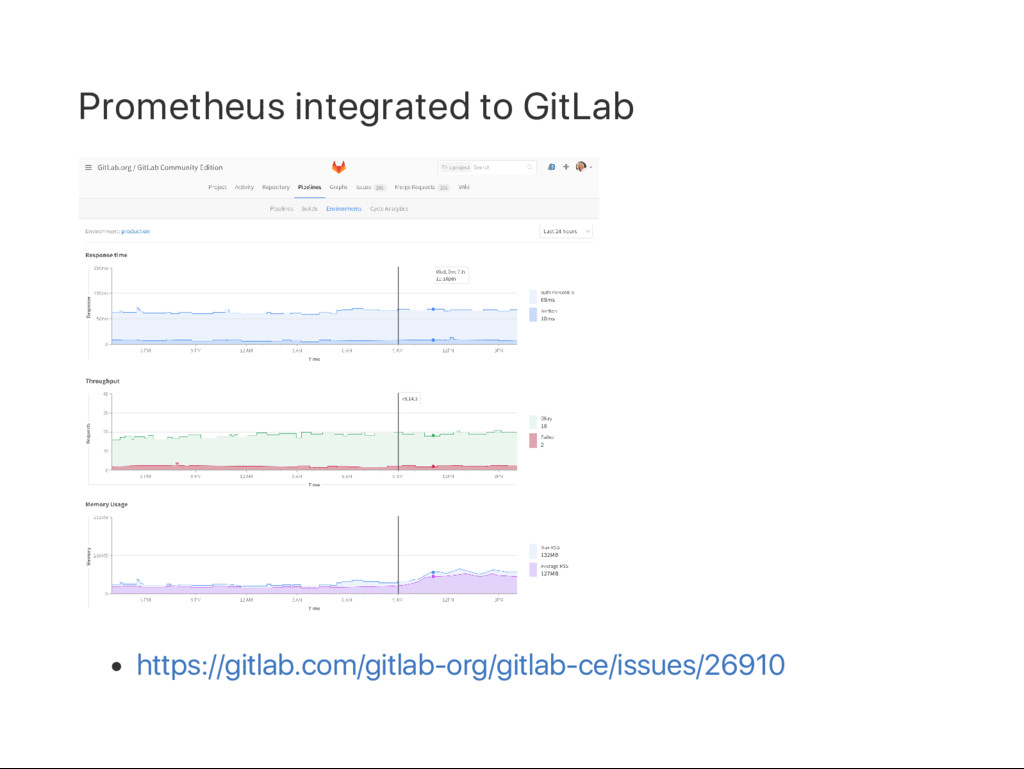
    GitLab (9.0+) Deploy your app on Kubernetes Prometheus must be configured to collect Kubernetes metrics Each metric must be have a label to indicate the environment Network: GitLab must have network connectivity to the Prometheus sever
  12. Kubernetes Service Discovery Kubernetes Service Discovery is still in beta

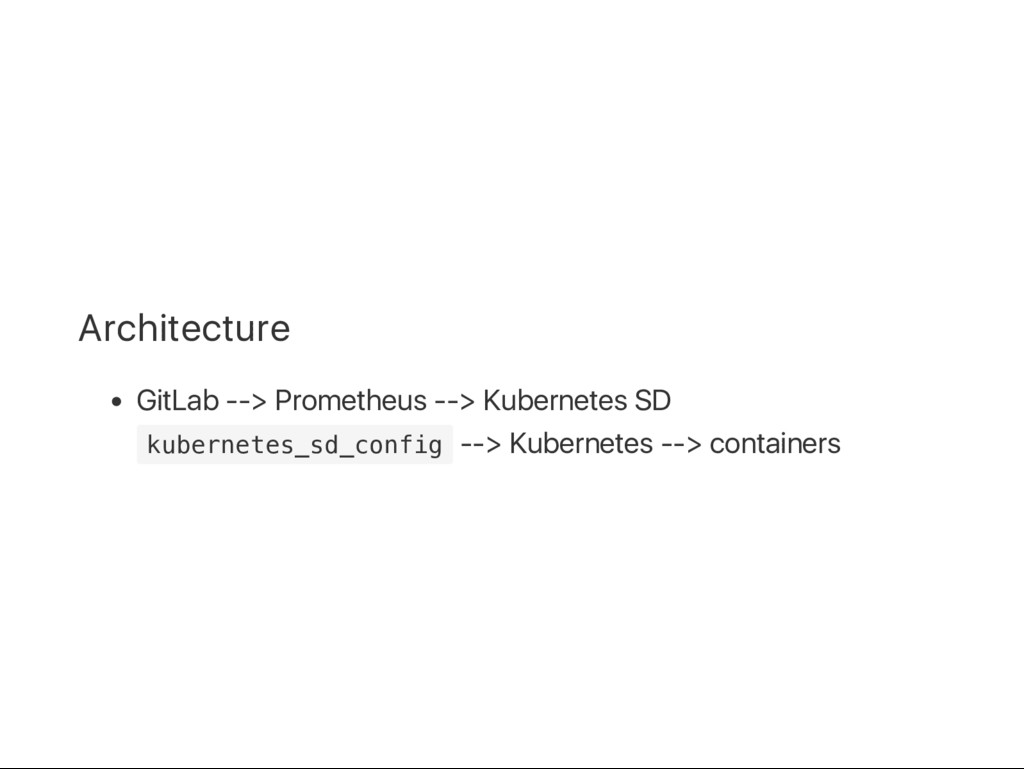
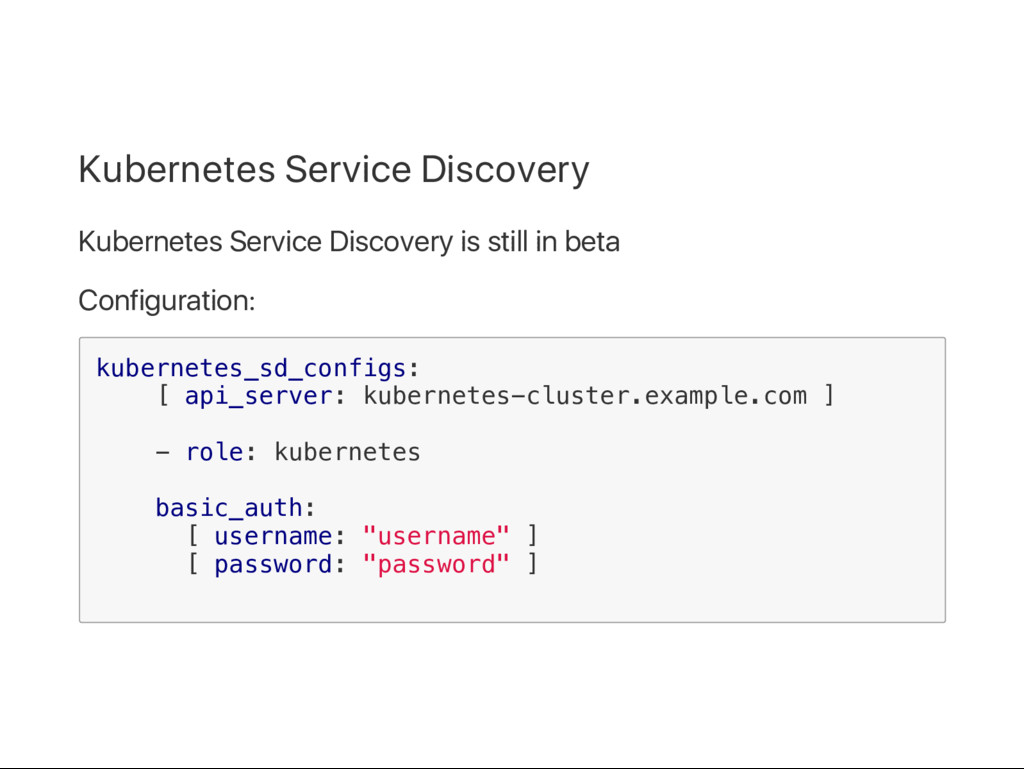
    Configuration: k u b e r n e t e s _ s d _ c o n f i g s : [ a p i _ s e r v e r : k u b e r n e t e s - c l u s t e r . e x a m p l e . c o m ] - r o l e : k u b e r n e t e s b a s i c _ a u t h : [ u s e r n a m e : " u s e r n a m e " ] [ p a s s w o r d : " p a s s w o r d " ]
  13. Summary GitLab: Easier way to monitor your apps on Kubernetes

    with Prometheus but still under development APM will be archived with Prometheus. Let us know use cases in Tokyo & Japan.