Share
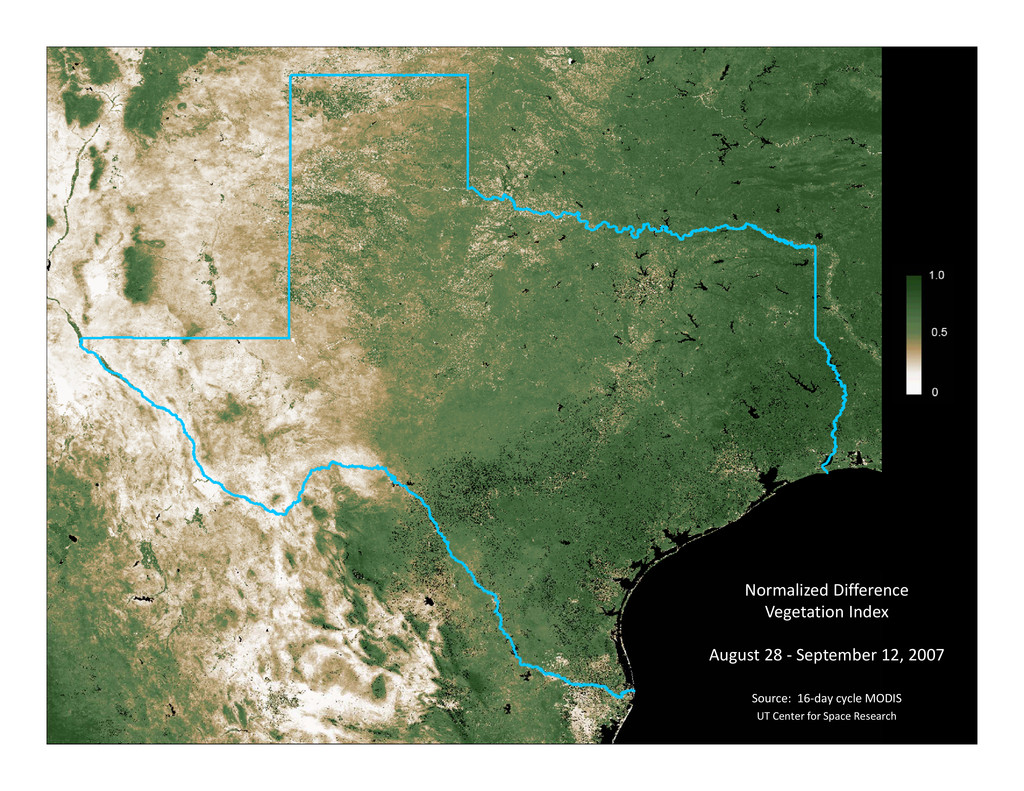
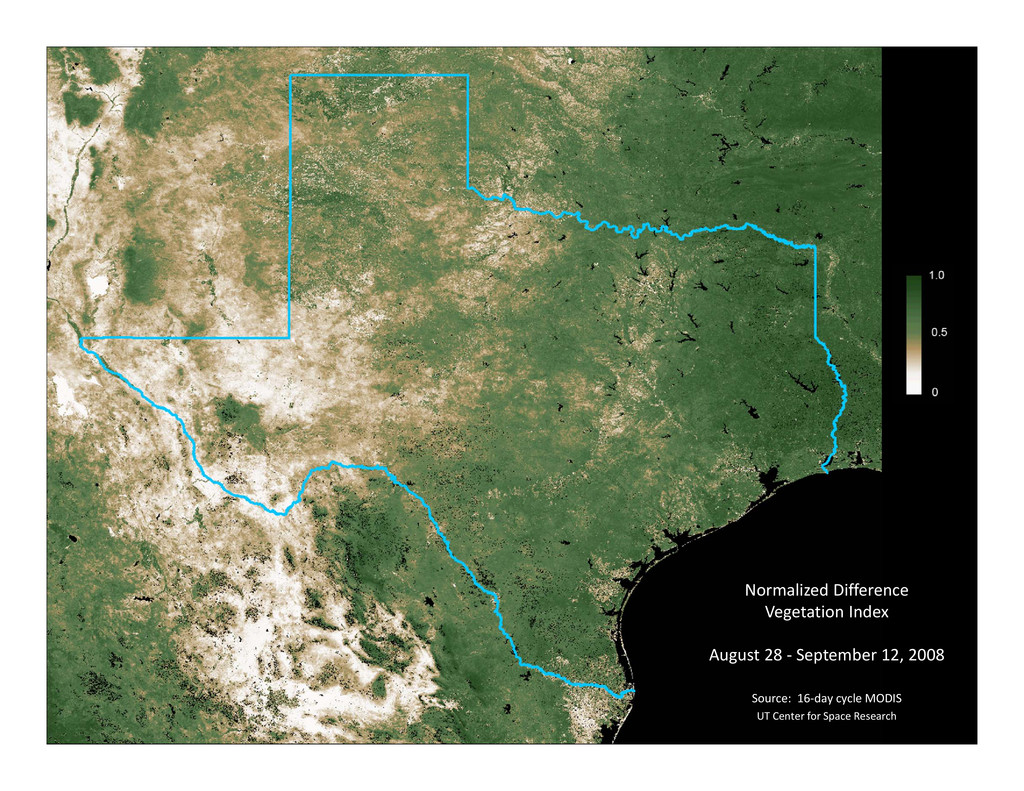
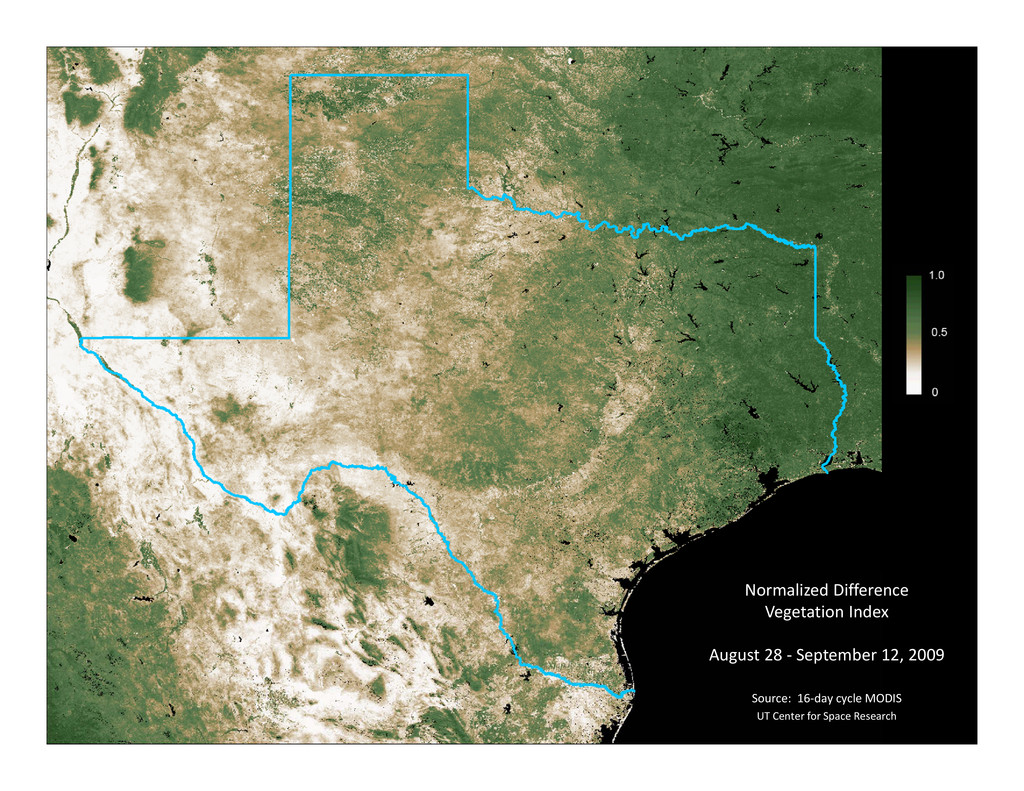
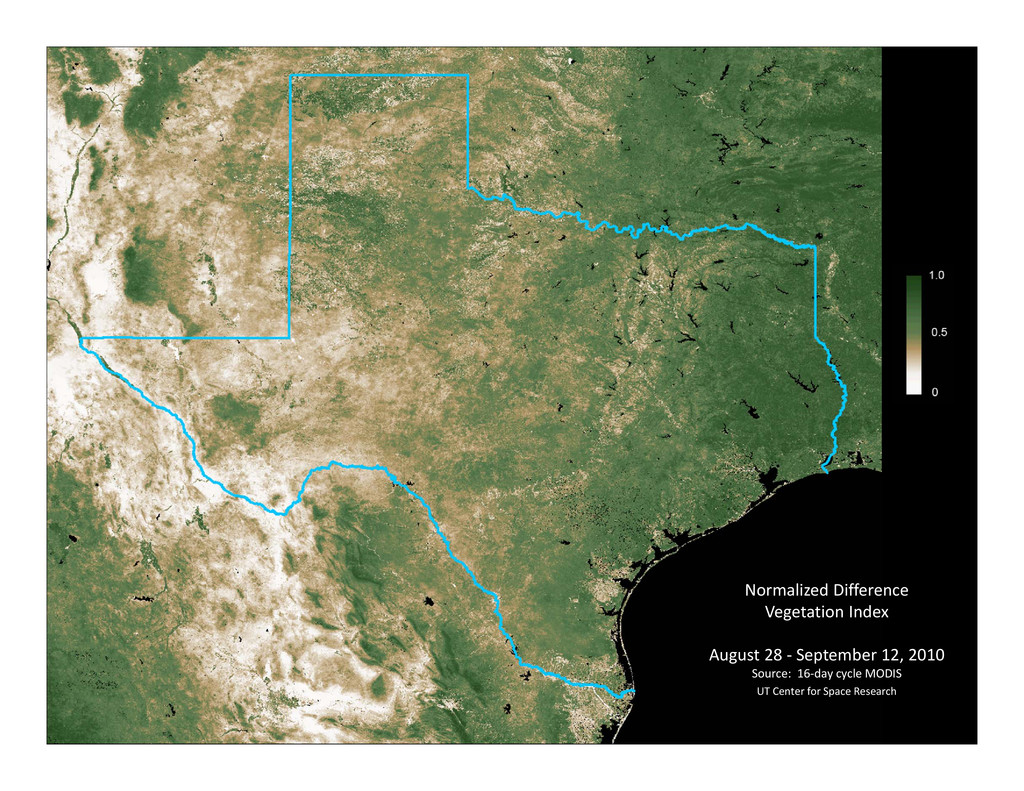
Teresa Howard, Gordon Wells, Solar Smith & Larry Teng The University of Texas at Austin Center for Space Research
![THANK YOU! Contact: Teresa Howard [email protected] http://goodnight.corral.tacc.utexas.edu/CSR/Public/NDVI‐MODIS/](https://files.speakerdeck.com/presentations/50805936b096bf000204d493/slide_48.jpg)