Upgrade to Pro — share decks privately, control downloads, hide ads and more …

Fitts' Law - Touch vs Click

Mudit Gupta
October 15, 2012

Fitts' Law - Touch vs Click

Comparing Fitts' law for Touch vs Click targets

Mudit Gupta

October 15, 2012
Tweet

More Decks by Mudit Gupta

Other Decks in Research

Transcript

  1. Phases of Experiment Concept/Question Design of Experiment Implementation in HW/SW

    Data Collection Analysis of Data: Stats and Visualizations Conclusions Improvements and future work
  2. Concept Game Grid spot Angry Birds Duckhunt Bubble burst Game

    Grid spot Angry Birds Duckhunt Bubble burst How does Mouse compare to Touch Screen?
  3. Questions to Answer Moving a mouse is a 2D task,

    touch is 3D. Is 3D harder to decide and complete because of this? What situations is a mouse better than touch input or vice versa.
  4. Design Independent Variables 60px 30px 250px 125px Touch Mouse Size

    of Target Distance from current to next Input Mode Dependent Variables Movement Time
  5. Screen and Software Platform Resolution: 1024 x 600 px Browser:

    Firefox Language: HTML5 Canvas / JQuery Events
  6. Hardware Specs Asus Transformer Infinity Touch Screen Android Tablet supported

    touch and mouse interaction manipulate input mode control all other interface factors:
  7. Methods of control Same Hardware for all trials Same Environment

    for all trials Fixed order of Size and Distance conditions Grid layout to restrict target placement Randomization of direction
  8. a. Participant selects one input mode first (mouse/touch) b. 240

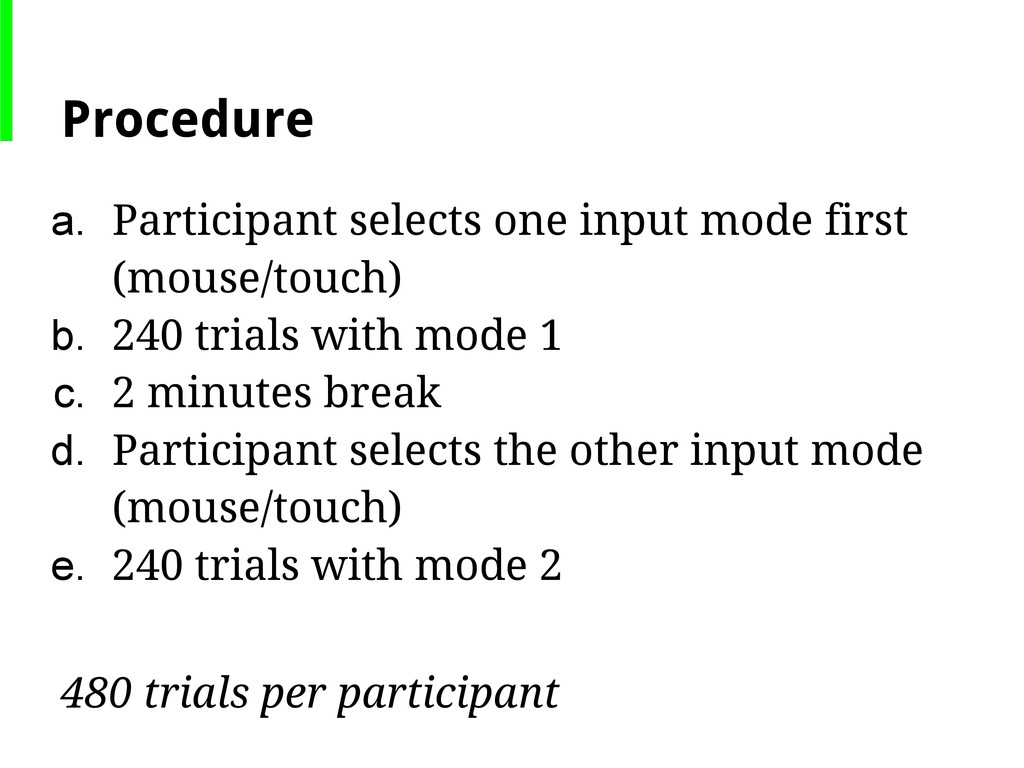
    trials with mode 1 c. 2 minutes break d. Participant selects the other input mode (mouse/touch) e. 240 trials with mode 2 480 trials per participant Procedure
  9. Implementation Size & Distance combinations are preset, in a list.

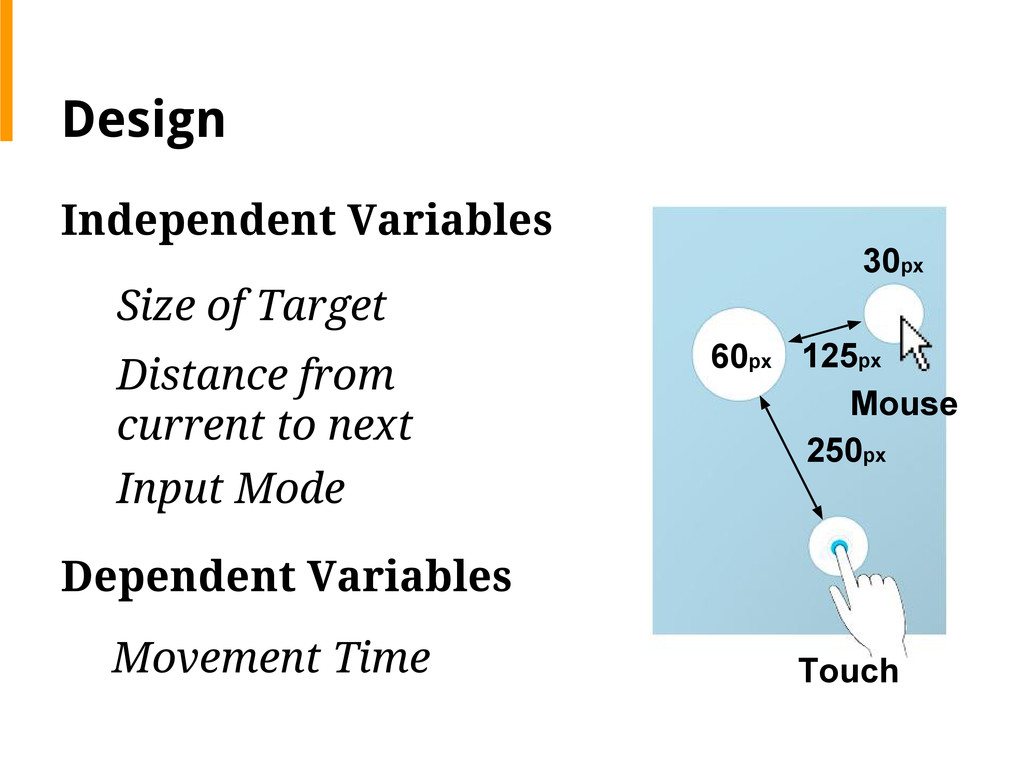
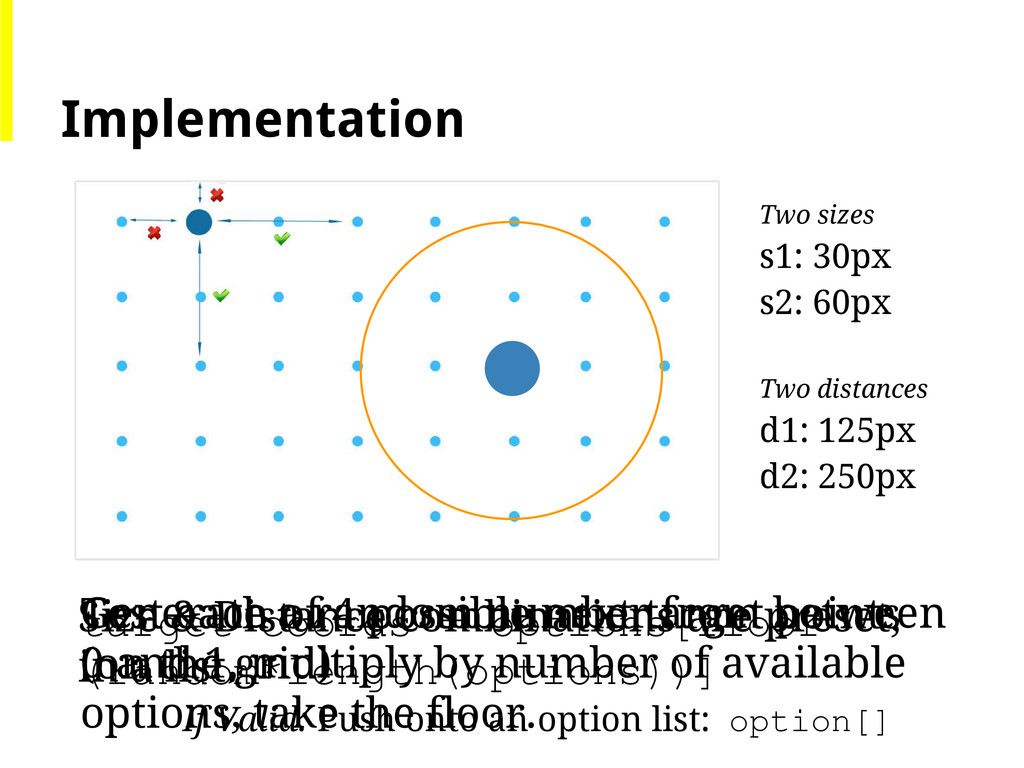
    Test each of 4 possible next target points (on the grid) If Valid: Push onto an option list: option[] Generate a random number from between 0 and 1, multiply by number of available options, take the floor. target coords = options[floor (random*length(options))] Two sizes s1: 30px s2: 60px Two distances d1: 125px d2: 250px
  10. State Diagram Hit Hit start timer & show next target

    Miss success, time logged fail, time logged show start target
  11. Data written to a CSV file User ID, Mode, Size,

    Distance,Time elapsed between clicks, Result
  12. • Want deliberate activity ◦ removed outliers based on aggregate

    stats ◦ Calculated Standard Dev ◦ Removed data outside 2 SD • Removal of response times below 200 ms Data Treatment
  13. mode (N) failures failure rate (1) mouse (1200) 34 2.83%

    touch (1680) 141 9.17% (1) Failure is a mistake on a first attempt at a target. Failure Counts
  14. Raw Statistical Data: Mouse Linear Regression: 151.98x + 821.10 Pearson's

    Correlation Coefficient: r = 0.201 2-tailed P value: 4.413e-12
  15. Linear Regression: 181.71x + 696.64 Pearson's Correlation Coefficient: r =

    0.211 2-tailed P value: 8.0293e-10 Raw Statistical Data: Touch Screen
  16. mode (N) a (ms) b (ms/bit) IP (bits/s) mouse (1166)

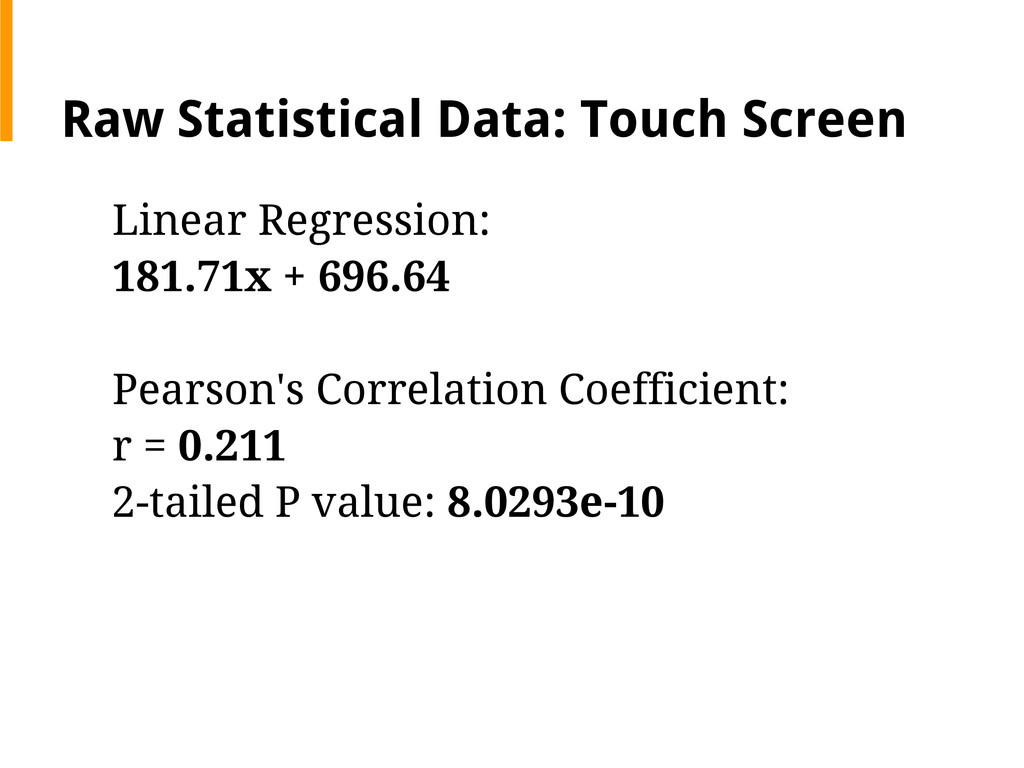
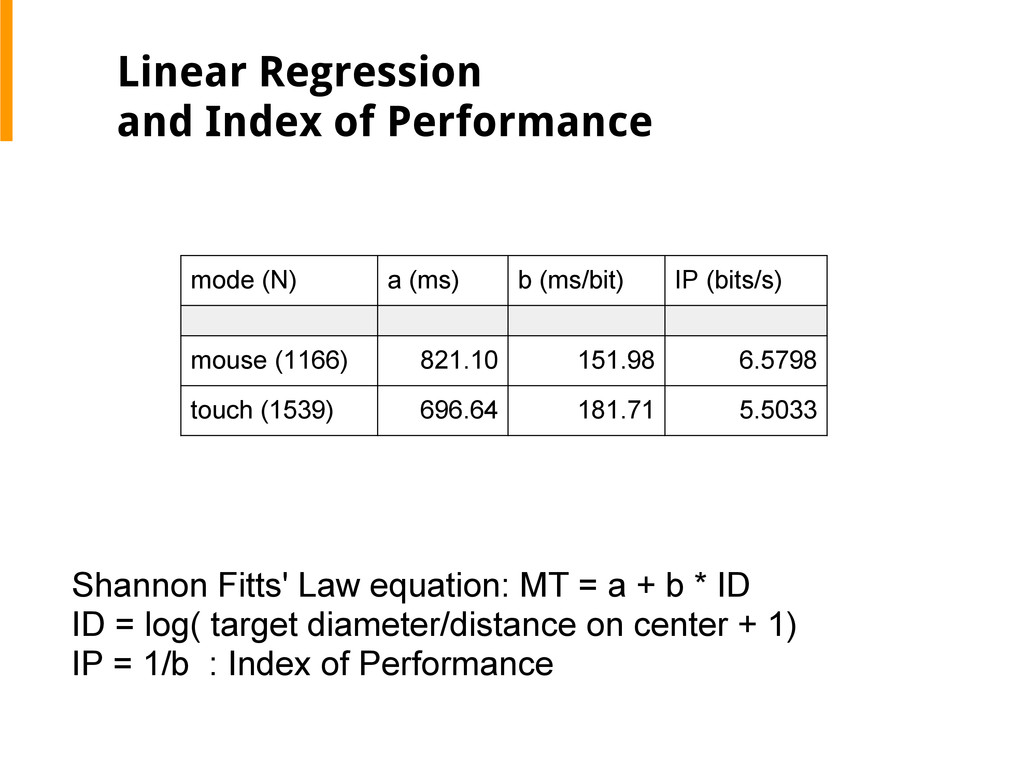
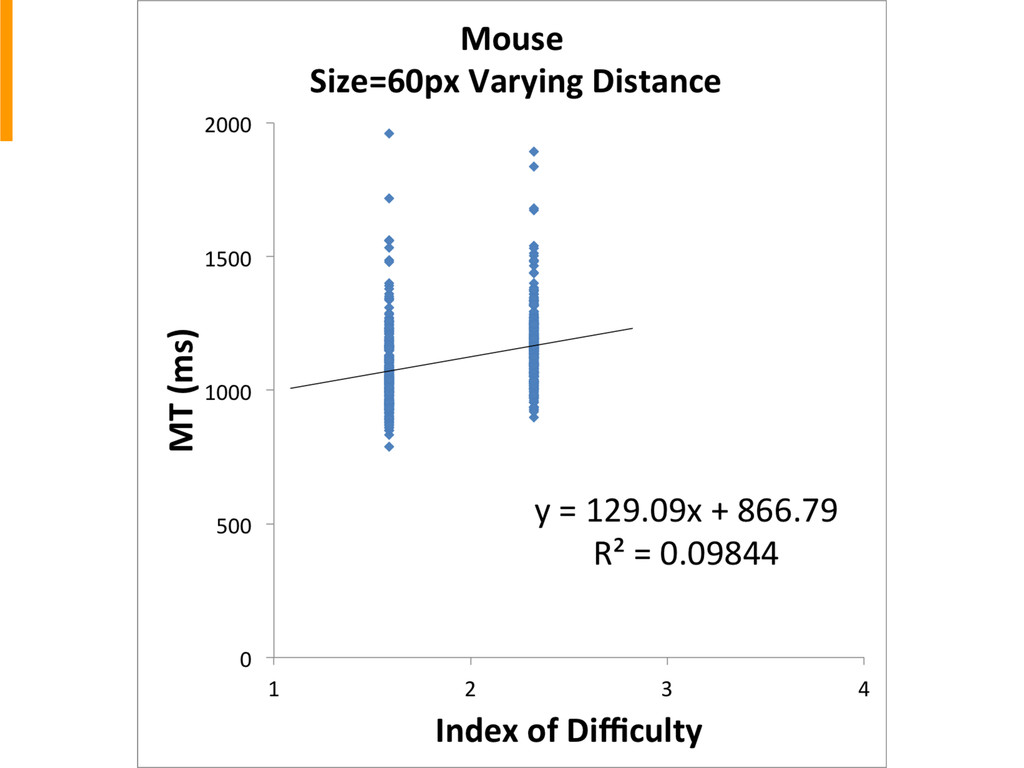
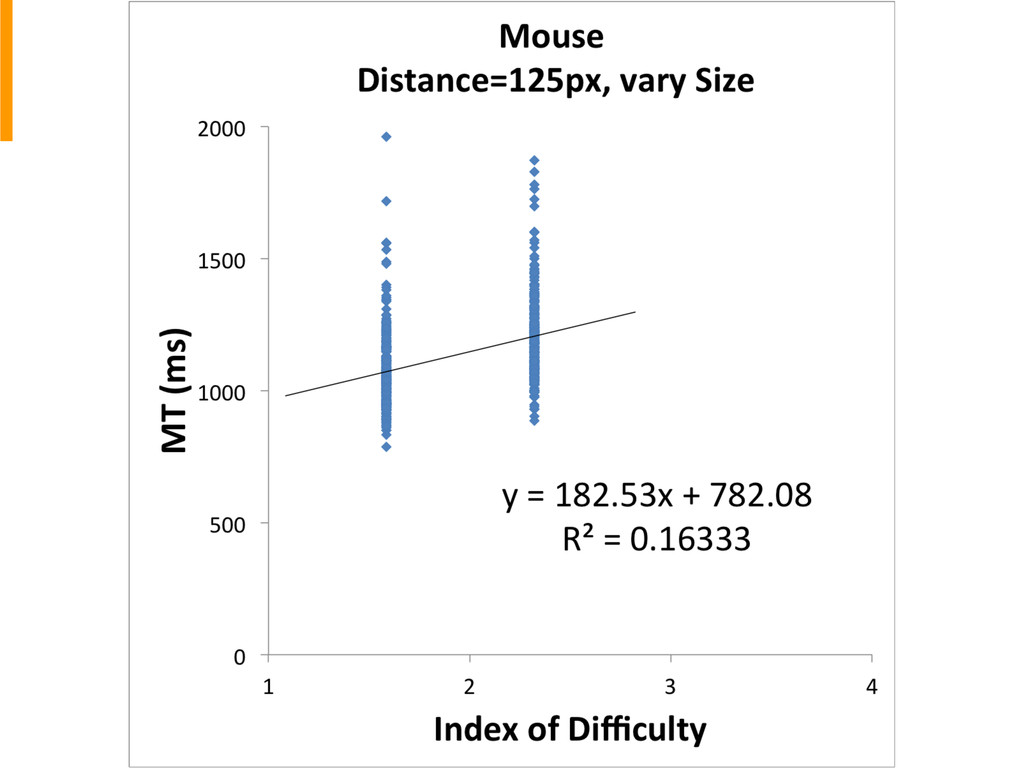
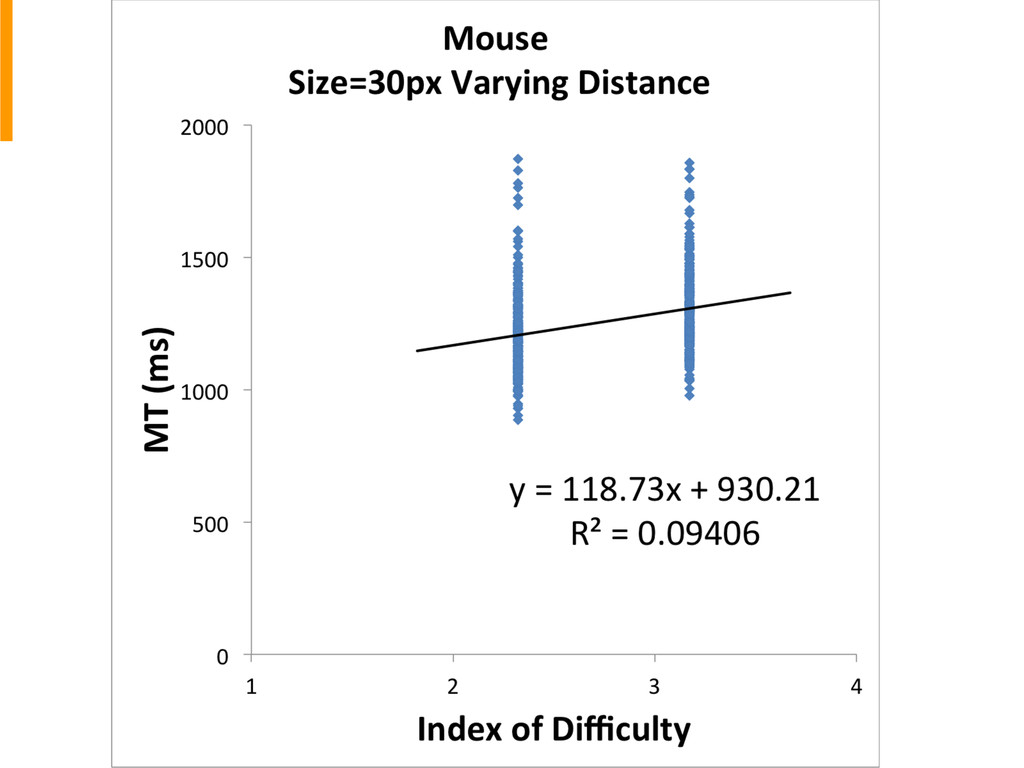
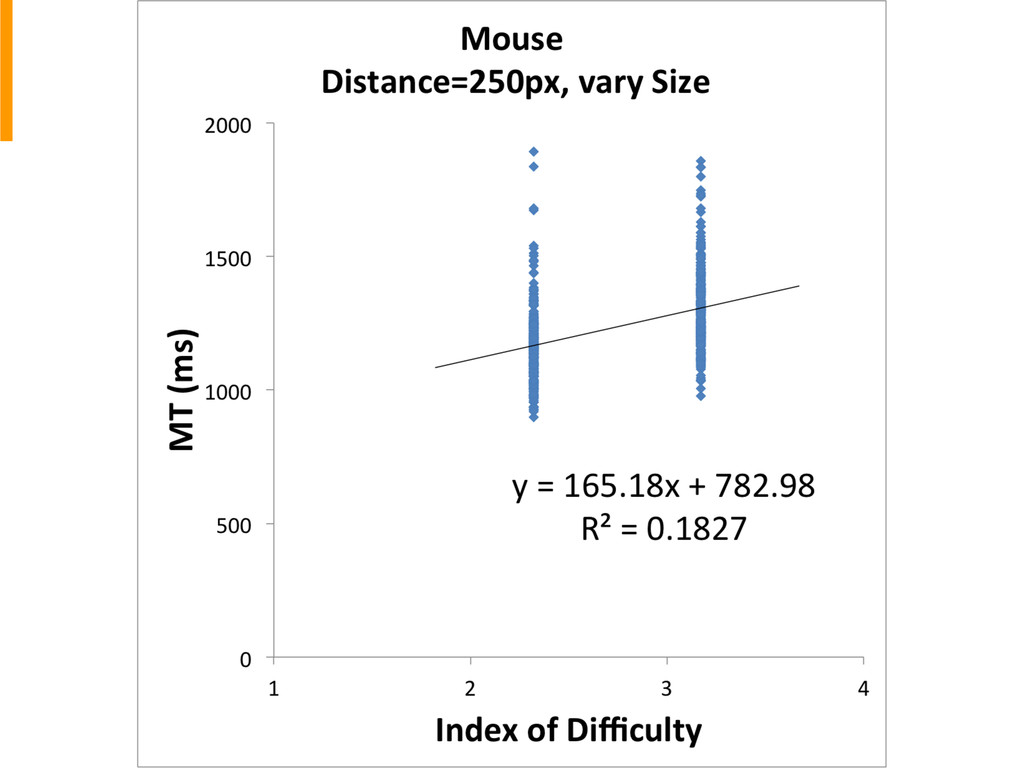
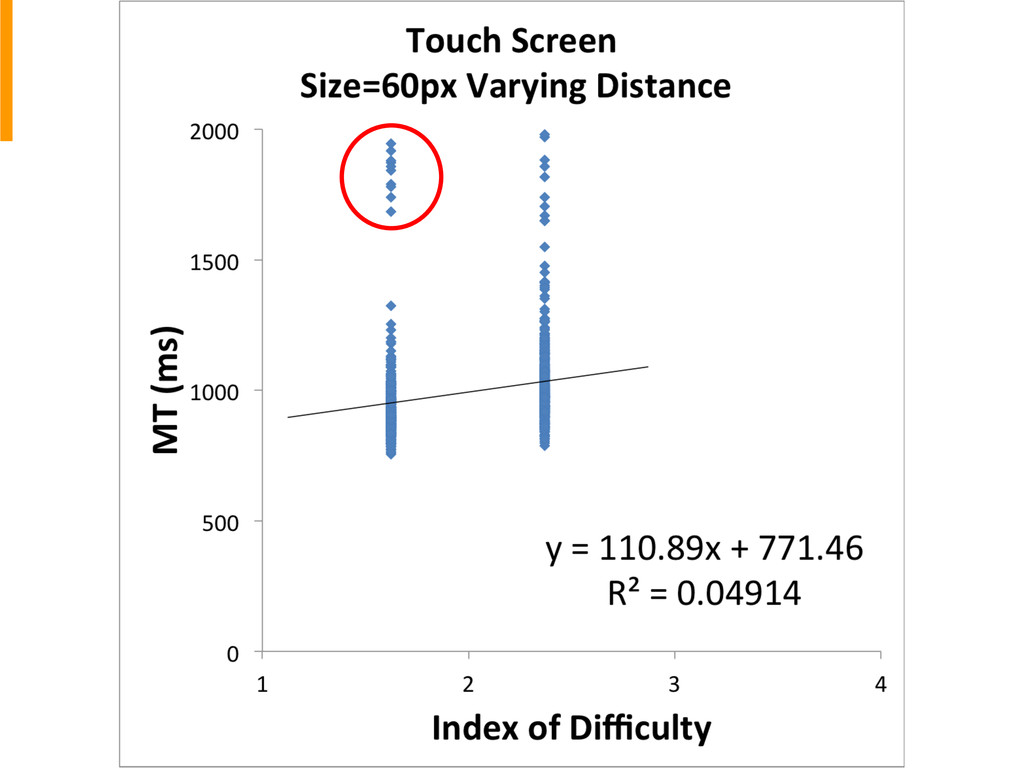
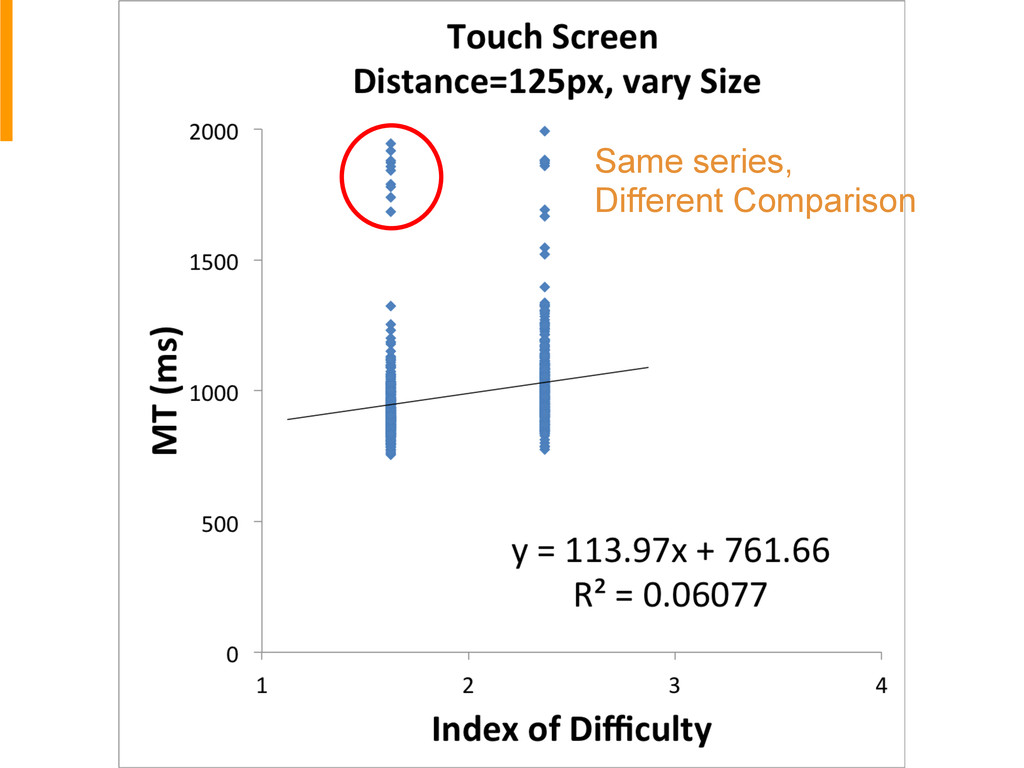
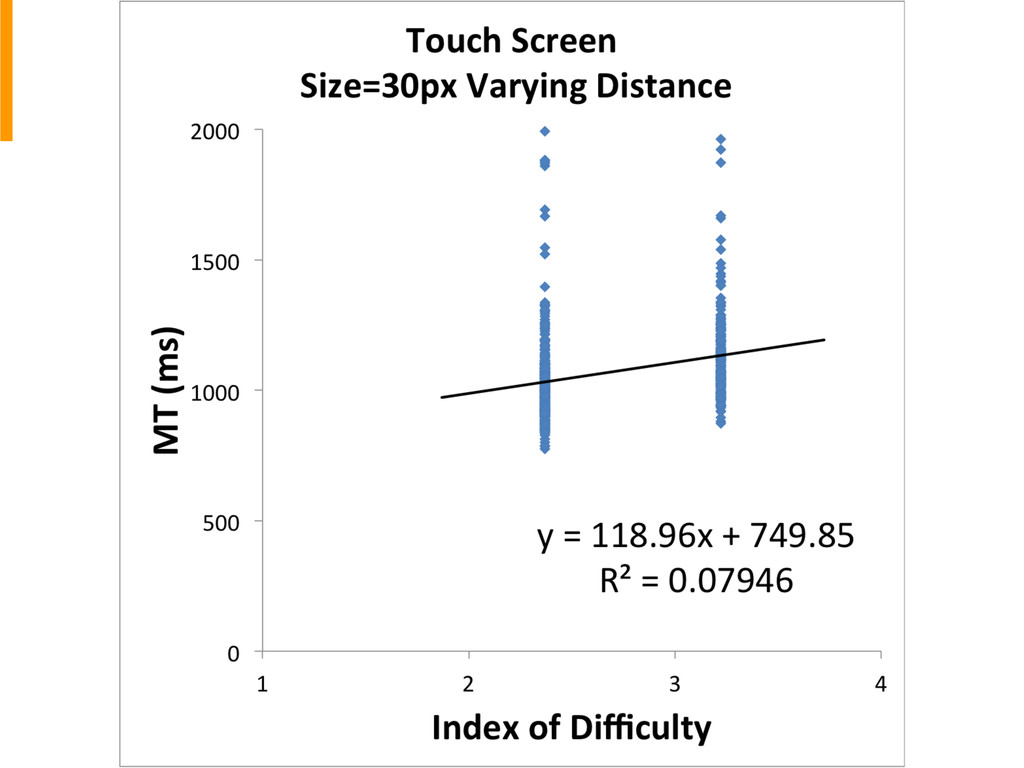
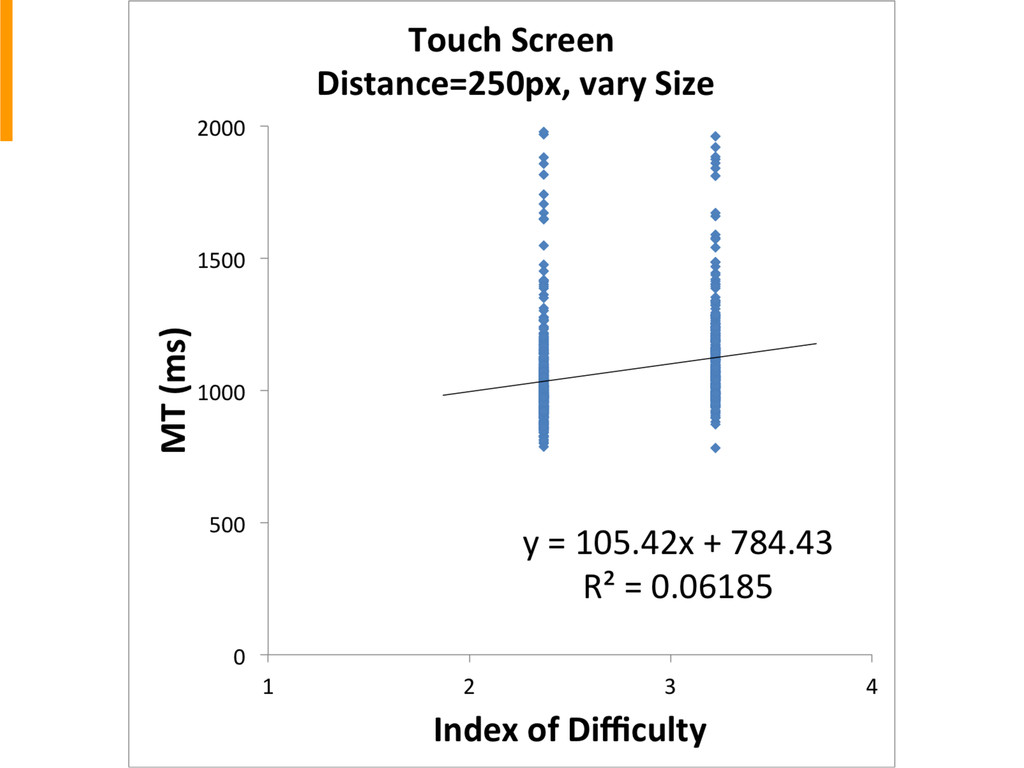
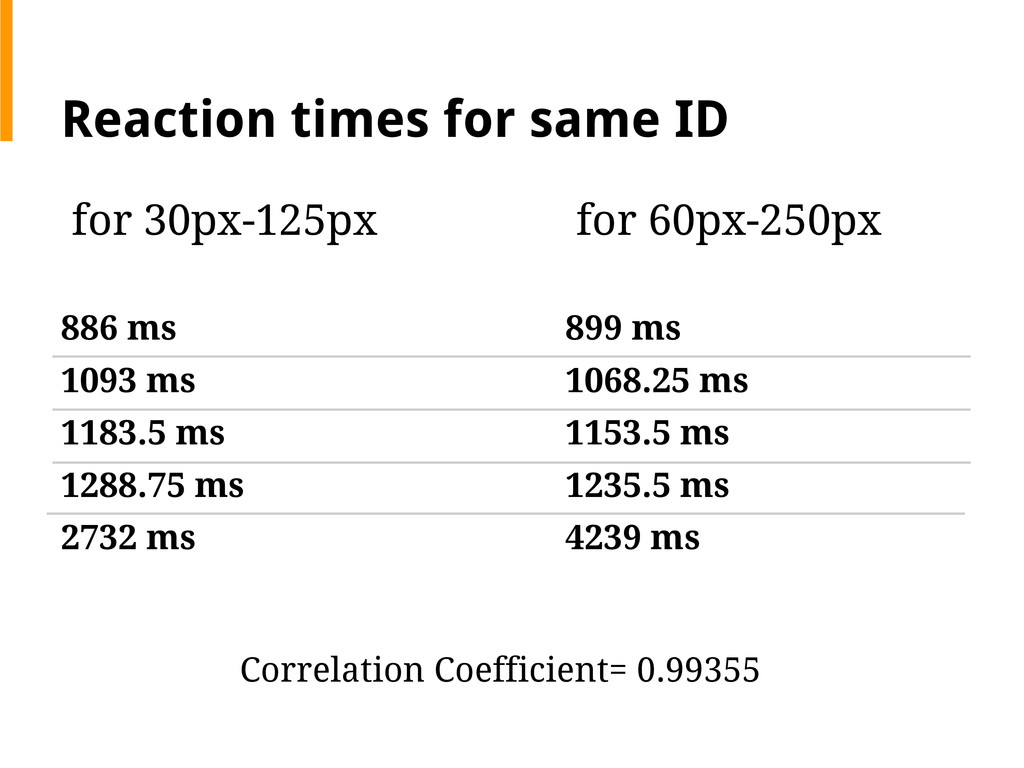
    821.10 151.98 6.5798 touch (1539) 696.64 181.71 5.5033 Shannon Fitts' Law equation: MT = a + b * ID ID = log( target diameter/distance on center + 1) IP = 1/b : Index of Performance Linear Regression and Index of Performance
  17. M T

  18. M T

  19. size distance R2 a (ms) b (ms/bit) IP (bits/s) Mouse

    60 0.098 866.79 129.09 5.2383 30 0.094 930.21 118.73 8.4225 125 0.163 782.08 182.53 5.4786 250 0.183 782.98 165.18 6.0540 Touch Screen 60 0.049 771.46 110.89 9.0179 30 0.079 761.66 113.97 8.7742 125 0.061 749.85 118.96 8.4062 250 0.062 784.43 105.42 9.4859 Comparison of Regression Coefficients
  20. Reaction times for same ID for 30px-125px 886 ms 1093

    ms 1183.5 ms 1288.75 ms 2732 ms for 60px-250px 899 ms 1068.25 ms 1153.5 ms 1235.5 ms 4239 ms Correlation Coefficient= 0.99355
  21. Procedural Weaknesses • Fatigue from trials. • Orientation of Touch

    Surface. • Random target locations sometimes occur under hand, hidden from view • Lab Distractions • Assumed everyone would try their best.
  22. More Confounds • No mouse/touch order protocol. • Within Participant

    Sequence Effects • Mouse Sensitivity • Touch Issues: ◦ Touch sometimes not registered by browser. ◦ Targets hidden by hand ◦ Palm Rejection
  23. Interesting Observations • Low coefficient of determination for all samples

    • Touch mode = more failures but faster lower index of performance • Mouse mode = lower failure higher index of performance
  24. Conclusion Touch based interactions are more appropriate where lower response

    time is expected but accuracy could be compromised Mouse pointer interactions are more suitable for tasks that prioritize accuracy over speed
  25. Future Work • Larger sample size with a wider range

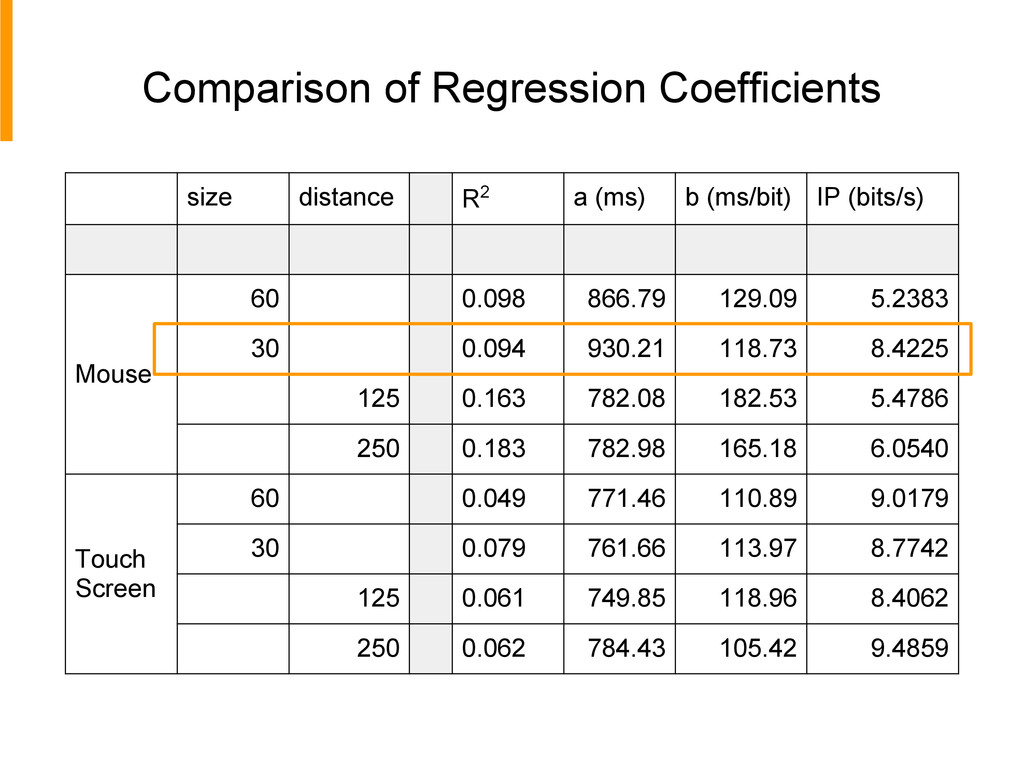
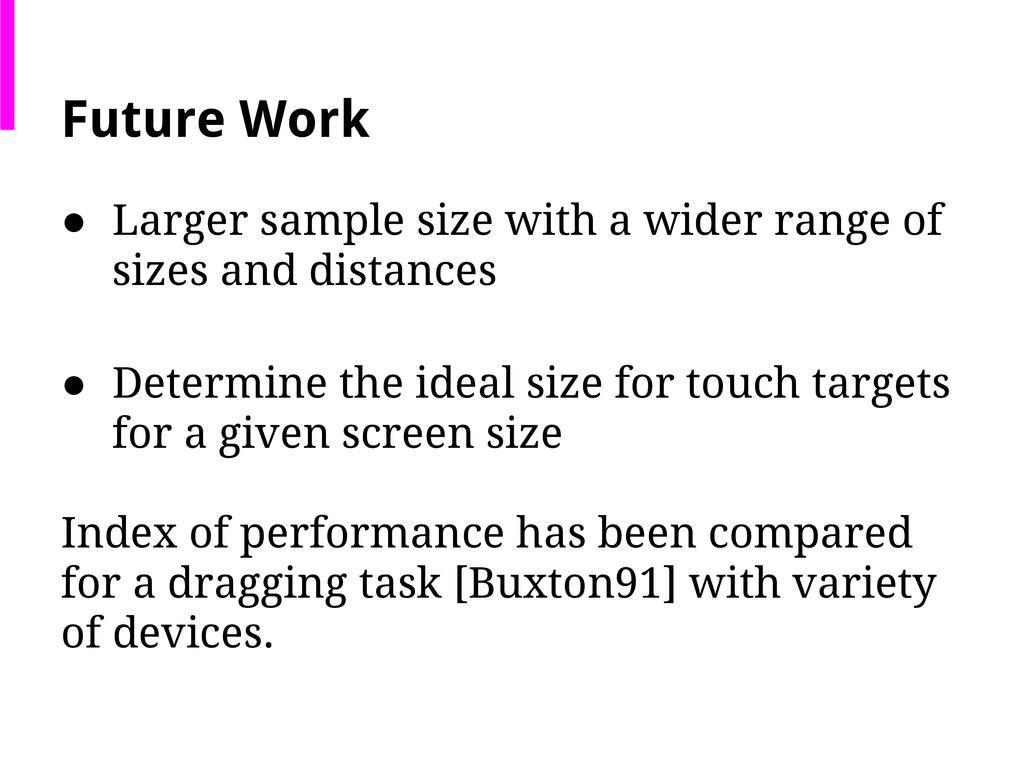
    of sizes and distances • Determine the ideal size for touch targets for a given screen size Index of performance has been compared for a dragging task [Buxton91] with variety of devices.