Upgrade to Pro — share decks privately, control downloads, hide ads and more …

Profiling .NET Server Applications

Profiling .NET Server Applications

Profiling .NET Server Applications Talk on Umbraco
UK Festival 2015, London, UK

Tugberk Ugurlu

October 30, 2015
Tweet

More Decks by Tugberk Ugurlu

Other Decks in Programming

Transcript

  1. Profiling .NET Server
    Applications
    Tugberk Ugurlu
    Redgate Software
    @tourismgeek
    http://tugberkugurlu.com

    View Slide

  2. tugberkugurlu.com

    View Slide

  3. @tourismgeek

    View Slide

  4. View Slide

  5. View Slide

  6. @redgate
    @RedGateCareers
    red-gate.com/careers

    View Slide

  7. Agenda
    • Nature of Server Applications
    • Profiling Application Logs and Server
    • Profiling Performance Problems
    • Profiling Memory Problems
    • Load Testing

    View Slide

  8. Server Applications
    • Applications Runs under IIS
    • Windows Services
    • Self-hosted Web Applications
    • Worker processes

    View Slide

  9. Characteristics of Server Applications
    • Stateless
    • Multiple Instances
    • Concurrent
    • Spreaded and Connected
    • Multiple Versions at the Same Time

    View Slide

  10. v1api.example.com v1api.example.com
    DB
    Worker-1
    Worker-2 Worker-3 Worker-4
    Message Queue System
    v2api.example.com v1api.example.com

    View Slide

  11. “Sometimes, you need all the connected
    process data to identify the problem.

    View Slide

  12. Logging
    • Rich Logging
    • Application Logs
    • Server Logs
    • Storing the Logs (Elasticsearch)
    • Centralized Logging (Logstash)
    • Analysing the logs (Kibana)
    • Log correlation

    View Slide

  13. Logging - Log Correlation

    View Slide

  14. DEMO TIME

    View Slide

  15. Application Performance Profiling
    • Identifying the problem
    • Pining the problem down

    View Slide

  16. ANTS Performance Profiler from Redgate

    View Slide

  17. ANTS Performance Profiler from Redgate

    View Slide

  18. DEMO TIME

    View Slide

  19. Application Memory Profiling
    • Identifying Memory Problems
    • Taking memory snapshots to analyse
    • Pinning the problem down

    View Slide

  20. ANTS Memory Profiler from Redgate

    View Slide

  21. ANTS Memory Profiler from Redgate

    View Slide

  22. ANTS Memory Profiler from Redgate

    View Slide

  23. DEMO TIME

    View Slide

  24. WinDbg and ProcDump
    • Dump file and WinDbg
    • WinDbg: https://msdn.microsoft.com/en-
    us/windows/hardware/hh852365.aspx
    • ProcDump: https://technet.microsoft.com/en-
    gb/sysinternals/dd996900.aspx
    C:\>procdump -ma outlook -p
    "\Process(Outlook)\Handle Count" 10000

    View Slide

  25. Server Profiling
    • Event Logs
    • Performance Counters

    View Slide

  26. Performance Counters

    View Slide

  27. Event Logs

    View Slide

  28. View Slide

  29. Load Testing

    View Slide

  30. Load Testing

    View Slide

  31. Network Profiling
    • Network problems
    • Watching what is being sent and recived
    • Fiddler
    • Wireshark

    View Slide

  32. www.red-gate.com/dotnet-tips

    View Slide

  33. Resources
    • ANTS Performance Profiler and ASP.NET 5: http://bit.ly/1LYO86Y
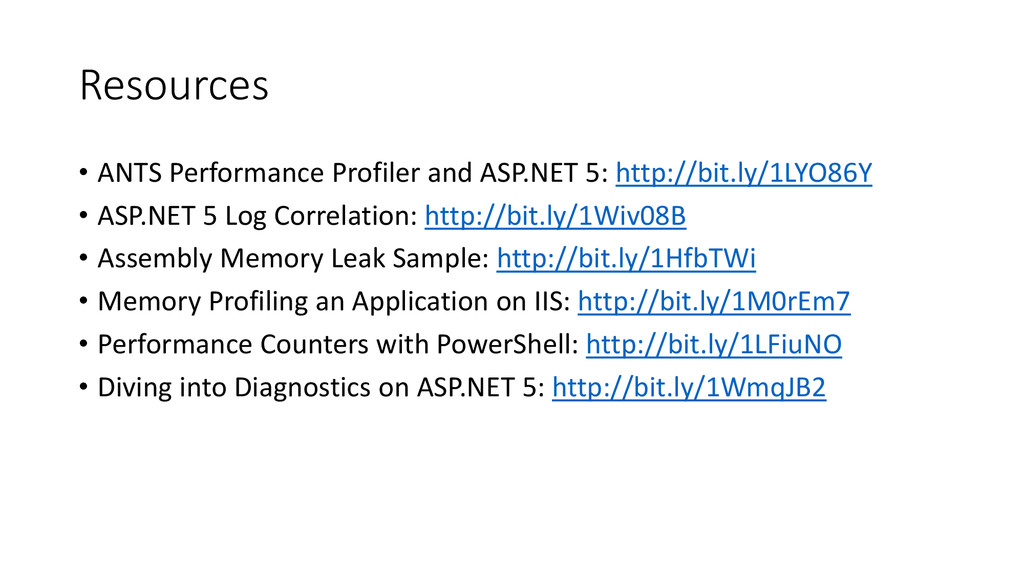
    • ASP.NET 5 Log Correlation: http://bit.ly/1Wiv08B
    • Assembly Memory Leak Sample: http://bit.ly/1HfbTWi
    • Memory Profiling an Application on IIS: http://bit.ly/1M0rEm7
    • Performance Counters with PowerShell: http://bit.ly/1LFiuNO
    • Diving into Diagnostics on ASP.NET 5: http://bit.ly/1WmqJB2

    View Slide