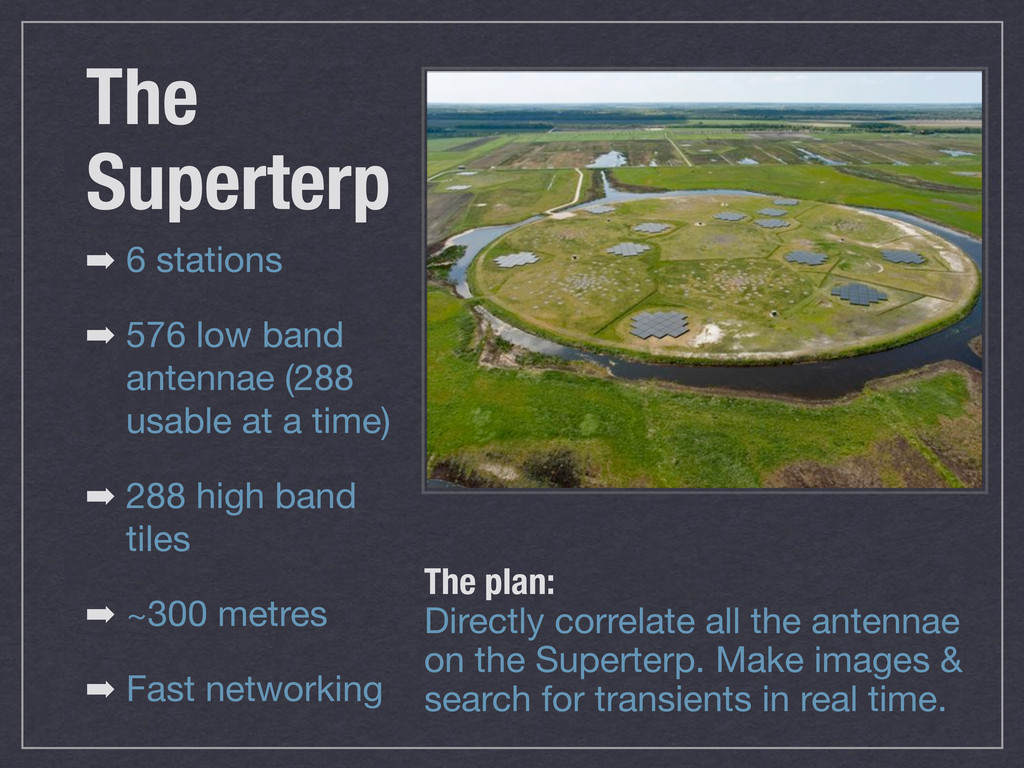
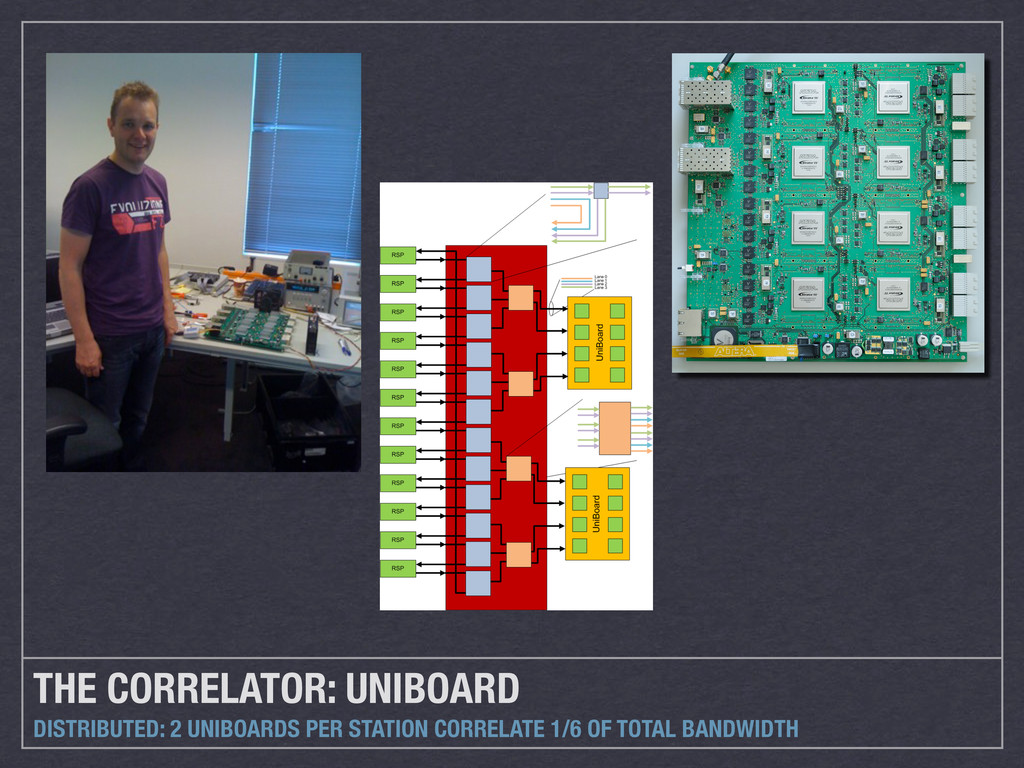
(288 usable at a time) ➡ 288 high band tiles ➡ ~300 metres ➡ Fast networking The plan: Directly correlate all the antennae on the Superterp. Make images & search for transients in real time.
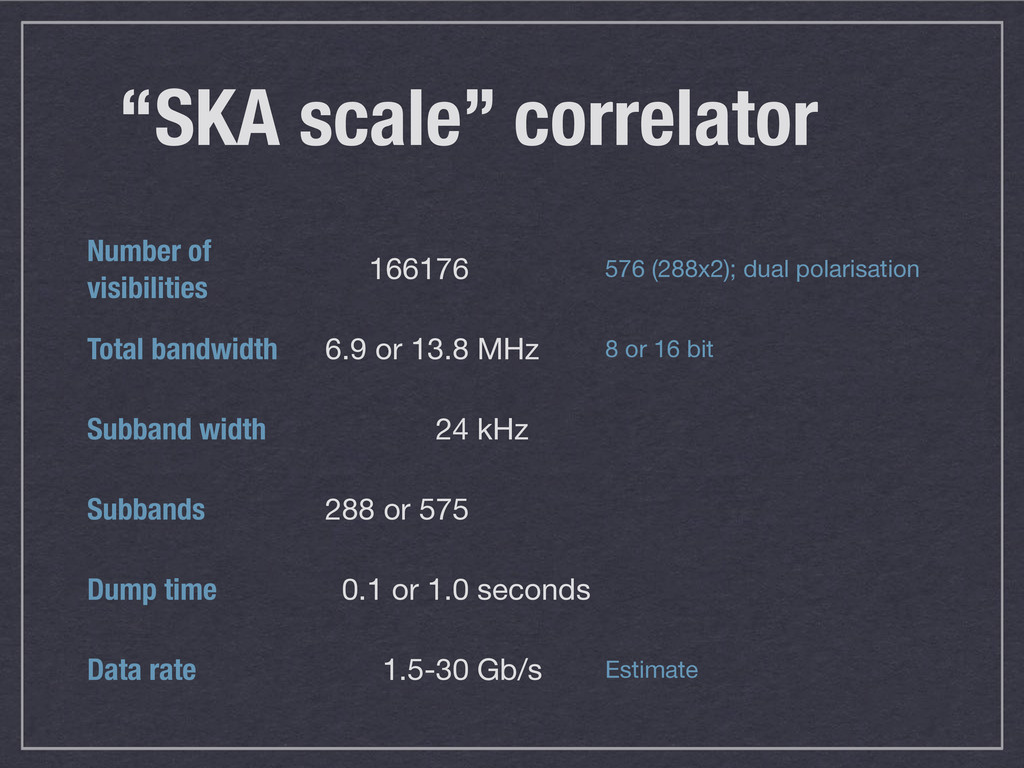
polarisation Total bandwidth 6.9 or 13.8 MHz 8 or 16 bit Subband width 24 kHz Subbands 288 or 575 Dump time 0.1 or 1.0 seconds Data rate 1.5-30 Gb/s Estimate
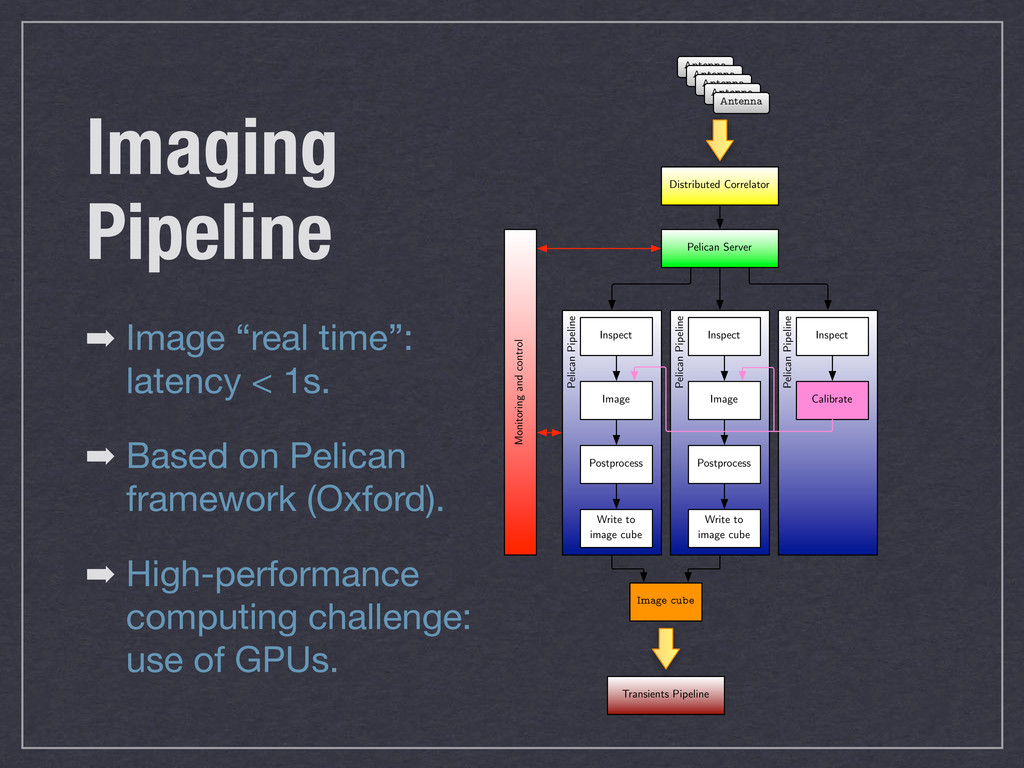
and control Pelican Server Image cube Inspect Calibrate Distributed Correlator Pelican Pipeline Inspect Image Postprocess Write to image cube Pelican Pipeline Inspect Image Postprocess Write to image cube Transients Pipeline ➡ Image “real time”: latency < 1s. ➡ Based on Pelican framework (Oxford). ➡ High-performance computing challenge: use of GPUs.
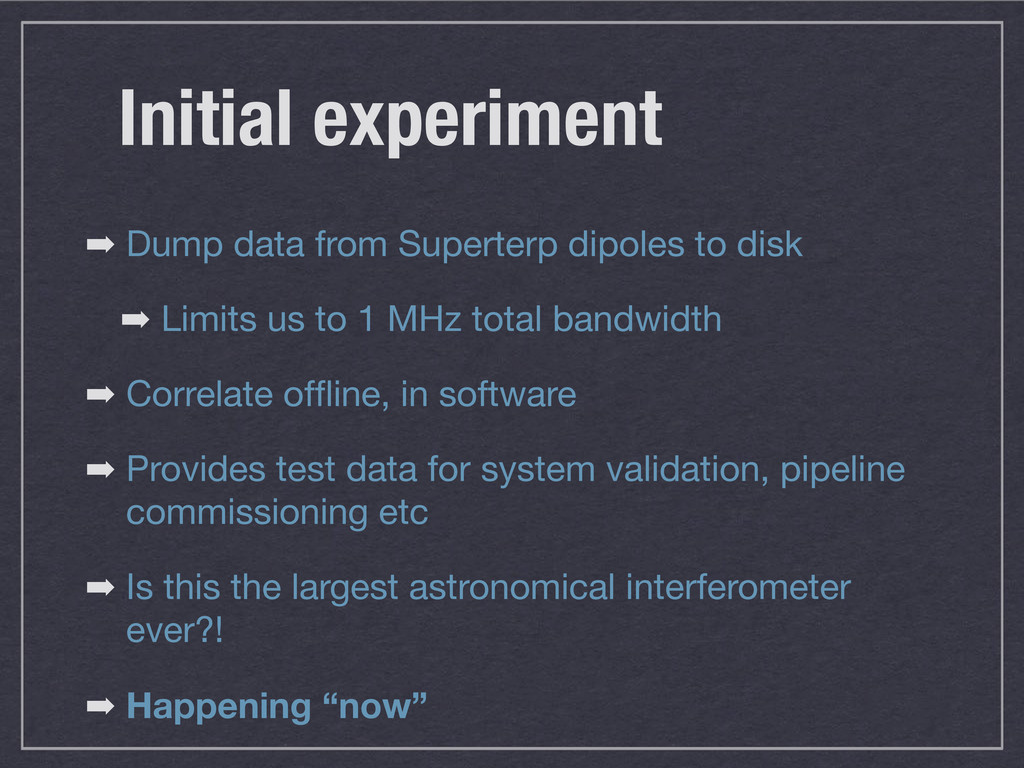
➡ Limits us to 1 MHz total bandwidth ➡ Correlate offline, in software ➡ Provides test data for system validation, pipeline commissioning etc ➡ Is this the largest astronomical interferometer ever?! ➡ Happening “now”
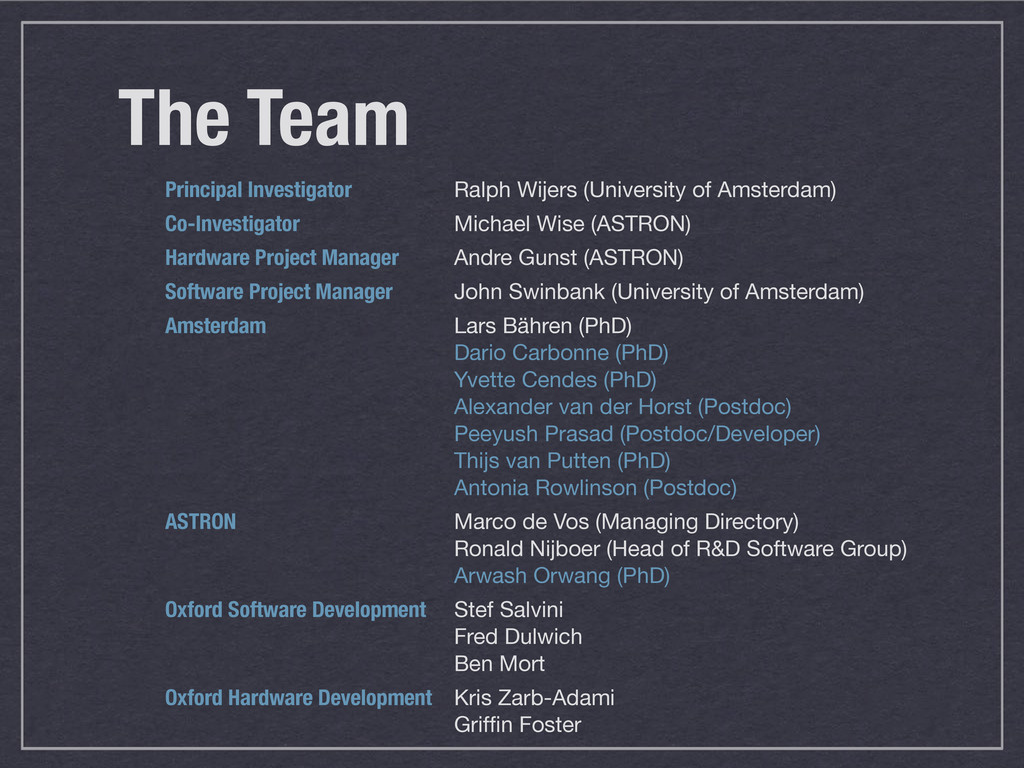
Michael Wise (ASTRON) Hardware Project Manager Andre Gunst (ASTRON) Software Project Manager John Swinbank (University of Amsterdam) Amsterdam Lars Bähren (PhD) Dario Carbonne (PhD) Yvette Cendes (PhD) Alexander van der Horst (Postdoc) Peeyush Prasad (Postdoc/Developer) Thijs van Putten (PhD) Antonia Rowlinson (Postdoc) ASTRON Marco de Vos (Managing Directory) Ronald Nijboer (Head of R&D Software Group) Arwash Orwang (PhD) Oxford Software Development Stef Salvini Fred Dulwich Ben Mort Oxford Hardware Development Kris Zarb-Adami Griffin Foster
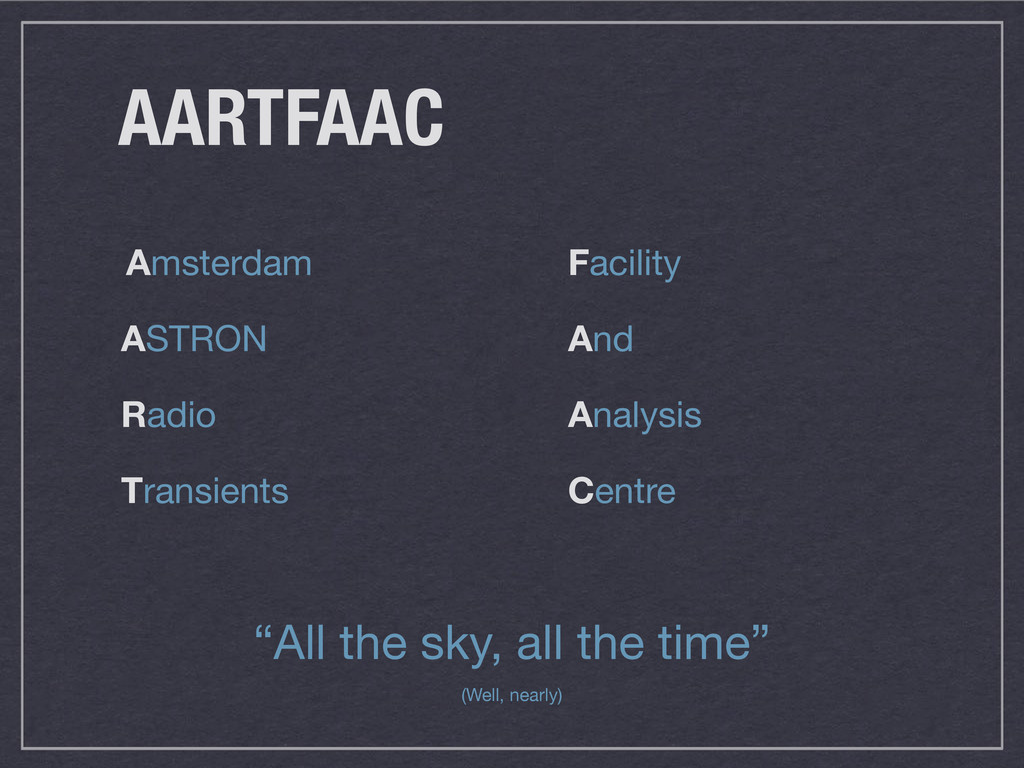
![AARTFAAC Project John Swinbank [email protected]](https://files.speakerdeck.com/presentations/4fde4407dbe56c00220123f5/slide_0.jpg)