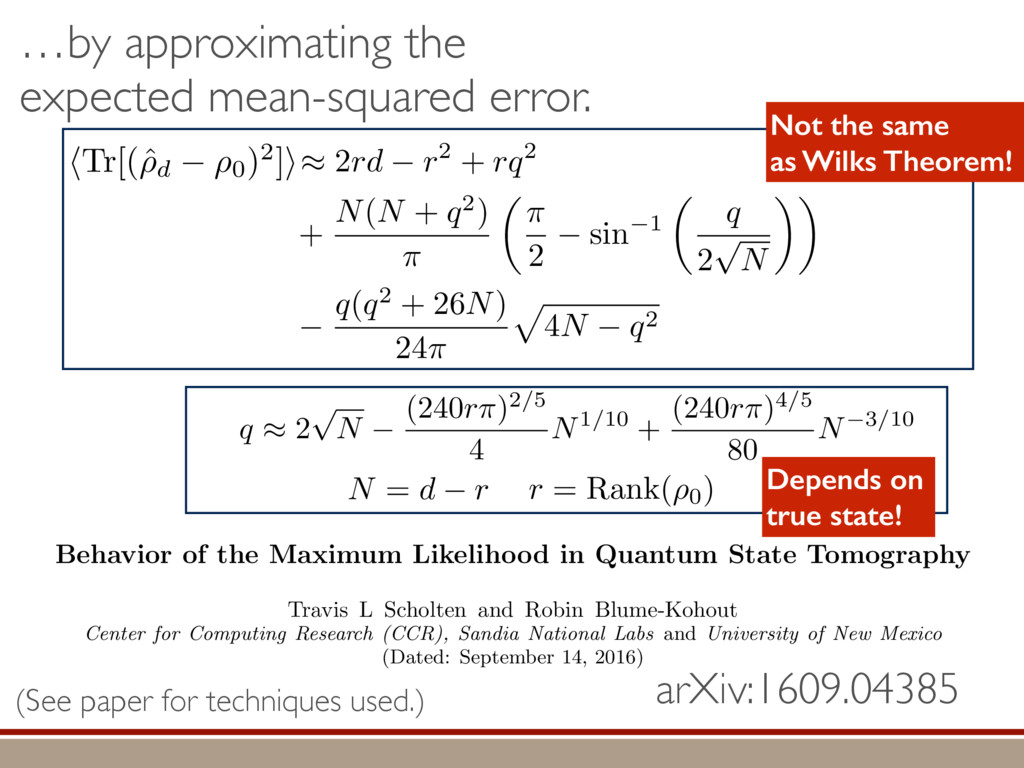
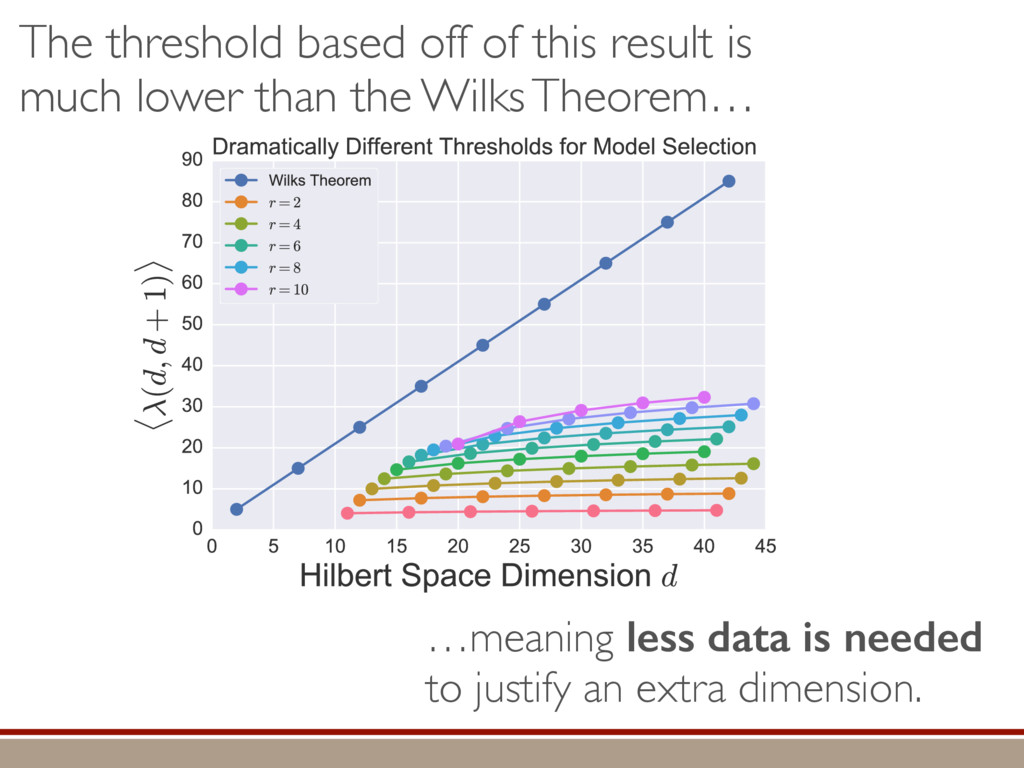
L Scholten and Robin Blume-Kohout Center for Computing Research (CCR), Sandia National Labs and University of New Mexico (Dated: September 14, 2016) Quantum state tomography on a d-dimensional system demands resources that grow rapidly with d. Model selection can be used to tailor the number of fit parameters to the data, but quantum tomography violates some common assumptions that underly canonical model selection techniques arXiv:1609.04385 h (⇢0 , Md)i ⇡ 2rd r2 + rq2 + N(N + q2) ⇡ ✓ ⇡ 2 sin 1 ✓ q 2 p N ◆◆ q(q2 + 26N) 24⇡ p 4N q2 (10) where q is given in Equation (8), N = d r, and r = Rank(⇢0 ). Equation (10) is our main result. To test its validity, we compare it to numerical simulations for d = 2, . . . , 30 and r = 1, . . . , 10, in Figure 3. The prediction of the Wilks Theorem is wildly incorrect for r ⌧ d. In contrast, Equation 10 is almost perfectly accurate when r ⌧ d, but it does begin to break down (albeit fairly gracefully) as r becomes comparable to d. We conclude that our analysis [and Equation (10)] correctly models tomography if the and H5 erodyn MLEs merical d, we a an emp pair. N = d r r = Rank(⇢0) hTr[(ˆ ⇢d ⇢0)2]i ght: The nu- of ˆ ⇢ into two s = ˆ ⇢ ⇢0 , simplify the onstraint and -dimensional mation when ement of the n the “L” do ained by the rom classical has Gaussian jk i = 1. As “L”, h i L = e the bound- Here, we turn e for finding he eigenbasis pendix I for a more detailed discussion of this series of approximations.) To proceed with truncation, we observe that the j are symmetrically distributed around = 0, so half of them are negative. Therefore, with high probabil- ity, Tr [Trunc(ˆ ⇢)] > 1, and so we will need to subtract q1l from ˆ ⇢ before truncating. The appropriate q solves Tr [Trunc(ˆ ⇢ q1l)] = 1. This equation can be solved us- ing the ansatz established so far, and some series expan- sions (see Appendix I) yield the solution: q ⇡ 2 p N (240r⇡)2/5 4 N1/10 + (240r⇡)4/5 80 N 3/10. (8) Now that we know how much to subtract o↵ in the truncation process, we can compute h i kite . Defining (x)+ = max(x, 0): h i kite = * r X j=1 [⇢jj (pj q)]2 + N X j=1 ⇥ (j q)+ ⇤2 + Z p Not the same as Wilks Theorem! …by approximating the expected mean-squared error. Depends on true state! (See paper for techniques used.)
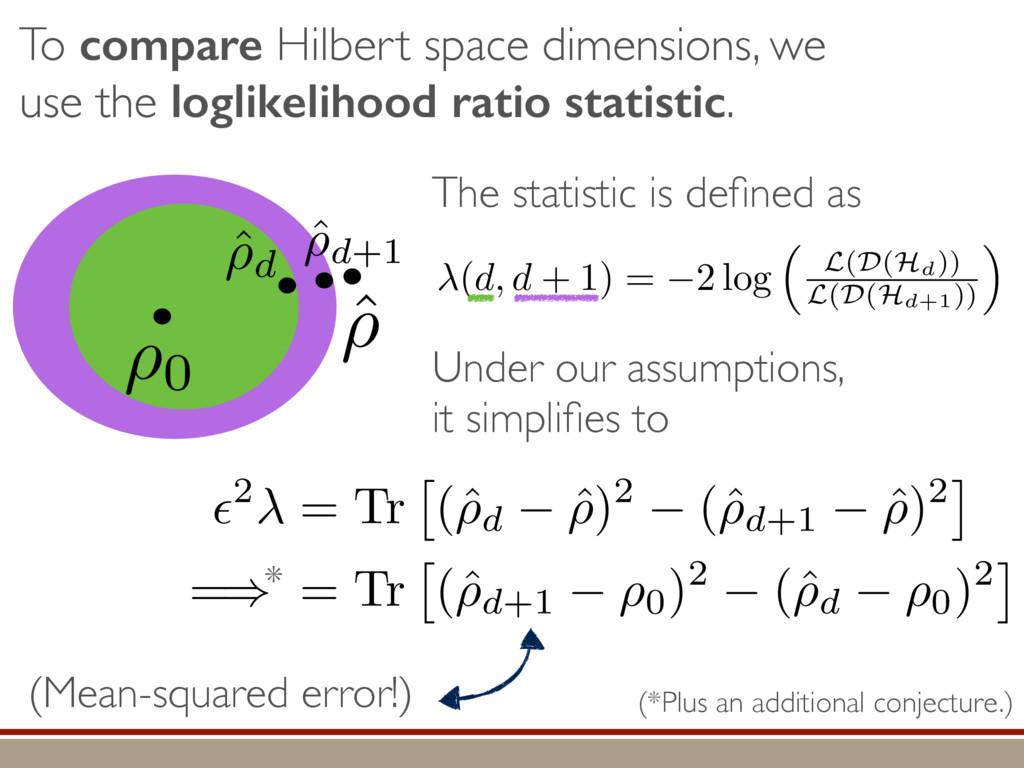
![✏2h i = hTr[(ˆ ⇢d+1 ⇢0)2]i hTr[(ˆ ⇢d ⇢0)2]i ˆ](https://files.speakerdeck.com/presentations/438b9cab0d784e36bf5d18cb06392f02/slide_12.jpg)