Upgrade to Pro — share decks privately, control downloads, hide ads and more …

Visualize and Analyze Apache Geode Real-time and Historical Metrics with Grafana

Visualize and Analyze Apache Geode Real-time and Historical Metrics with Grafana

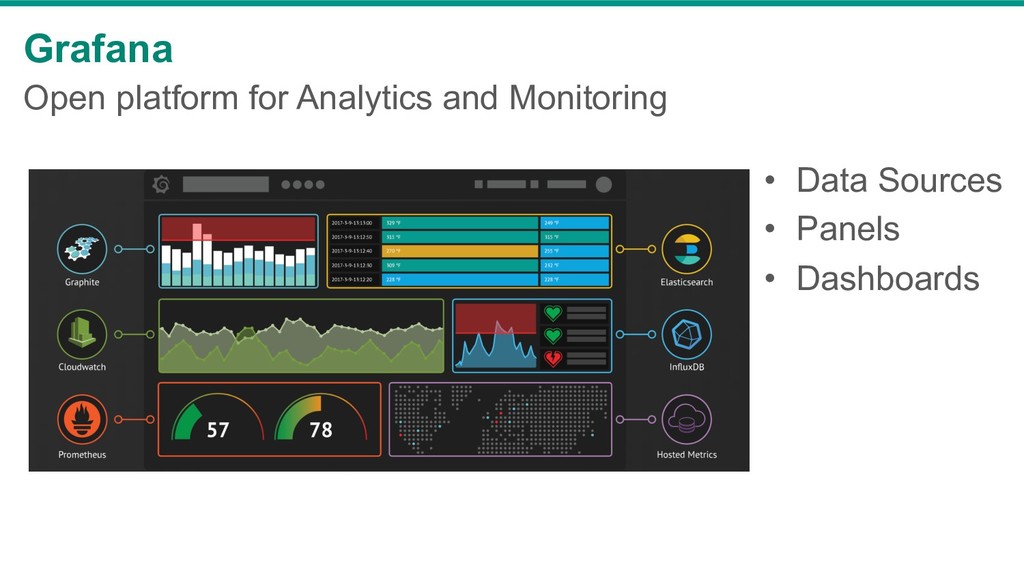
Interested in a single dashboard providing a combined picture of both, real-time metrics and analysis of historical statistics for Apache Geode (Pivotal GemFire)? During this webinar we will show you how to create a dashboard providing the proper context for interpreting real-time metrics using Grafana - an open platform for analytics and monitoring.

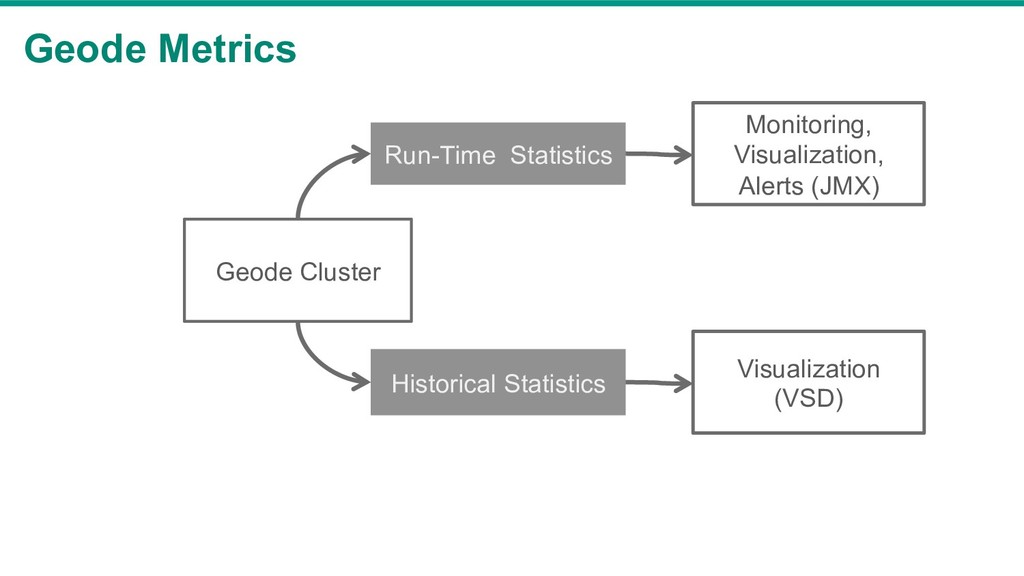
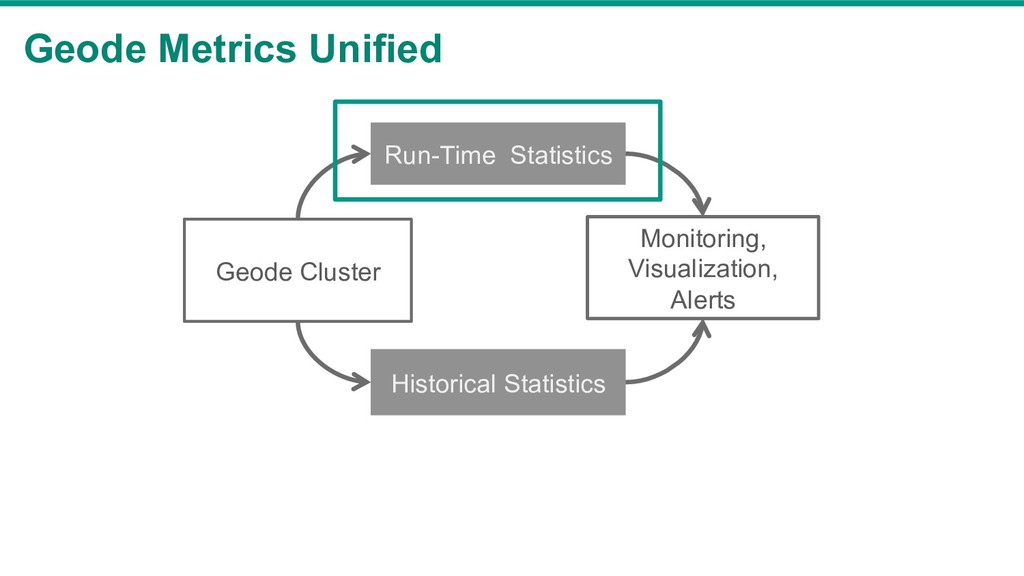
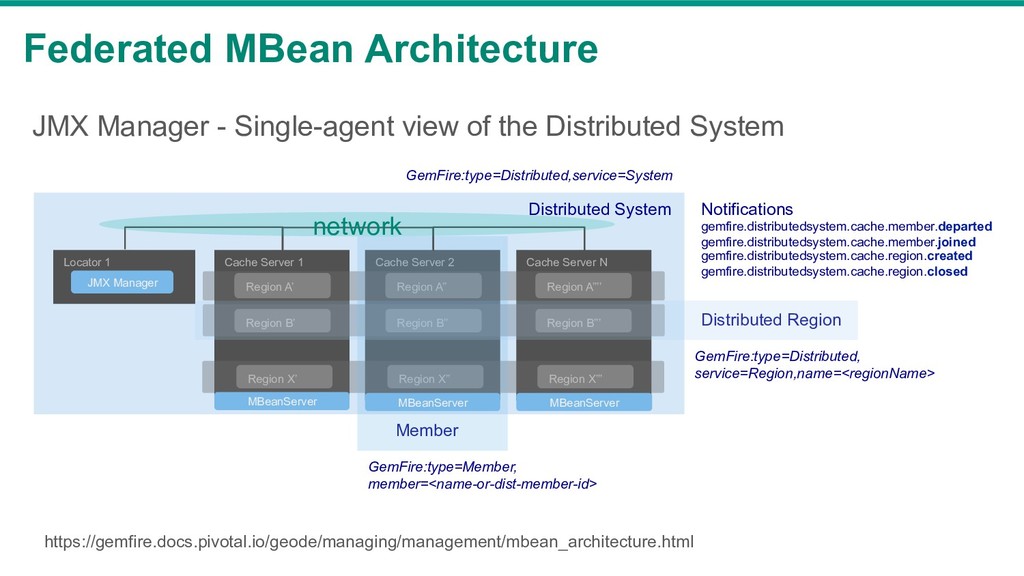
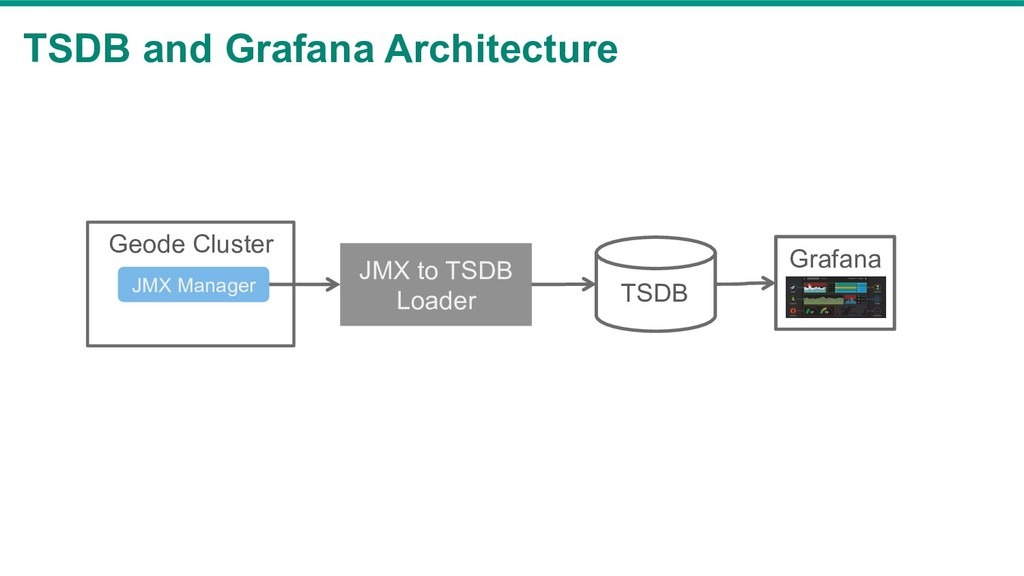
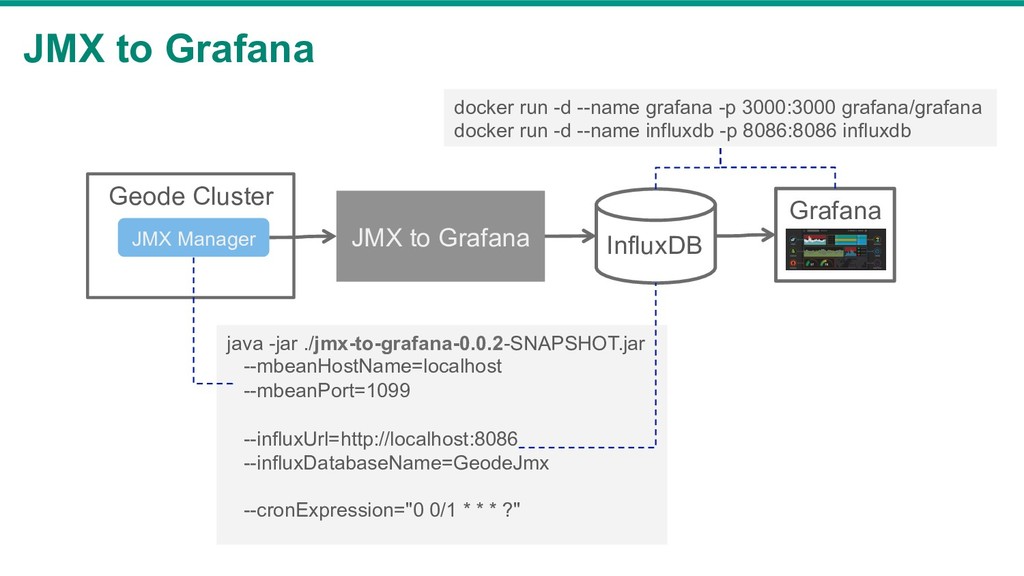
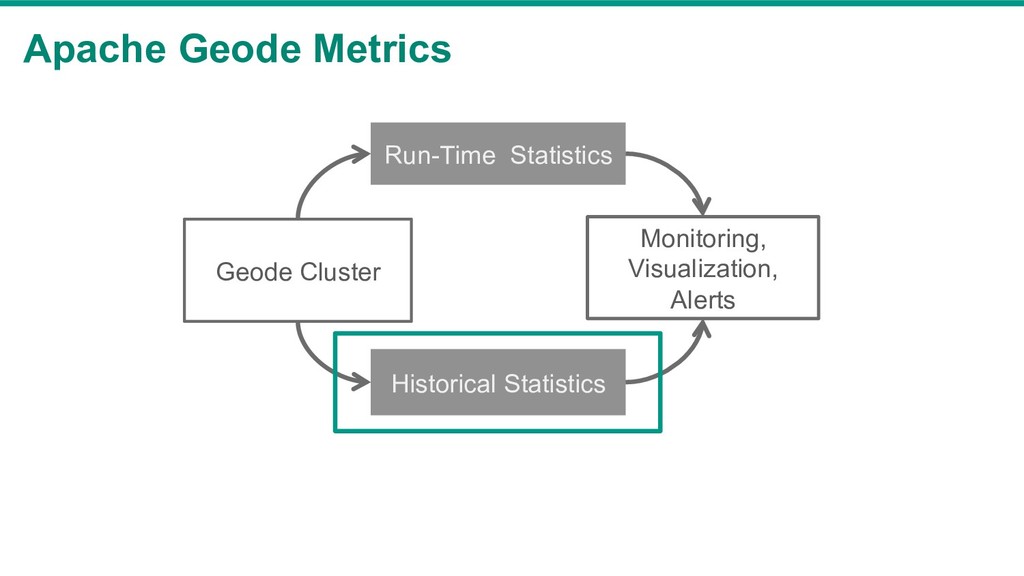
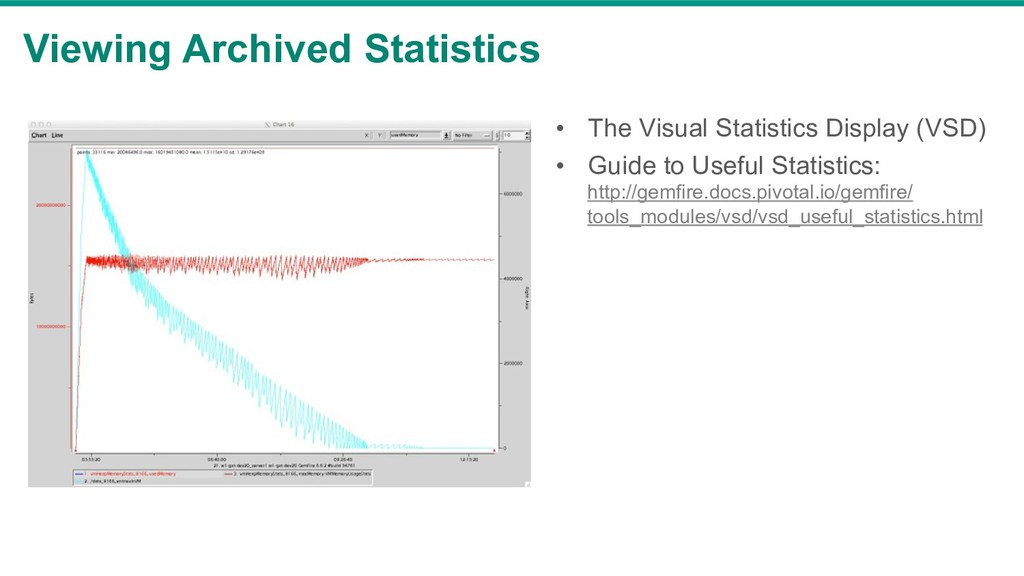
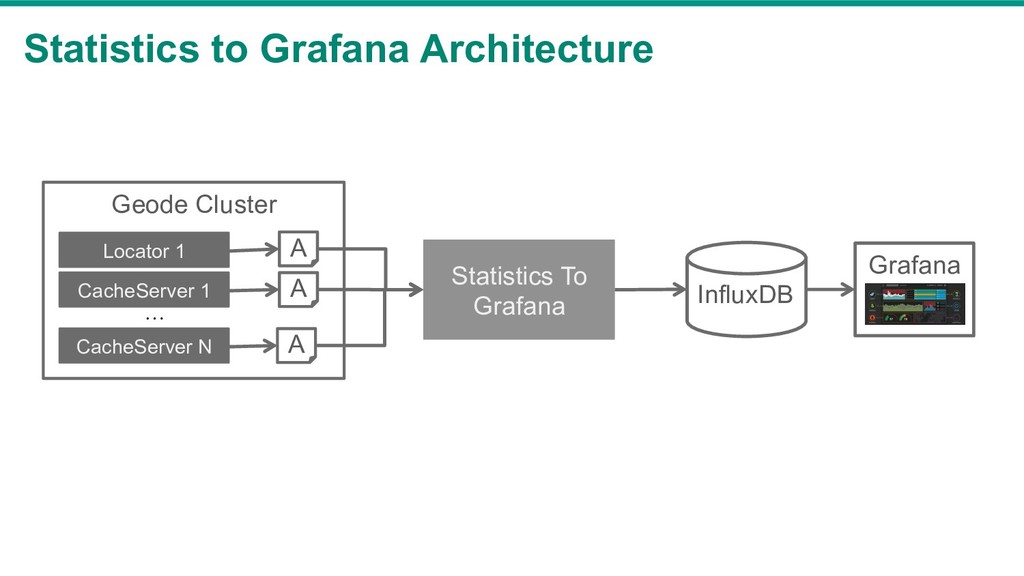
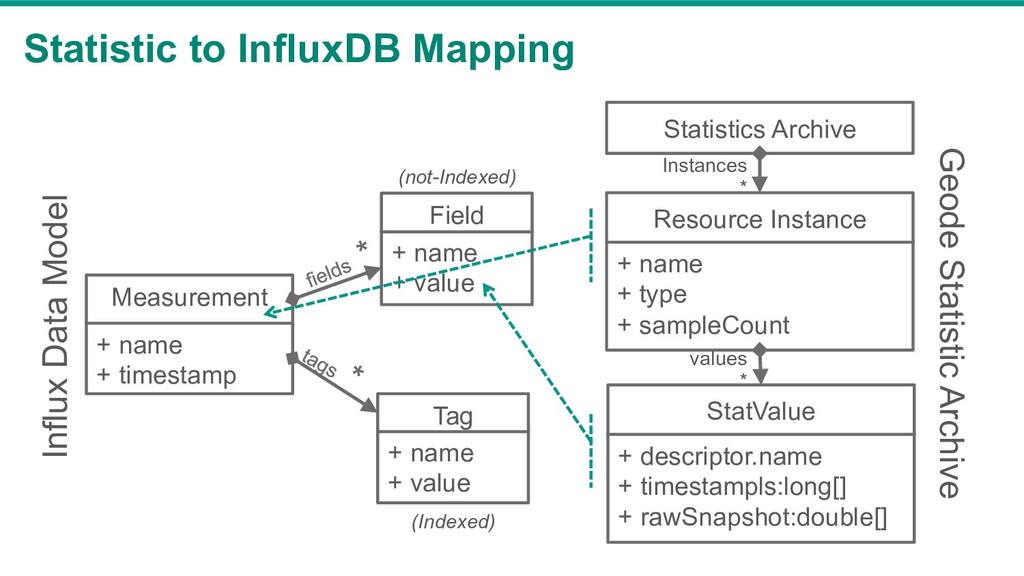
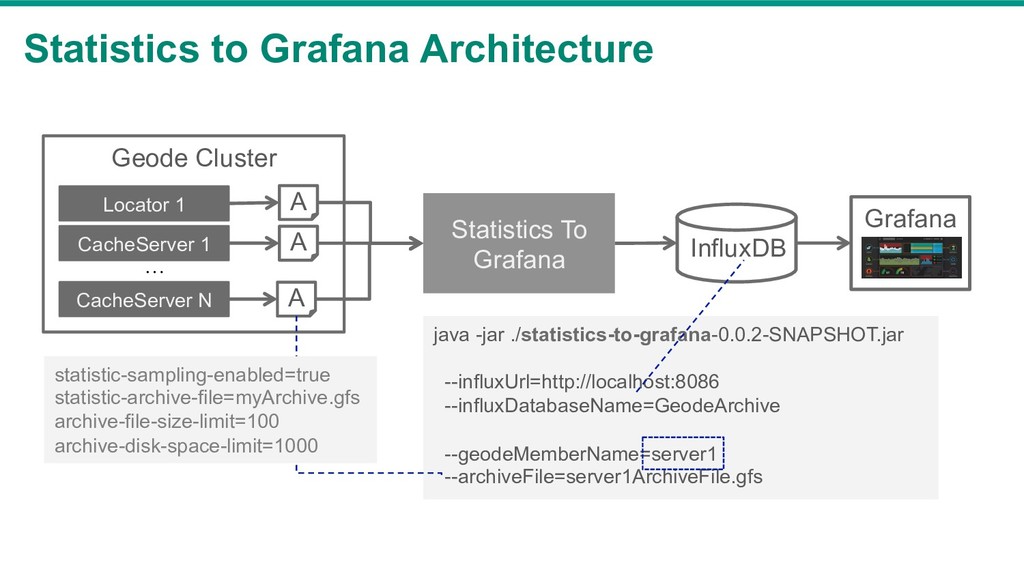
Accomplishing this requires the consolidation of two monitoring and metrics feeds in GemFire: the real-time metrics accessed via a JMX API; and the “post-mortem” historical statistics accessed via archive files.

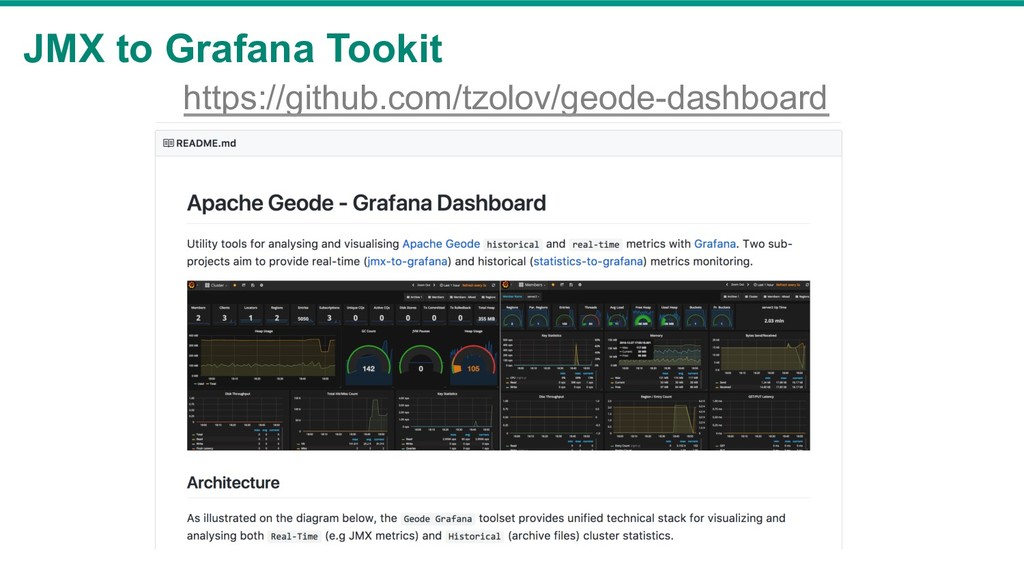
Join us as we describe and demonstrate how these two monitoring and metrics feeds can be combined, providing a unified monitoring and metrics dashboard for GemFire. We will also share common use cases and explore how the Geode Grafana Dashboard Repository, a pre-built collection of Geode-Grafana dashboards, helps create customized, monitoring dashboards.
Video: https://youtu.be/lVeYdA6GYZ4
BrightTalk webinar link: https://goo.gl/YkLBvT

Christian Tzolov

February 01, 2018
Tweet

More Decks by Christian Tzolov

Other Decks in Programming

Transcript

  1. Visualize and Analyze Apache Geode Real-time and Historical Metrics Christian

    Tzolov Software Engineer, Spring Cloud ASF, Apache Committer, PMC member
  2. Disclaimer The following is intended to outline the general direction

    of Pivotal's offerings. It is intended for information purposes only and may not be incorporated into any contract. Any information regarding pre-release of Pivotal offerings, future updates or other planned modifications is subject to ongoing evaluation by Pivotal and is subject to change. This information is provided without warranty or any kind, express or implied, and is not a commitment to deliver any material, code, or functionality, and should not be relied upon in making purchasing decisions regarding Pivotal's offerings. These purchasing decisions should only be based on features currently available. The development, release, and timing of any features or functionality described for Pivotal's offerings in this presentation remain at the sole discretion of Pivotal. Pivotal has no obligation to update forward looking information in this presentation.
  3. Apache Geode / GemFire “… in-memory, distributed database with strong

    consistency built to support low latency transactional applications at extreme scale”
  4. Monitor What? Cache Server Region A Region X Val Ke

    y v1 k1 v2 k2 … Region - consistent, distributed Map (key-value) dataset CacheServer – process managing Regions Client Locator Client –read and modify Region content Locator – track membership information
  5. Cache Server 1 Region A Region A’ Region B’ Region

    X’ Cache Server N Region A Region A’’’’ Region B’’’ Region X’’’ Cache Server 2 Region A Region A’’ Region B’’ Region X’’ Federated MBean Architecture Locator 1 Distributed System Distributed Region Member GemFire:type=Distributed, service=Region,name=<regionName> GemFire:type=Distributed,service=System GemFire:type=Member, member=<name-or-dist-member-id> Notifications gemfire.distributedsystem.cache.member.departed gemfire.distributedsystem.cache.member.joined gemfire.distributedsystem.cache.region.created gemfire.distributedsystem.cache.region.closed https://gemfire.docs.pivotal.io/geode/managing/management/mbean_architecture.html network JMX Manager - Single-agent view of the Distributed System JMX Manager MBeanServer MBeanServer MBeanServer
  6. Geode Pulse •  Cluster View •  Member View •  Region

    View •  Alerts Widget https://gemfire.docs.pivotal.io/geode/tools_modules/pulse/pulse-views.html
  7. Beyond Pulse •  Extensibility •  Customized Views and Alerts • 

    Compare metrics between Members or Regions •  Integrate with 3rd party monitoring tools
  8. Time Series Database (TSDB) •  Real-time process/store of time-series data

    •  Data is larger than memory •  Storage per data point efficiency •  Sequential, ordered per series reads •  Write mostly (95%) •  Data is larger than memory •  Storage efficiency - few bytes of storage per data point •  OSS TSDB: InfluxDB, Open TSDB, Prometheus, … https://en.wikipedia.org/wiki/Time_series_database
  9. JMX to InfluxDB Mapping + name + timestamp Measurement +

    name + value Field + name + value Tag (Indexed) (not-Indexed) {region : Zips} …. + avgBucketSize + entrySize + memberCount … MemberMBean + avgBucketSize + entrySize + memberCount … DistributedSystemMBean {region : Zips} …. + avgBucketSize + entrySize + memberCount … DistributedRegionMBean GemFire:service=Region,name=/Zips,type=Distributed Influx Data Model Geode MBean Model
  10. JMX to Grafana Geode Cluster JMX to Grafana Grafana InfluxDB

    JMX Manager java -jar ./jmx-to-grafana-0.0.2-SNAPSHOT.jar --mbeanHostName=localhost --mbeanPort=1099 --influxUrl=http://localhost:8086 --influxDatabaseName=GeodeJmx --cronExpression="0 0/1 * * * ?" docker run -d --name grafana -p 3000:3000 grafana/grafana docker run -d --name influxdb -p 8086:8086 influxdb
  11. Geode Statistics Archive •  Statistics Collected per Member •  Local

    Archive Files •  Build-in Statistics •  Runtime (peer per node, clients, data entities,…) •  Resources (memory, cpu, descriptors, system load,…) •  Operations Throughput (Cache, Disk,…) •  … •  Application-Defined Statistics http://gemfire.docs.pivotal.io/gemfire/tools_modules/vsd/vsd_useful_statistics.html
  12. Viewing Archived Statistics •  The Visual Statistics Display (VSD) • 

    Guide to Useful Statistics: http://gemfire.docs.pivotal.io/gemfire/ tools_modules/vsd/vsd_useful_statistics.html
  13. Geode Cluster Locator 1 CacheServer 1 CacheServer N … Statistics

    to Grafana Architecture Grafana InfluxDB A A A Statistics To Grafana
  14. Statistic to InfluxDB Mapping + name + timestamp Measurement +

    name + value Field + name + value Tag (Indexed) (not-Indexed) Influx Data Model Geode Statistic Archive + name + type + sampleCount Resource Instance Statistics Archive Instances * + descriptor.name + timestampls:long[] + rawSnapshot:double[] StatValue values *
  15. Geode Cluster Locator 1 CacheServer 1 CacheServer N … Statistics

    to Grafana Architecture Grafana InfluxDB A A A Statistics To Grafana java -jar ./statistics-to-grafana-0.0.2-SNAPSHOT.jar --influxUrl=http://localhost:8086 --influxDatabaseName=GeodeArchive --geodeMemberName=server1 --archiveFile=server1ArchiveFile.gfs statistic-sampling-enabled=true statistic-archive-file=myArchive.gfs archive-file-size-limit=100 archive-disk-space-limit=1000
  16. Next? 25 •  Micrometer- http://micrometer.io/ •  Grafana Geode Source Plugin

    (Geode SQL adapter) •  Add real-time metrics for AsyncListener, DistributedLock, Gateway •  Additional pre-build Dashboards