Upgrade to Pro — share decks privately, control downloads, hide ads and more …

Styliana Sarris - Reporting your User Research Findings like a Psychologist

uxaustralia
March 18, 2021

Styliana Sarris - Reporting your User Research Findings like a Psychologist

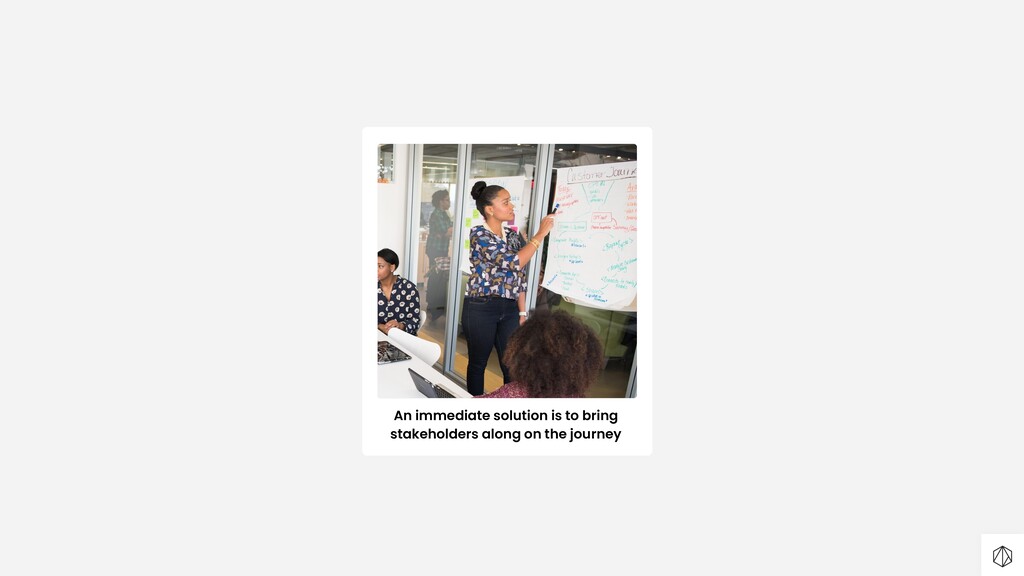
Our user research findings lack gravity when they are reported poorly.

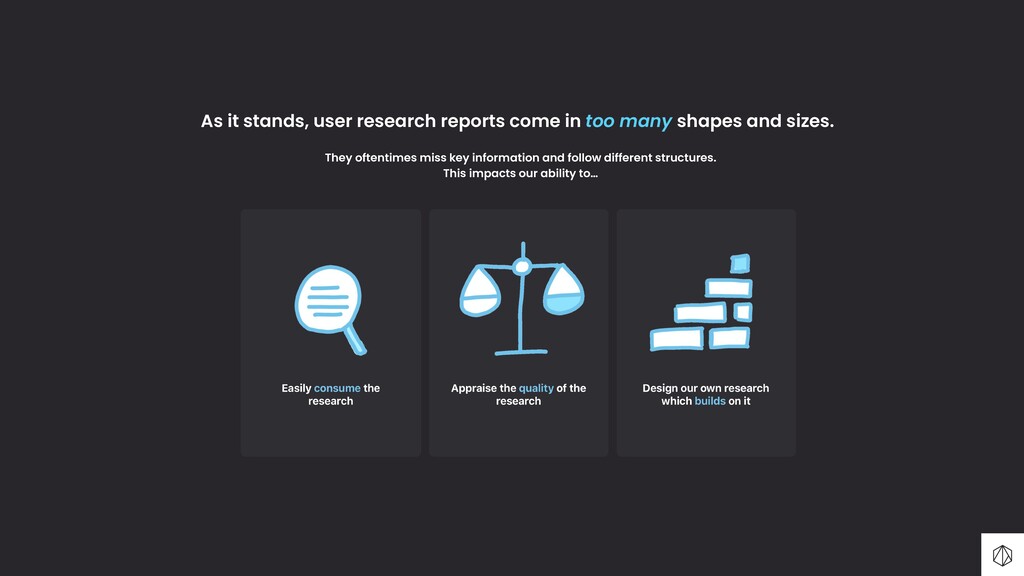
Oftentimes, we negate key pieces of information or unwittingly breach ethical guidelines. Despite the various benefits of having some creative freedom, as it stands, the user research report comes in too many shapes and sizes. This impacts both our ability to quickly consume previous research conducted by fellow researchers and more importantly, denies us the ability to appraise its quality; a fundamental function of research.

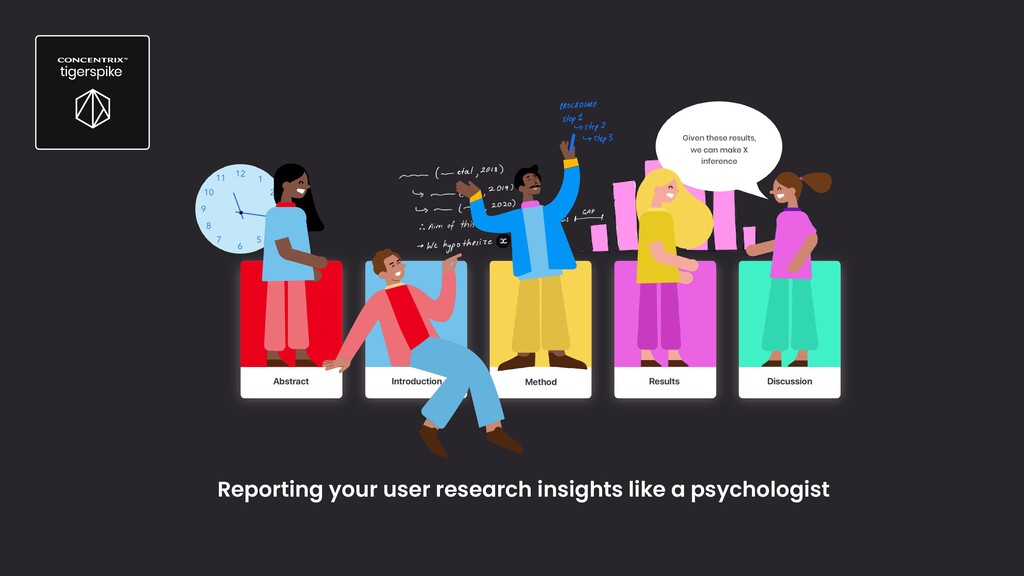
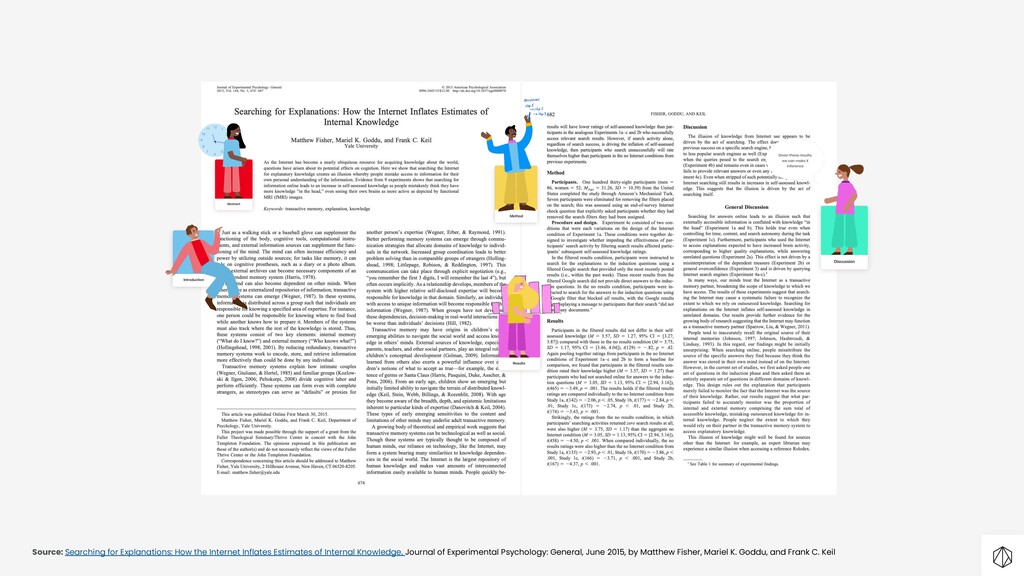
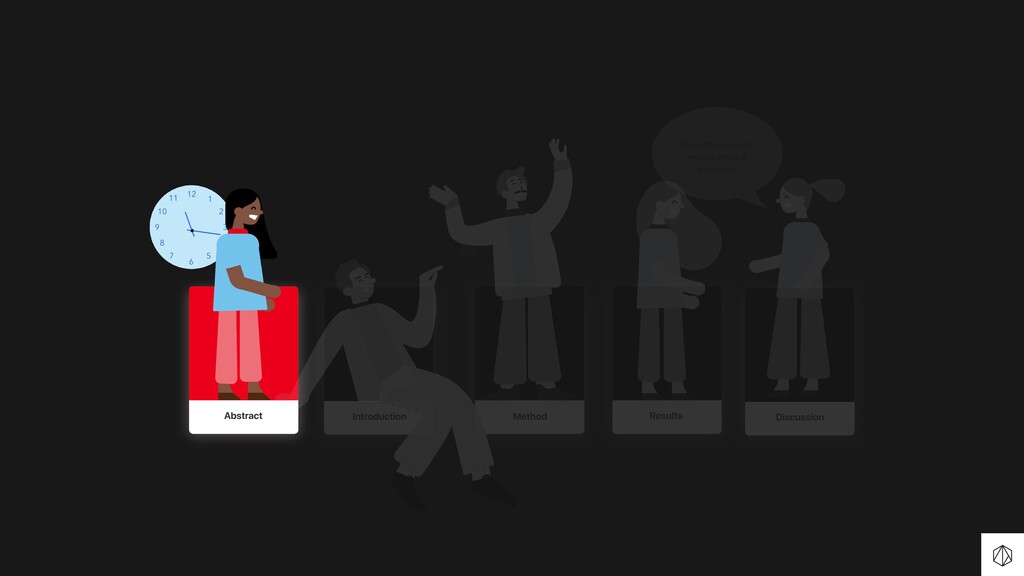
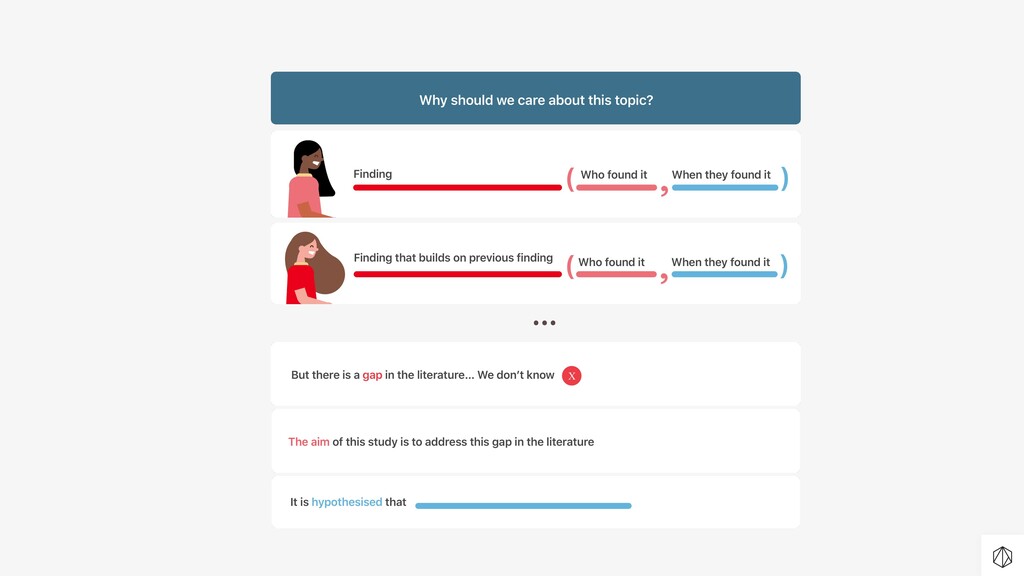
Albeit presenting our research insights with long slabs of text and convoluted words is a far cry from the desired objective, we have a lot to gain from leveraging the structure that psychologists turn to when presenting their findings - the academic journal.

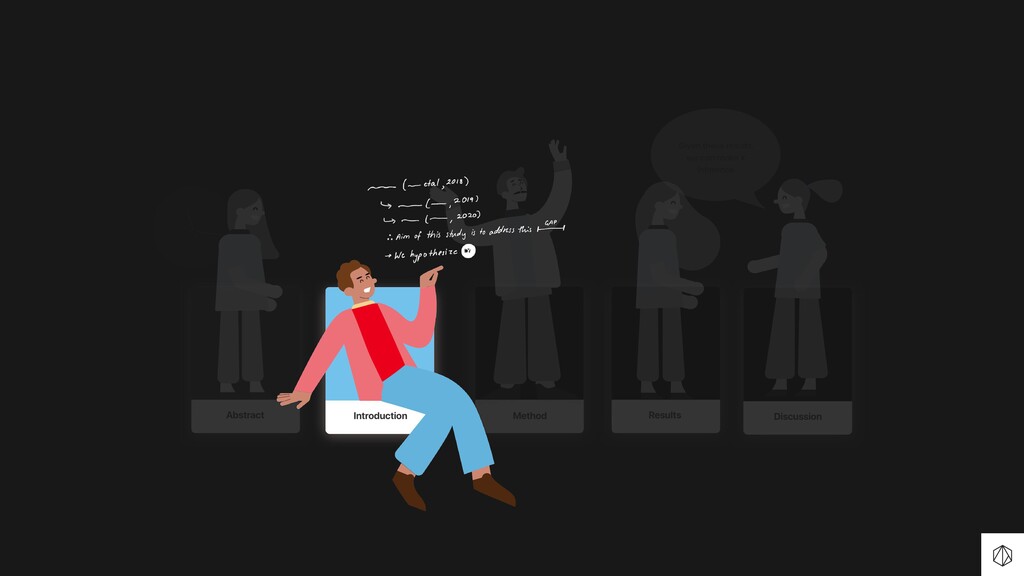
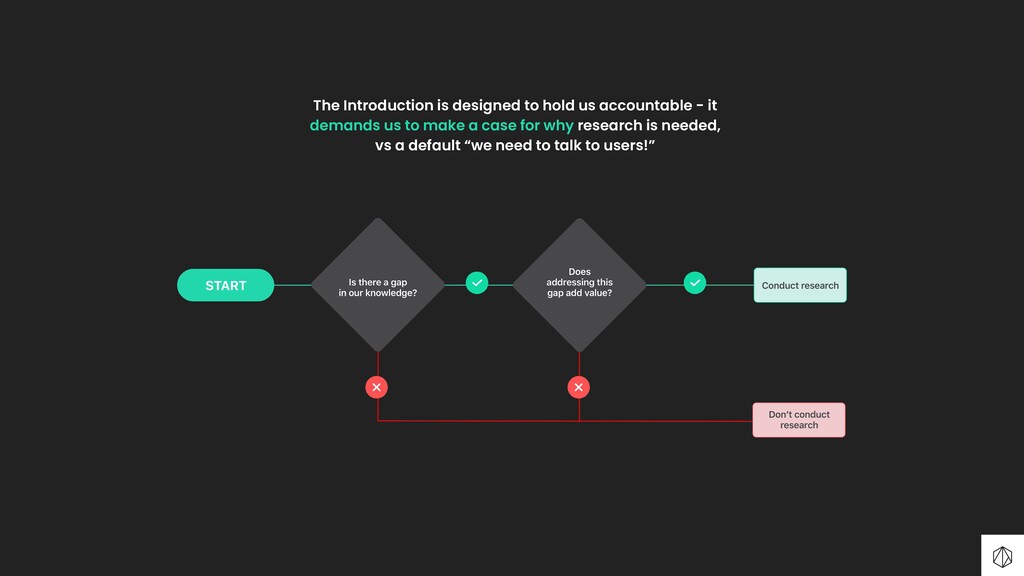
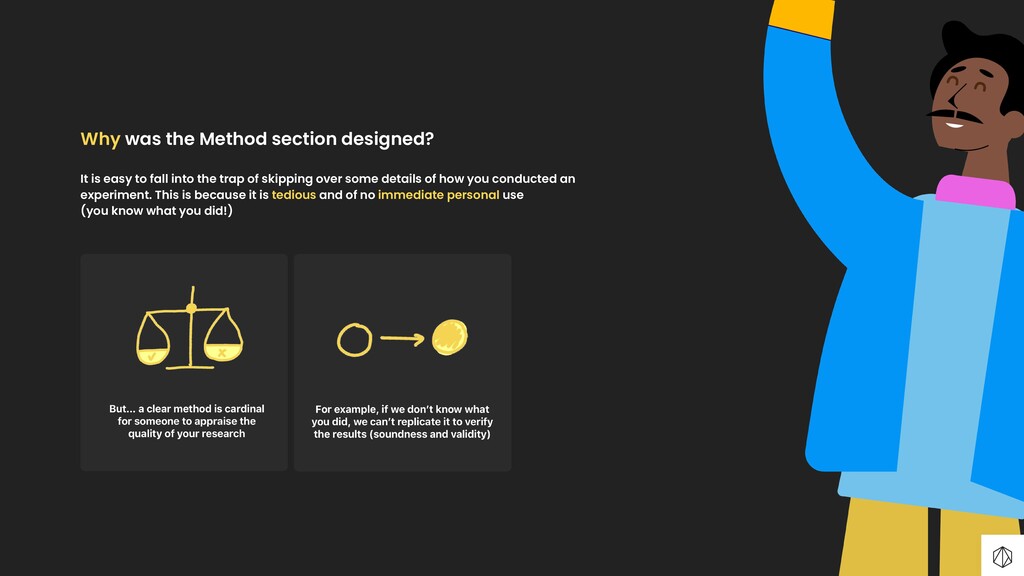
The design of the academic journal is very intentional, with each section devoted to addressing a key aspect of the scientific method. Insofar as user research is to be legitimate in guiding large-scale product decisions, we are not exempt from holding ourselves to high standards of rigour - but we also don’t need to be terrified by them. What we need is a standard that works in our unique context - a context where time is money, deliverables are created in a hurry and budgets are minimal.

In this talk, we will hone in on the architecture of the academic journal and explore what we can borrow from it to raise the bar on our research reporting, ultimately maximising the weight and longevity of our insights.

uxaustralia

March 18, 2021
Tweet

More Decks by uxaustralia

Other Decks in Design

Transcript

  1. A deep understanding of the people we are designing for

    is cardinal to a product’s success
  2. As it stands, user research reports come in too many

    shapes and sizes. They oftentimes miss key information and follow different structures. This impacts our ability to…
  3. Source: Searching for Explanations: How the Internet Inflates Estimates of

    Internal Knowledge, Journal of Experimental Psychology: General, June 2015, by Matthew Fisher, Mariel K. Goddu, and Frank C. Keil
  4. Why was the introduction section designed? It is easy to

    fall into the trap of getting excited about a problem space or research question and jump straight into the data collection. “Lets just talk to users!”
  5. The Introduction is designed to hold us accountable - it

    demands us to make a case for why research is needed, vs a default “we need to talk to users!”
  6. Why was the Method section designed? It is easy to

    fall into the trap of skipping over some details of how you conducted an experiment. This is because it is tedious and of no immediate personal use (you know what you did!)
  7. Individuals are selected from the population to form the sample

    Findings derived from sample are generalised to the wider population
  8. Individuals are selected from the population to form the sample

    Findings derived from sample are generalised to the wider population If all your report says is “we spoke to 5 users”then we can’t verify if this happened…
  9. Why was the Results Section designed? It’s very easy to

    fall into the trap of looking at your results at face value and making huge inferential leaps about their meaning,
  10. Perspicuity 1.40 Dependability 1.10 Efficiency 1.47 Stimulation Novelty Attractiveness 1.1

    Pragmatic Qualities Hedonic Qualities Attractiveness 0.40 0.20 Say we only reported the descriptive statistics of our study... User Experience Questionnaire →https://www.ueq-online.org/
  11. User Experience Questionnaire →https://www.ueq-online.org/ Inferential statistics give us a better

    understanding of the precision of the estimate, and help us make inferences from our sample to the wider population. They give us confidence in our findings, and as you can see here, stimulation and novelty are not statistically significant (P-value is not <0.05)
  12. Perspicuity 1.40 Dependability 1.10 Efficiency 1.47 Stimulation Novelty Attractiveness 1.1

    Pragmatic Qualities Hedonic Qualities Attractiveness 0.40 0.20 If we reported these findings without looking at whether they were statistically significant, we would have mislead our stakeholders by making the wrong conclusions. User Experience Questionnaire →https://www.ueq-online.org/ ✅ ✅ ✅ ✅ ❌ ❌
  13. Why was the Discussion section designed? It’s very easy to

    fall into the trap of refraining from sharing the flaws of your study and being defensive when questioned about the quality of them.
  14. Why was the Abstract section designed? It’s very easy to

    fall into the trap of thinking your audience will have time to read your full report in detail.
  15. What we don’t have time for is wasting human capital

    and $ on “research” which isn’t valid nor sound.
  16. Insofar as our research is to inform large scale product

    decisions directly impacting a large scale user base... we need to lift our game.
  17. Thank you Sydney — Melbourne — Brisbane — San Francisco

    — New York — London — Wrocław — Dubai — Mumbai — Singapore — Tokyo LinkedIn Facebook Twitter Instagram Tigerspike We deliver business value, fast. tigerspike.com Styliana Sarris Senior UX Designer [email protected]