Upgrade to Pro — share decks privately, control downloads, hide ads and more …

Turning anecdotes into insights: Mixed methods research in support of design

Turning anecdotes into insights: Mixed methods research in support of design

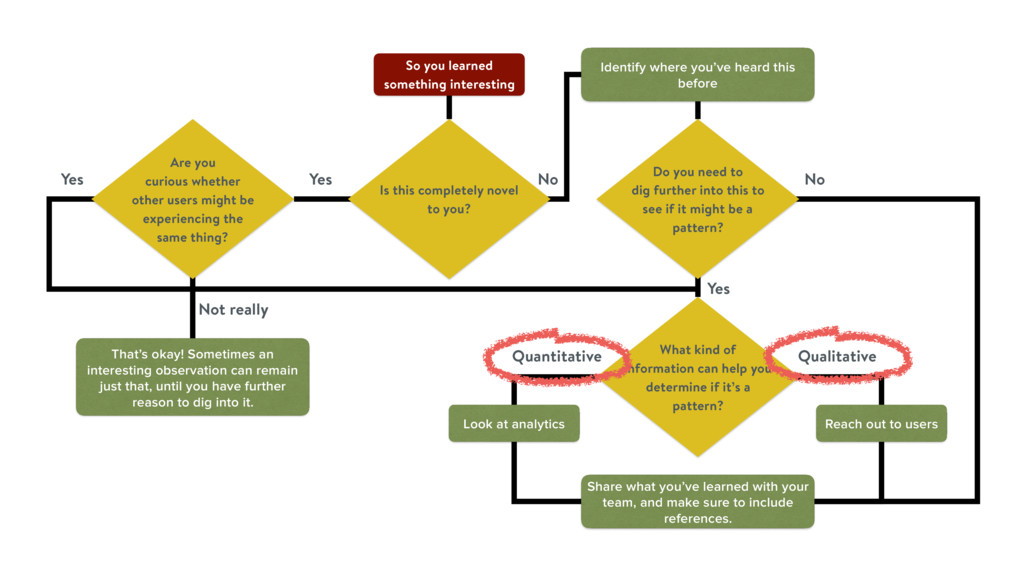
Design is no longer a solitary activity happening behind a monitor: more and more designers are out in the field, observing, exploring and learning from their users. But how can they transform their findings from a handful of anecdotes into valid research insights?

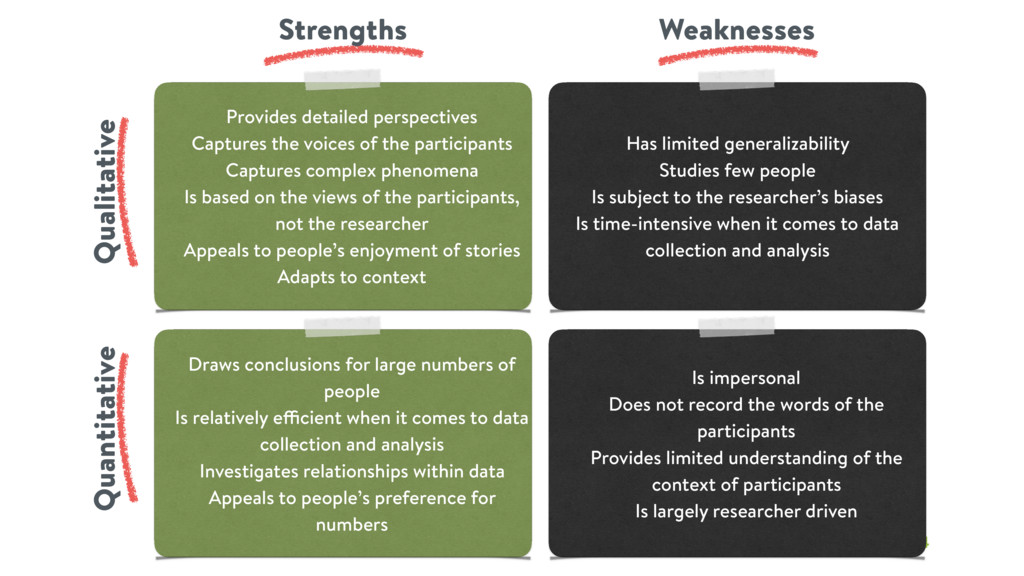
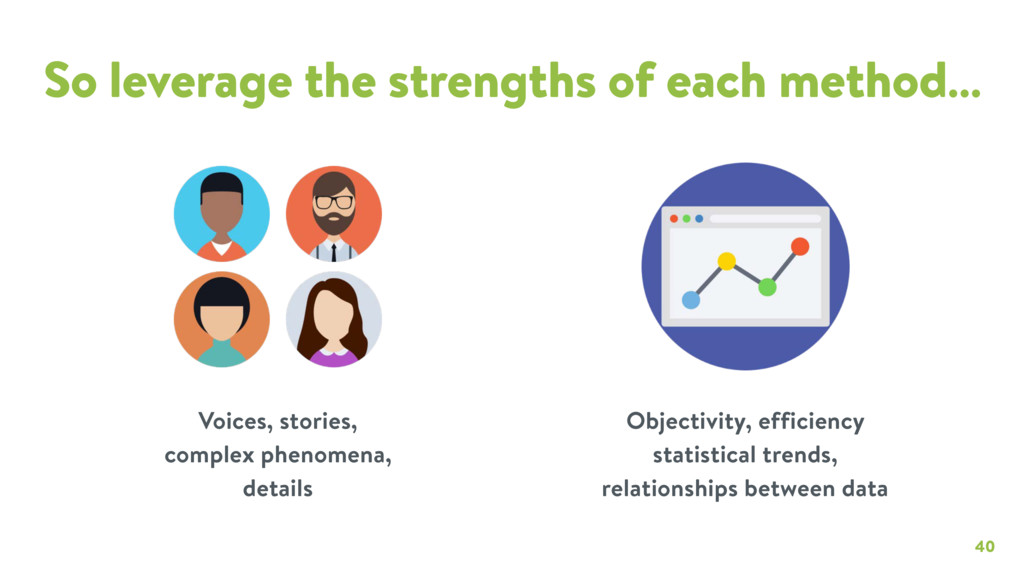
A few anecdotes can be more detrimental than no research—they can cause designers to forgo their instincts in favor of incomplete data. But turning anecdotes into insights isn’t just a matter of collecting the qualitative and quantitative data to support them: it’s about blending the two correctly, understanding how they complement each other, and knowing which to use at each stage of the design process.

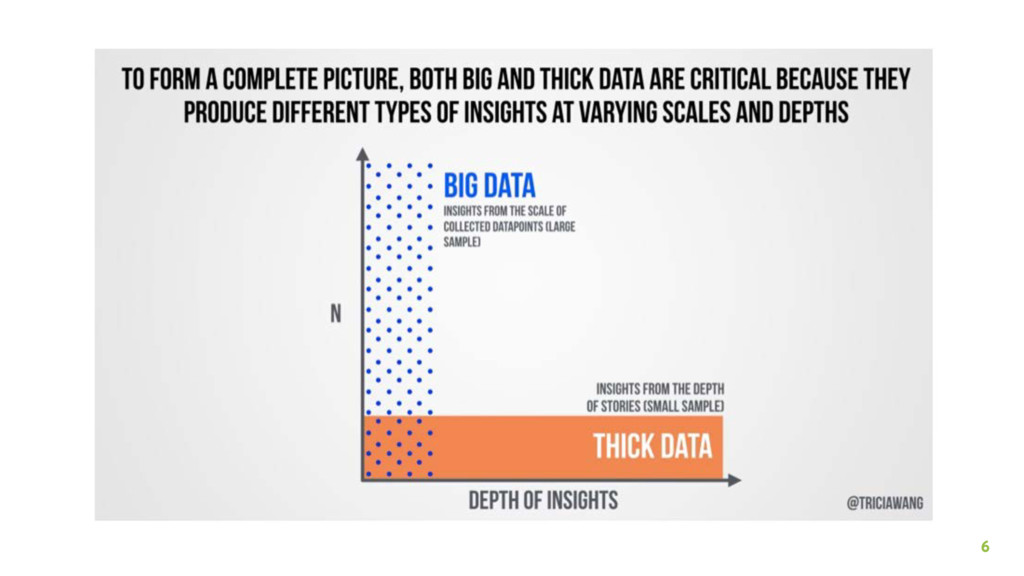
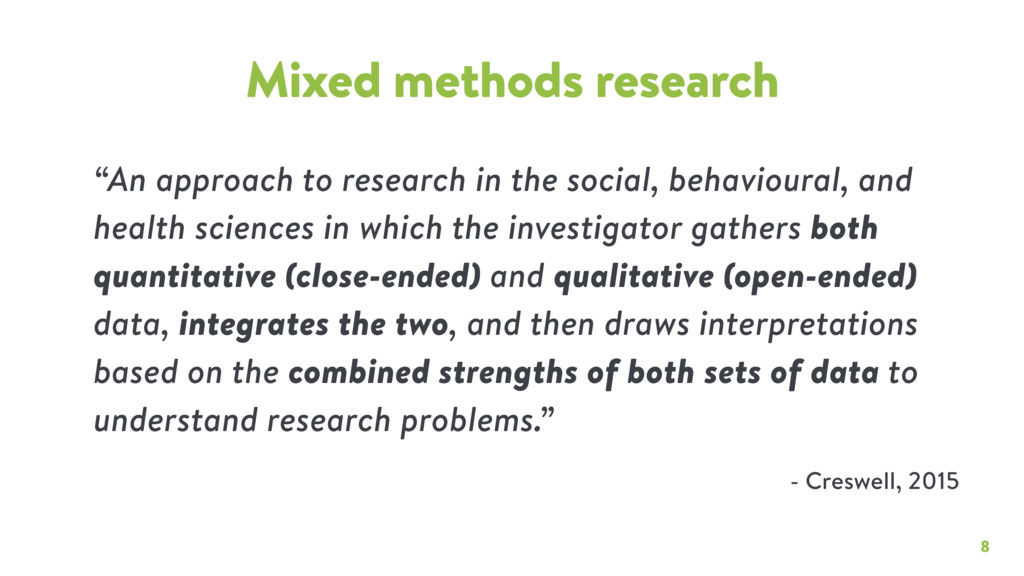
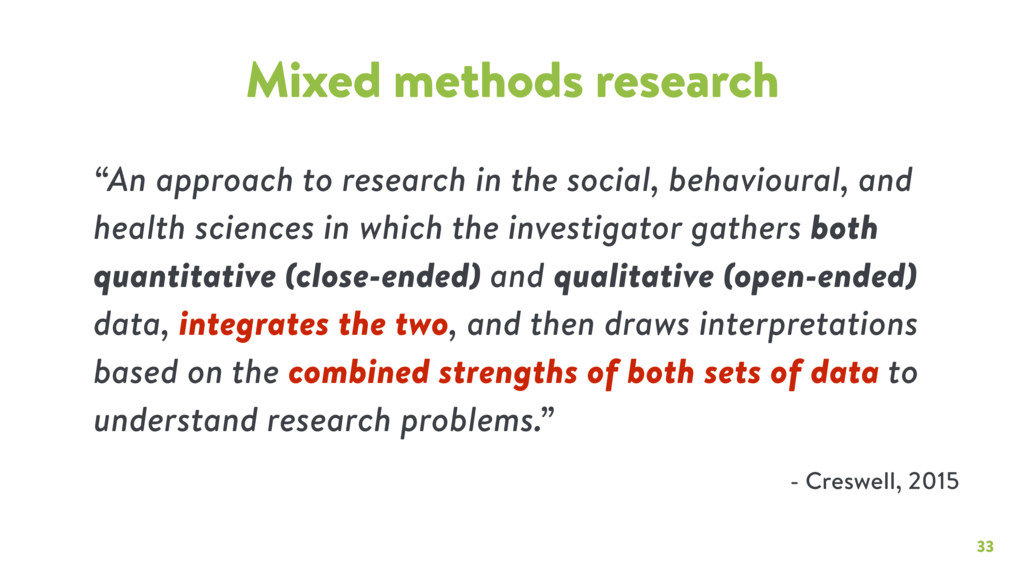
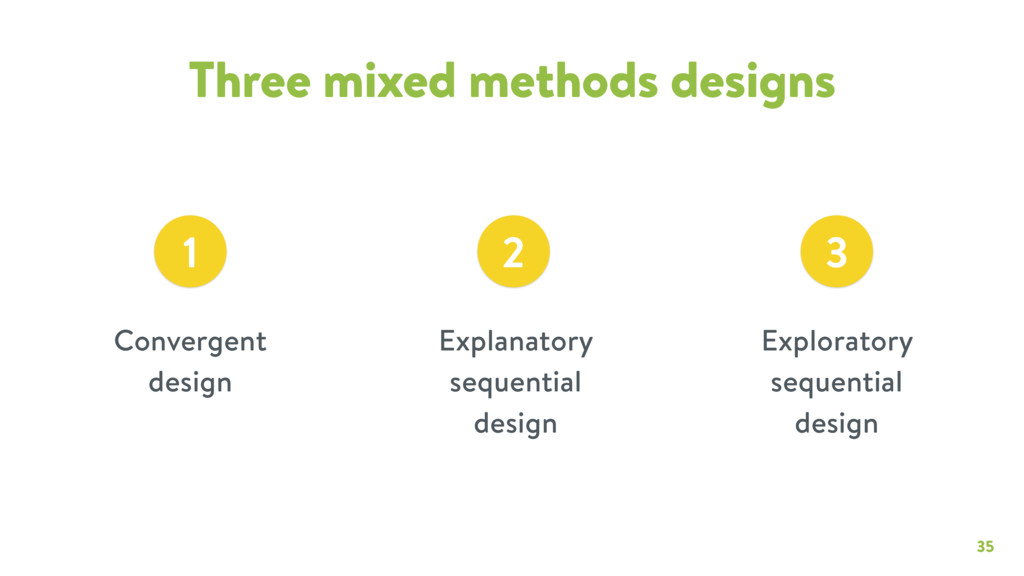
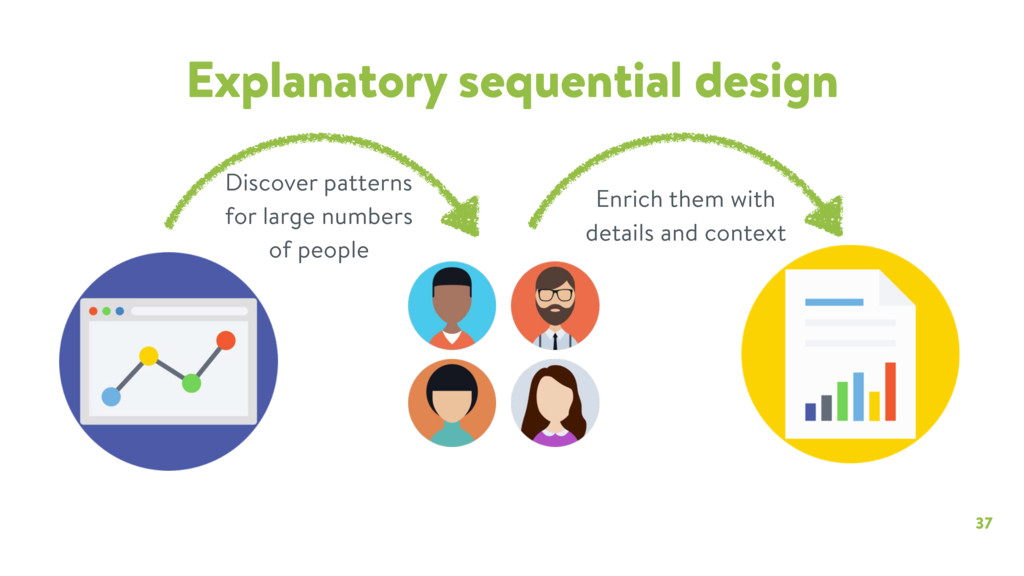
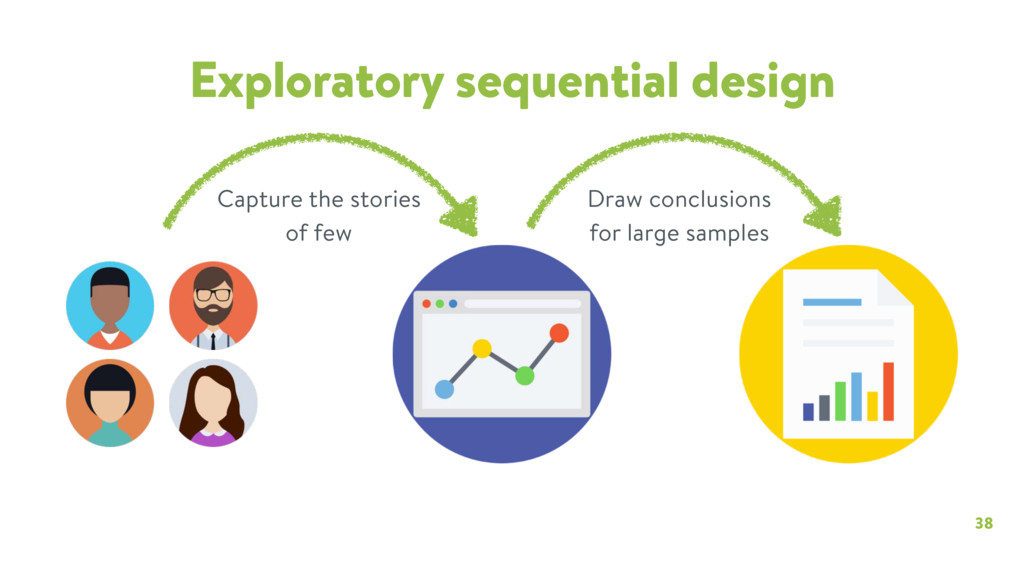
This is where mixed methods research comes in handy. With over 25 years of proven experience in the social sciences, mixed methods integrates quantitative and qualitative research in a way that capitalizes on the strengths of both. But since it’s often presented as a dense academic topic, mixed methods can be daunting for those with a limited or primarily qualitative research background. This talk will introduce mixed methods in a design context, and illustrate through concrete examples how it can give designers the confidence that their work is shaped by valid insights rather than anecdotes.

Presented by Dalia El-Shimy at Design Research 2017

uxaustralia

March 09, 2017
Tweet

More Decks by uxaustralia

Other Decks in Design

Transcript

  1. 1 TURNING ANECDOTES INTO INSIGHTS MIXED METHODS RESEARCH IN SUPPORT

    OF DESIGN DALIA EL-SHIMY SENIOR UX RESEARCHER AT SHOPIFY
  2. 2

  3. 3

  4. That’s okay! Sometimes an interesting observation can remain just that,

    until you have further reason to dig into it. Share what you’ve learned with your team, and make sure to include references. Yes No Yes Not really No Yes Quantitative Qualitative Reach out to users Look at analytics What kind of information can help you determine if it’s a pattern? Do you need to dig further into this to see if it might be a pattern? Identify where you’ve heard this before Are you curious whether other users might be experiencing the same thing? Is this completely novel to you? So you learned something interesting
  5. 6

  6. 7 When you combines statistical trends with stories and personal

    experiences, the collective strengths of both provides a better understanding of the research problem than either forms of data alone.
  7. 8 Mixed methods research “An approach to research in the

    social, behavioural, and health sciences in which the investigator gathers both quantitative (close-ended) and qualitative (open-ended) data, integrates the two, and then draws interpretations based on the combined strengths of both sets of data to understand research problems.” - Creswell, 2015
  8. 10

  9. 11

  10. 13

  11. 17

  12. 18

  13. 19

  14. 20

  15. 21

  16. 25 Questions: • What potential problems might we solve? •

    How might we gather context on the problem? Getting shit done Qualitative • Existing research • Observations, interviews, diaries, internal workshops Quantitative • Existing data • Establishing facts, confirming/disproving assumptions
  17. 26 Questions: • What are the root problems? • What

    are the biggest challenges we might focus on? Getting shit done Qualitative: • Profiles/segments/personas • Interviews, co-design/participatory workshops Quantitative: • Quantify how big are the segments that would benefit from this product
  18. 27 Questions: • How might we be scrappy and effective

    when testing assumptions and hypotheses? Getting shit done Qualitative: • Lo-fi prototype testing • Clickable mockups Quantitative: • Define success metrics and baseline for those project success metrics
  19. 28 Questions: • Can people use what we’re building? •

    Is what we’re building addressing the initial problems and goals? Getting shit done Qualitative: • High-fidelity usability tests • Diary studies • Beta testing Quantitative: • A/B tests, instrumentation, reporting
  20. 29 Questions: • Are people using it in the way

    we thought they would? • Did we successfully solve the problem we identified? Getting shit done Qualitative: • Forums/social media monitoring • Open-form feedback forms Quantitative: • Monitor success metrics, more reporting
  21. 30 Questions: • What incremental improvements might be worthwhile? •

    What revisions should we make to our roadmap? Getting shit done Qualitative: • Retrospectives • Post-mortem • Analysis of support tickets Quantitative: • More A/B tests • More reporting
  22. 31 Phase Question Qualitative Quantitative Idea What potential problems might

    we solve? Existing research, observations, diaries Establishing facts, confirming assumptions Think What are the root problems? Interviews, co-design/ participatory workshops Quantify segments Explore How might we test assumptions and hypotheses? Lo-fi prototype/mockup testing Define success metrics, measure baselines Build Can people use what we’re building? High-fidelity usability tests, diary studies, beta tests A/B testing, instrumentation, reporting Launch Are people using it in the way we thought they would? Forums/social media monitoring Monitor success metrics, more reporting Tweak What improvements might be worthwhile? Analysis of support tickets, retrospective More A/B tests, more reporting
  23. 32 S O HOW DO YO U GO FROM QUA

    NTITATIVE AND QUALITATIVE TO M IXED METHODS?
  24. 33 Mixed methods research “An approach to research in the

    social, behavioural, and health sciences in which the investigator gathers both quantitative (close-ended) and qualitative (open-ended) data, integrates the two, and then draws interpretations based on the combined strengths of both sets of data to understand research problems.” - Creswell, 2015
  25. 34 Provides detailed perspectives Captures the voices of the participants

    Captures complex phenomena Is based on the views of the participants, not the researcher Appeals to people’s enjoyment of stories Adapts to context Draws conclusions for large numbers of people Is relatively efficient when it comes to data collection and analysis Investigates relationships within data Appeals to people’s preference for numbers Has limited generalizability Studies few people Is subject to the researcher’s biases Is time-intensive when it comes to data collection and analysis Is impersonal Does not record the words of the participants Provides limited understanding of the context of participants Is largely researcher driven Strengths Weaknesses Qualitative Quantitative
  26. 35 Three mixed methods designs 1 Convergent design 2 Explanatory

    sequential design 3 Exploratory sequential design
  27. 39 Experiment: Is there interest? Data: Who might be interested?

    Research What might be of value to user X? Experiment: Is feature Y of value? Yes User X Research How can we better understand user X? Data What else do we know about user X? Feature Y Research What does the current user journey look like? 1 Convergent design Explanatory sequential design 2 Exploratory sequential design 3
  28. 40 So leverage the strengths of each method… Voices, stories,

    complex phenomena, details Objectivity, efficiency statistical trends, relationships between data