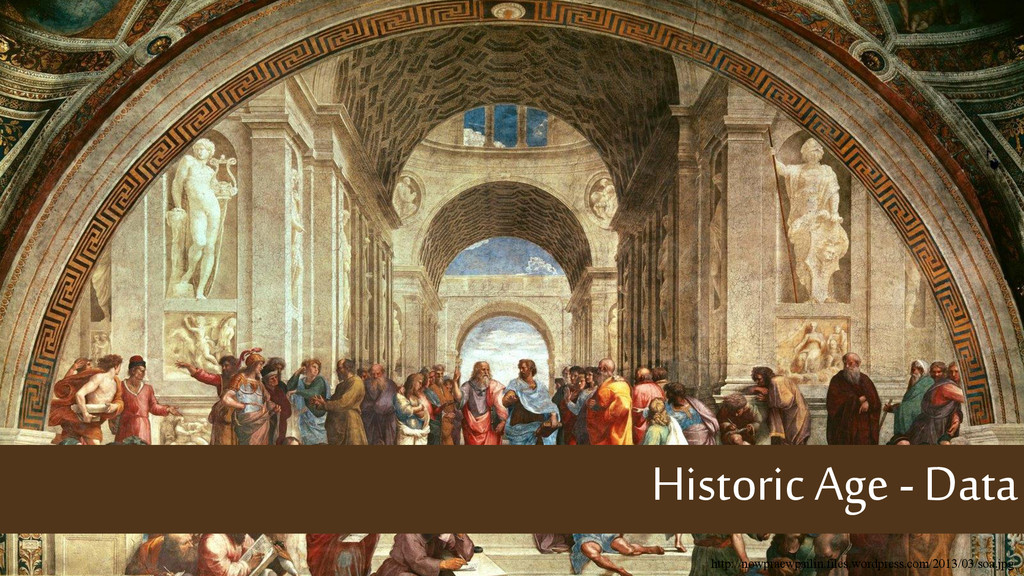
There was an era of manufacturing boom during renaissance period. That era was known as atomic age. During those times, atoms were considered to be the most fundamental particles, which everything is made of.
That era was followed by another when manufacturing reached at its saturation level. Nearly at the same time, computers were introduced in. It started to cover the entire global map in no time and that is how the era of bits came into existence.
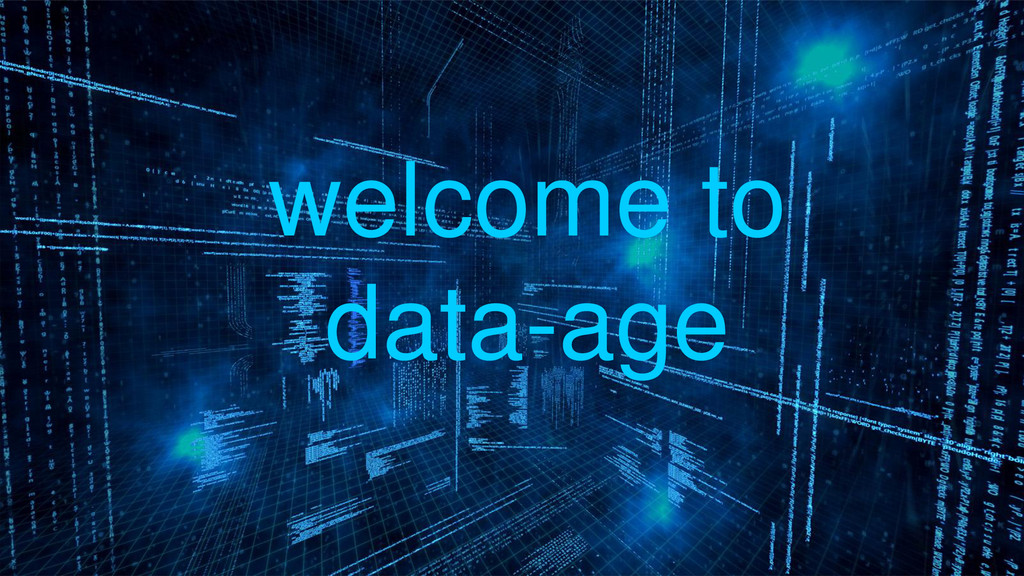
I believe, the era of bits however has helped in the accelerated growth of human beings, yet it has resulted into the mechanization of humans and made them think like computers. To retain the humane attributes of humans its quite imperative to take care of human factors which demands the transformation of these bit data into consumable format for a human being.
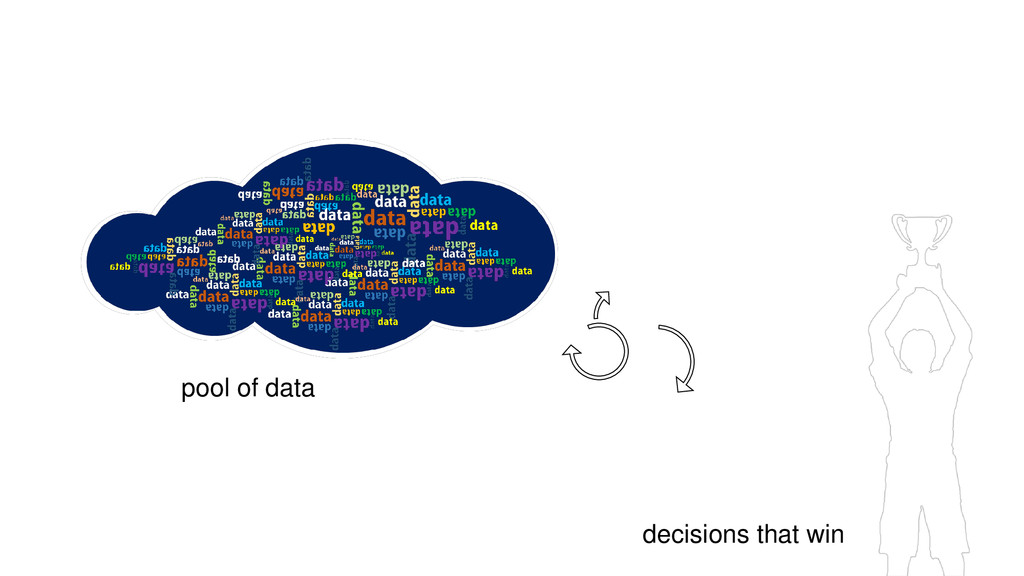
And that is how, we are stepping into data-age. We are inundated with data all around us. Clearing that clutter from our lives and transforming only the necessary data into a readable and conceivable form for humans is the need of the hour to make decisions in every walk of life.
Welcome to fun-filled Data- Age !