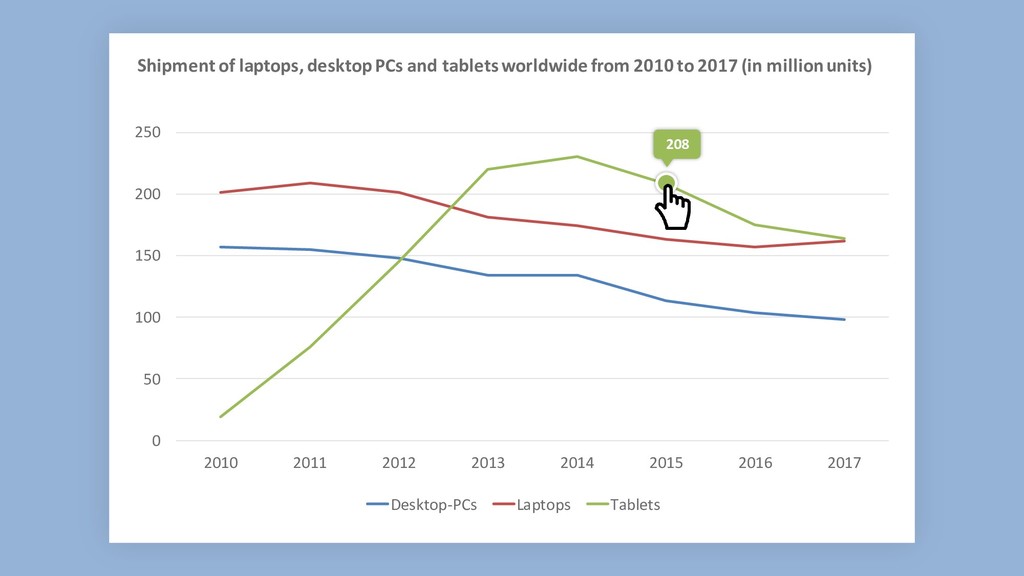
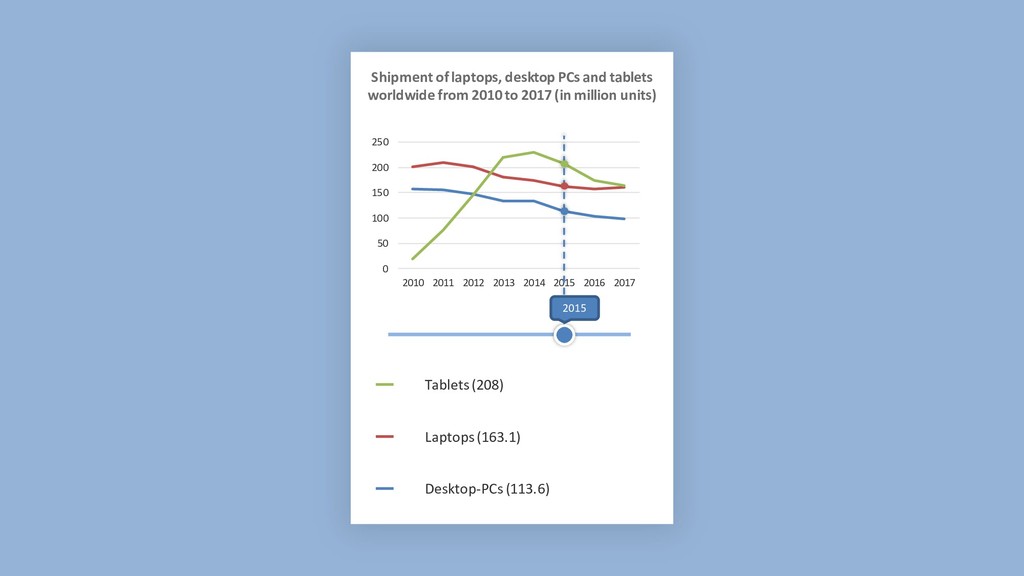
2014 2015 2016 2017 Tablets (208) Laptops (163.1) Shipment of laptops, desktop PCs and tablets worldwide from 2010 to 2017 (in million units) Desktop-PCs (113.6) 2015
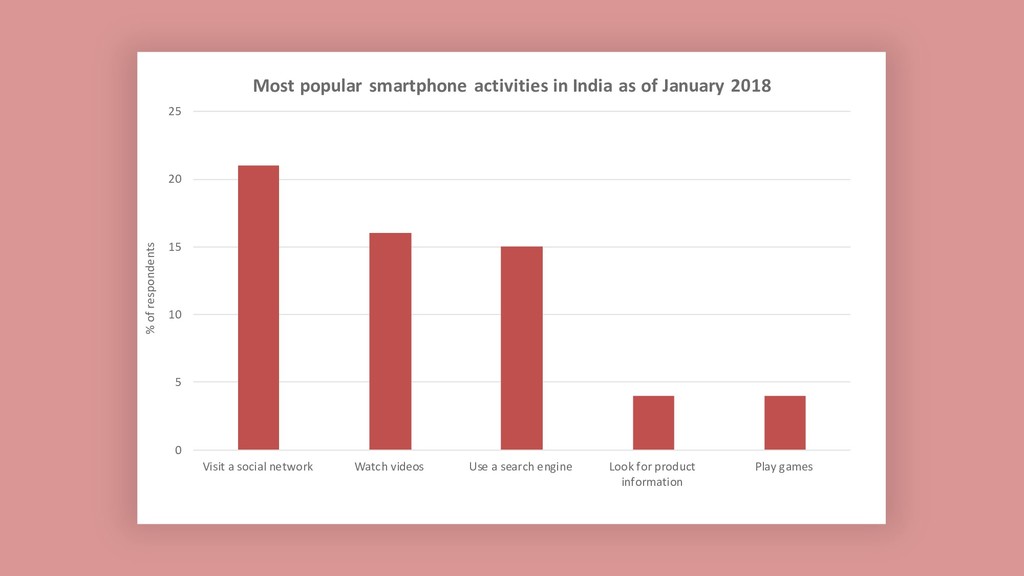
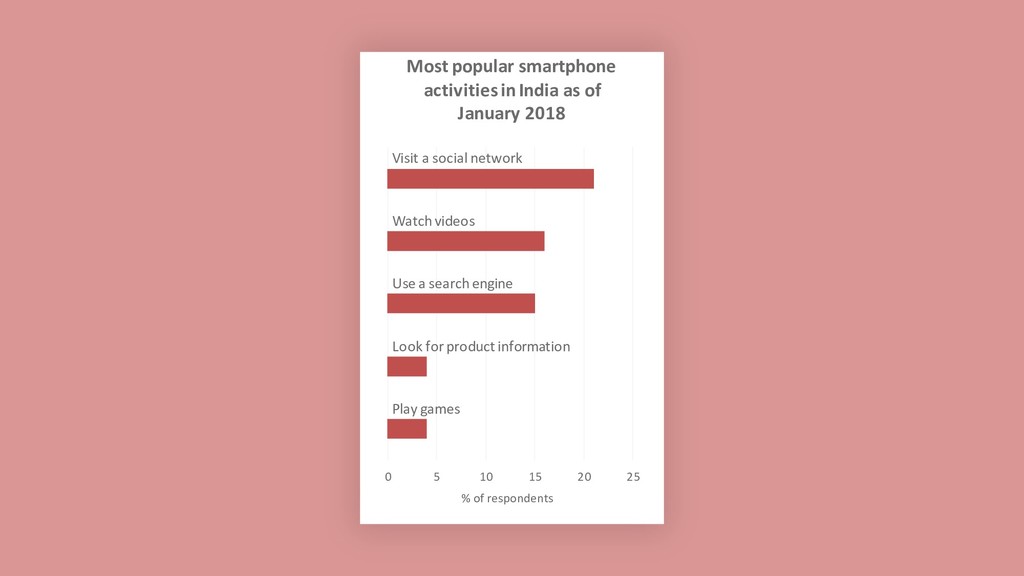
Watch videos Use a search engine Look for product information Play games Most popular smartphone activities in India as of January 2018 % of respondents
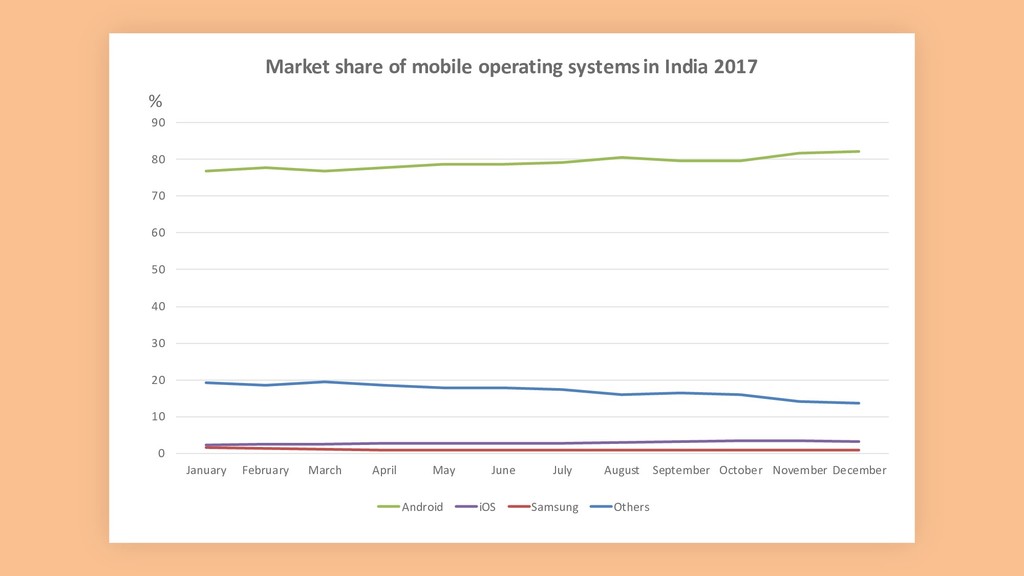
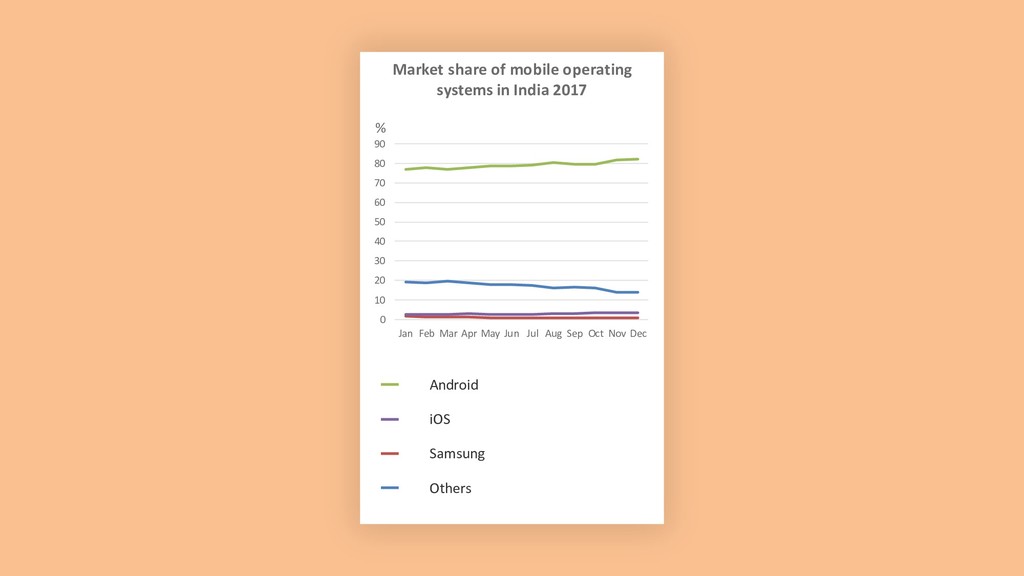
January February March April May June July August September October November December Android iOS Samsung Others Market share of mobile operating systems in India 2017 %
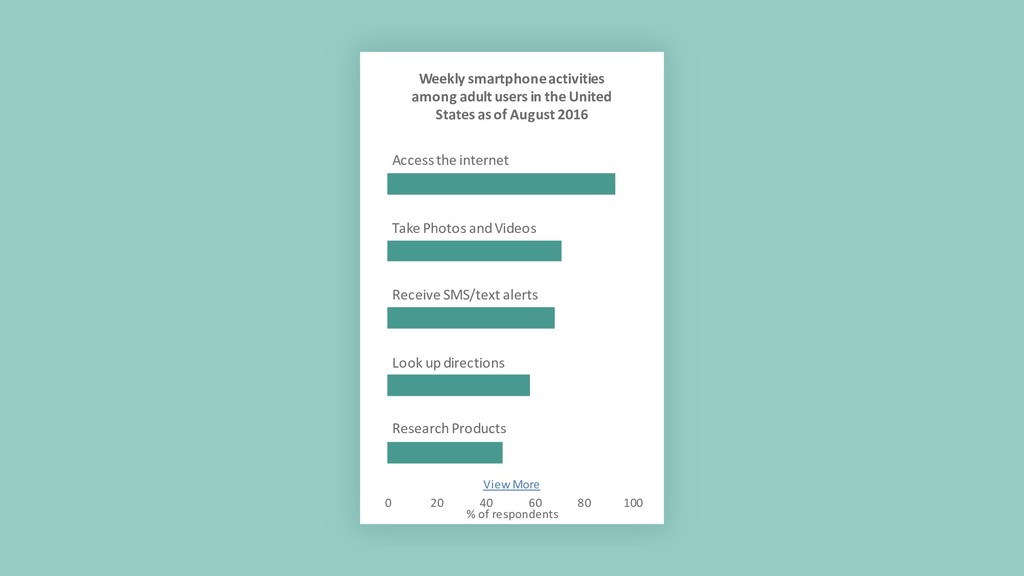
100 Download videos/TV shows Watch videos/TV Shows (Stored on device) Download Music Purchase Products Stream videos/TV Shows Use Geolocation Services Play Puzzle/word based games Send or Receive work email Stream Music Listen to Music (Stored on Device) Research Products Look up directions Receive SMS/text alerts Take Photos and Videos Access the internet Weekly smartphone activities among adult users in the United States as of August 2016 % of respondents
adult users in the United States as of August 2016 Research Products Look up directions Receive SMS/text alerts Take Photos and Videos Access the internet View More % of respondents