Upgrade to Pro — share decks privately, control downloads, hide ads and more …

Observability BLR Meetup, 26th Sep, 2020

Avatar for venkatvghub venkatvghub
September 26, 2020

Observability BLR Meetup, 26th Sep, 2020

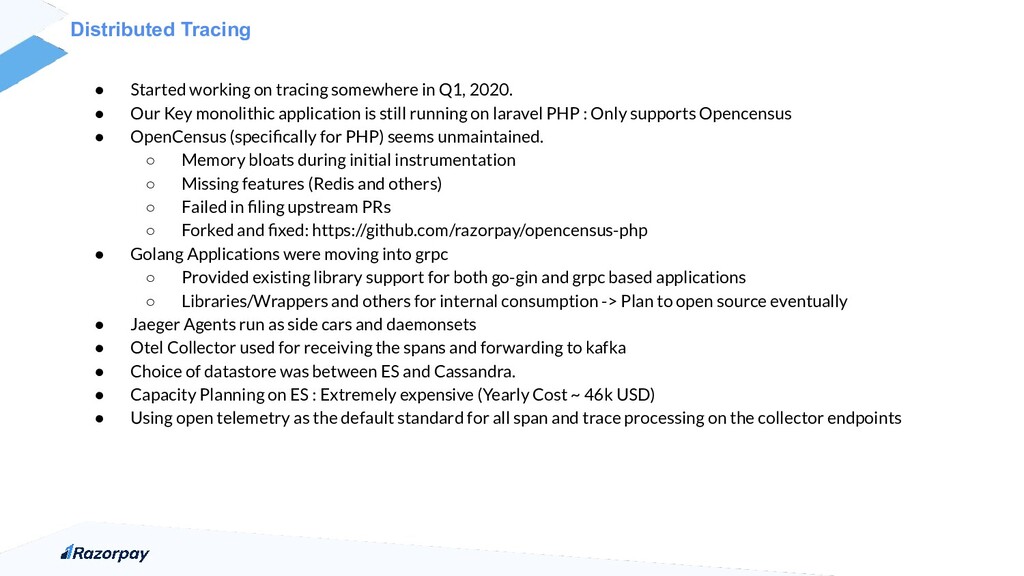
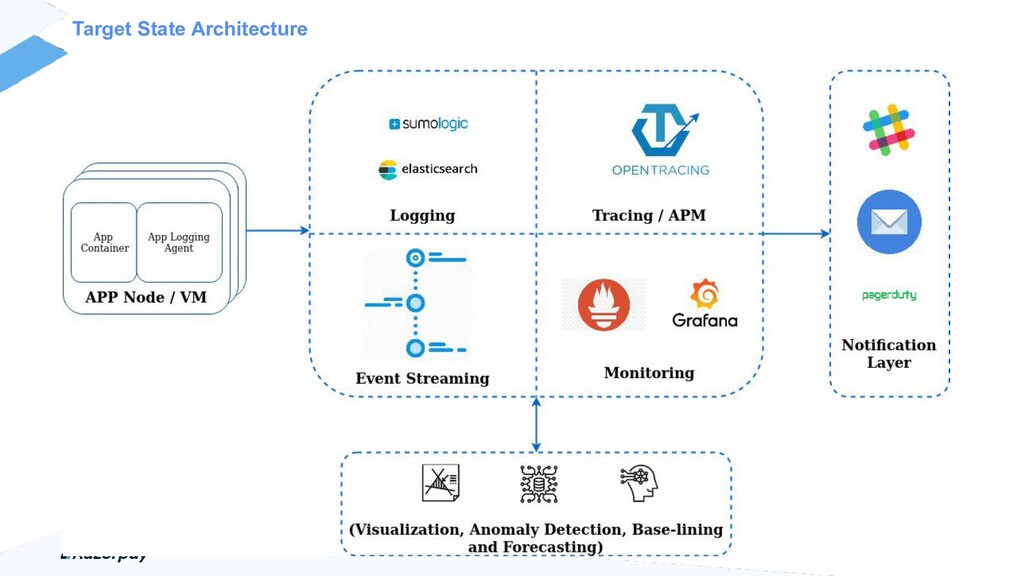
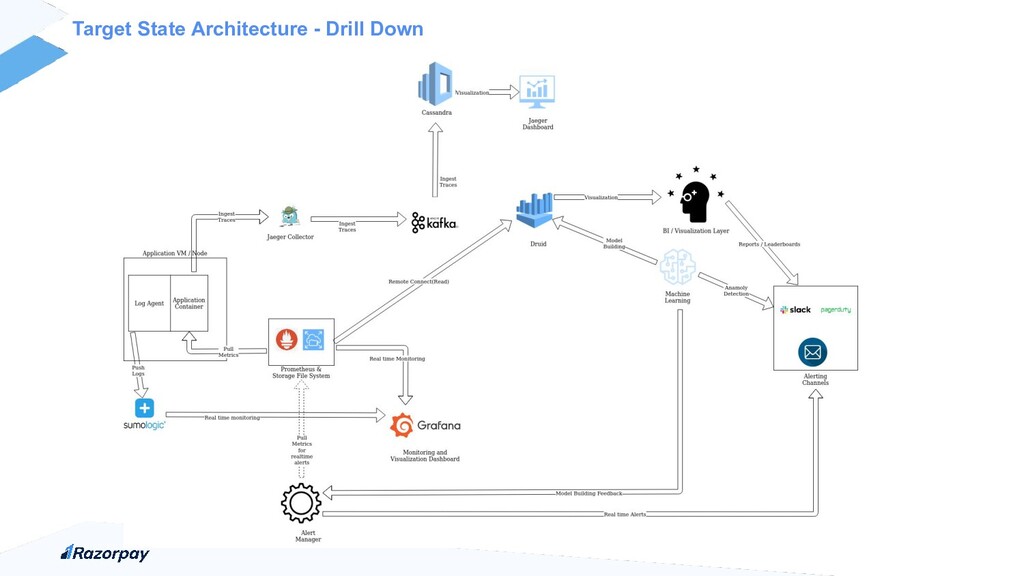
Talk around our journey of moving from Paid APM tools into open source observability platforms. We focus on our path, success and failure stories. More specifically, when does it make sense to build vs buy, what are the challenges in building home grown solutions and leveraging and building upon some existing stuff. Alongside, also some interesting contribution ideas to the Open Telemetry Collector, its limitations, Scaling Issues amongst others

Avatar for venkatvghub

venkatvghub

September 26, 2020
Tweet

Other Decks in Technology

Transcript

  1. Observability Meetup, 26th Sep, 2020 - Venkat V (@vv /

    Kubernetes Slack) - https://www.linkedin.com/in/venkatesanv/
  2. Who are we? Transforming the world of business finance with

    insight, intelligence and invention A full-stack payments & banking company that empower Indian businesses of all calibers with a comprehensive payments and banking experience - thereby addressing the entire length and breadth of a business’ payment journey. We enable them to accept, process, and disburse payments via industry-first solutions like RazorpayX, our neo-banking platform and Razorpay Capital, our lending arm. Razorpay processes multi-billion USD payment volume annually for most forward-thinking businesses across India and witnessed a 500% growth in 2019.
  3. Journey thus far 2015 2016 2017 2018 2019 Launch of

    Payment Gateway • Demonetization • Launch of ePOS • First to launch UPI Payments • Subscription Management • Razorpay 2.0 - Launch of converged solutions • Launch of eNACH and Aadhaar payments • UPI 2.0 demo and launch • Razorpay Capital • RazorpayX - NeoBanking platform • Launch of Payment Pages • Launch of Instant Refunds • 2 Acquisitions: Opfin and Thirdwatch 2020 • Payments for freelancers • Neobanking Current Accounts • Commercial cards
  4. Anti-Thesis : Some General Disclaimers Rule #1 : Don’t build

    your own observability stack, unless you really need to do so Rule #2: We have some reasonably inexpensive options(APM + Others) for first trying and leveraging things. Rule #3: Your journey might look like the following: - Structure Your logs -> Work at scaling and building/leveraging a good logging platform - Metrics -> Prometheus + Grafana -> This should handle a lot of use cases for you - Tracing : Only attempt when you have a reasonable number of micro-services (or inter connected services) Rule #4: The moment you probably cross 30 + services and/or 200 + engineers, now start looking for TCO of building an observability platform vs what exists out there : Infra Cost + Dev Cost + People cost (Engg. Salaries aren’t cheap) Rule #5: Scale -> Tune -> Repeat Cycle Rule #6: If you still have doubts, go back to Rule #1 above.
  5. Checkout Dashboard Merchant Servers Payments Monolith (PHP) Banks/Gateways MySQL -

    RDS 2 servers Web servers <10 Employees 4 Engineers 1 Service External service 5 GB Per day Logging Redis 2015 2017 2019 Application & Infra Overview
  6. Raven Gimli Hosted Auth Microservices - PHP/Golang Payments Monolith (PHP)

    Checkout Dashboard Merchant Servers Banks/Gateways MySQL - RDS Redis ElasticSearch Harvester (Python) ElasticSearch RDS Replica 20 servers Web servers <100 Employees 25 Engineers 7 Services External services 20 GB Per day Logging 66k Txns Per day 2015 2017 2019 Application & Infra Overview
  7. Key Performance Metrics - In the middle of the pandemic

    3000 Peak Transactions per second 0.02% Fraud to Sale ratio since April ‘19 70 Million payment requests in July 2020 100% uptime for May/June/July 2020 100+ No of Services 15k -20k Requests per second 1500 Deployments per Month
  8. So What Changed in the past few years for us

    • Movement into production kubernetes around 2017 • Evolution of engineering/business growth and services • Opex and overall cost control ◦ Logging, Monitoring needs started growing ◦ Infrastructure costs kept growing • Changes in our core language stack -> Move to golang and additional tooling • Overall Re-architecture ◦ Monolith breakdown ◦ Introduction of API Gateway, Handling East-West Communication • Outbound Footprint Increase ◦ More external parties to talk to ◦ More emails, sms, webhooks among others
  9. What did we have (atleast till last year) • And

    then there was newrelic(APM) : Introduced sometime in 2017 • Prometheus and Grafana ◦ Prometheus HA moved into Thanos • Kubernetes Cluster Split : CDE vs Non CDE • Logging ◦ Moved from Splunk(2015) to EKF (2017) to Sumo Logic (2018) • Event Pipeline ◦ Business events emitted from applications into our data lake ( ~ 1 B events a day) • Additional Tooling ◦ Slow Query Logs, PMM, Connection Pooling, Circuit Breaking amongst others
  10. What was wrong with the above? • Newrelic wasn’t really

    useful ◦ Instrumentation nightmare with lots of tooling being done for golang ◦ Vendor Lock In posed additional issues • Prometheus and Grafana ◦ Thanos Query Layer was a bottleneck + long term retention (metric ingestion grew to a few million units) ◦ Prometheus federation + Thanos -> Thanos query layer was still a bottleneck • Kubernetes Cluster Split ◦ How do you now understand interservice failures • Logging ◦ 2 TB logs per day. How to make sense of this? • Event Pipeline ◦ Funnel analysis was getting complex. ◦ We didn’t have distributed tracing(We were late to the party)
  11. Additional Business Asks & Problems So, with the above: •

    Current Business / Engg Metrics Monitoring is scattered : Prometheus, BI Tools, Logs, Newrelic, Sentry • Grafana Alerts / Prom Alert Manager: Inherently Rule based: Known- Knowns • Inherently reactive and not proactive Which means: • How to make sense of the data for pro-active monitoring (handling unknown-unknowns) • Allow product and business users to design their key metrics, kpis and be automatically notified for violations (SLO/rule based/sciences based) • SLA / SLO Adherence -> Can we make it better? In Essence: • Improve overall availability of applications in the organization • Reduce MTTD by reduced issue identification mechanism through a unified model • Provide a single pane of “visibility” into the behavior of the systems • Improve some of the broken monitoring above into providing robust dashboarding and monitoring capabilities • And yet, keep the costs low (Internal Code name: @techbaniya)
  12. Some Questions we want to ask • Observed dip due

    to downstream http/network service being down • Observed dip due to query / cache performance • Observed dip due to aws components • Observed dip due to surge in traffic • Observed dip due to memory / cpu or other infrastructure pieces • Observed dip due to a new deployment
  13. Some Insights : Late 2019 / Early 2020 • Current

    Log volume across all of razorpay ~ 2 TB/day(only applications) • Number of data points metrics store(prom) ~ 200M events/sec (infra + applications) • Newrelic Insights: ◦ Overall Yearly Cost: 160K USD (without overages) ◦ Razorpay Monthly Active users for APM: < 70 ◦ Weekly recurring users for APM: <30 ◦ NR metrics vs vajra metrics debatable(e.g.: memory, cpu, goroutines, JVM metrics) ◦ Inherently not container native (late realization at scale) - Cost + Otherwise • Future Predictions (2.5x scale growth(conservative) by 2021): • Distributed Tracing events (spans): 500M / day or 197B / year Number of Platform Requests - 90M (taking numbers from peak week of April, 2020) Events per day = Number of requests day * growth rate * spans per trace = 90M * 2.5 * 20 = 4500 M = 4500 M Events per day with sampling rate of 12%(*) = 540M Events per year with sampling rate of 12% = 540M*365 ~ 197B
  14. Some initial goals laid out • How are we going

    to build a single first pane of observability? Where should devs look at, on that bad day? • Logs to metrics -> Use Metric variations for alerting and then dig down to logs • A strong need for enabling tracing / distributed tracing in our applications • Replace newrelic with something cheaper and container native. • Rebuild/replace/extend prometheus and grafana to be more robust: ◦ Low to No query timeouts ◦ Long term metric retention • Powering the above data for sciences with a strong feedback loop
  15. Observability Experiments • Grafana Loki ◦ ✅ Metrics to log

    correlations ◦ ✅ Metrics, logs and traces in one place. ◦ ❌ Too early for production, stability issues reported by users • HoneyComb ◦ ✅ SAAS platform for observability, anomaly detection ◦ ✅ Supports open telemetry, open tracing ◦ ❌ Sampling on our side or pay for unsampled data • LightStep ◦ ✅ SAAS platform for monitoring with clean UI, support unsampled data ◦ ✅ Supports open telemetry, open tracing ◦ ✅ Free infrastructure metrics ◦ ❌ Limited query capabilities which are used in dashboards and alerting ◦ ❌ Disguising data retention period Note: We tried a bunch of other players like datadog, instana, and pretty much many others
  16. Fixing Prometheus & Grafana: Robust Metric Dashboard What exists: •

    Current monitoring is done via prometheus + visualization via grafana (vajra) • Prometheus HA, Thanos et.al, Alert Manager • We had multiple prometheus instances : Infrastructure(AWS/CloudWatch/CAdvisor) + CDE Applications + Non CDE Application • Thanos solved the HA part for prometheus, but didn’t go beyond a couple of hours to a day in-terms of dashboard visibility • Hardware cost: 7*r5.8xlarge + 1*r5.12xlarge ~ 10160.64 + 2177.28 = ~ 12k USD / month • Prom HA pairs, doubles it. We have in all 9 proms(that's roughly above * 9) Current Production Prometheus Numbers (Early 2020):
  17. Fixing Prometheus & Grafana: Robust Metric Dashboard What do want?

    • Can we write prom data to a better place such that: ◦ Querying, Alerting and Dashboarding can happen from there and faster, while.. ◦ Prom manages only incoming data and writes here. • Can we reduce the cost? Solutions? • Available Solutions : Cortex, Victoria Metrics, M3DB • Cortex chosen : CNCF, Grafana labs, impressive metrics, robust architecture(ahem! well..) • All worked well and stage and moved to production for running in shadow mode • All's well that ends well..(Well! Really?)
  18. Cortex Architecture • Distributors handle load from ingestion • Ingesters

    handle writing and reading from remote store • Ingesters are stateful maintaining recent metrics in memory, memcache for metrics cache. • Querier talks to ingesters, memcache and remote store • Ingesters maintain stateful hand-offs when dying. • Each component can be scaled out independently. • Additionally supports alert manager built-in • Clear segregation of reads(via querier->ingester) and writes(distributors->ingester)
  19. Cortex: Did it actually keep up its word? So, what

    happened? • Setup was done on stage and was running quite successfully for a bunch of dashboards over 2 weeks(Mid May) • Bunch of capacity planning exercises, lots of hiccups and finally was working • Moved to production by End of May, 2020 • Things started breaking around 2-3 days with constant manual intervention: ◦ Unable to handle production workload ◦ High cardinality in some dashboards. E.g.: sum(rate(http_requests_total{pay_mode="[[pay_mode]]",http_route="[[route]]"}[5m])) by (rzp_internal_app_name) * 60 ◦ Ingesters were constantly going down. ◦ Eventual capacity needed around 10 ingester pods(nodes), around 5 distributor, 3 consul nodes, 5 cassandra nodes among others. ◦ In all, a complete disaster happened around 24th of June What should have been caught? • Time wasted and lessons learnt the hard way • Needed serious baby sitting, and lots of attention (ADHD) • Worse, the slack group was non responsive, to say the very least • Cost and available choices for us? S3/Dynamodb/Cassandra • So, what now?
  20. Enter the Queen • Simple Components, each horizontally scalable. •

    Clear separation between writes and reads. • Runs from default configurations, no extra frills. • Default retention starts with 1 month • Storage, ingestion and reads can be easily scaled. • High Compression store ~ 70% more compression. • Currently running in production with commodity hardware(m5.2xlarge) with a good mix of spot instances. • Took some of the worst dashboards, that filed over cortex and run via VM.
  21. And Finally What we achieved: • Victoria metrics runs on

    commodity hardware with almost spot instances(except vmstorage) • Prom Remote Write -> Victoria Metrics : Exiting Prom cost reduced to half with the above. • Dashboards are loading very smooth(litmus tested with some hard ones) • Adoption was easier. Replaced all default dashboards with victoria metrics • Existing Alerts via alert manager moved into vmalert • Running in production for over a quarter and pretty smooth • Gitops based alert/dashboard creation and rollout • Default retention kept for 1 month at the moment. • Re-Architected Prom itself and made it lot more federated Road Ahead: • Replace prom itself with vmagent (currently testing on non production). Claims to reduce overall hardware footprint Some numbers to boast:
  22. Distributed Tracing • Started working on tracing somewhere in Q1,

    2020. • Our Key monolithic application is still running on laravel PHP : Only supports Opencensus • OpenCensus (specifically for PHP) seems unmaintained. ◦ Memory bloats during initial instrumentation ◦ Missing features (Redis and others) ◦ Failed in filing upstream PRs ◦ Forked and fixed: https://github.com/razorpay/opencensus-php • Golang Applications were moving into grpc ◦ Provided existing library support for both go-gin and grpc based applications ◦ Libraries/Wrappers and others for internal consumption -> Plan to open source eventually • Jaeger Agents run as side cars and daemonsets • Otel Collector used for receiving the spans and forwarding to kafka • Choice of datastore was between ES and Cassandra. • Capacity Planning on ES : Extremely expensive (Yearly Cost ~ 46k USD) • Using open telemetry as the default standard for all span and trace processing on the collector endpoints
  23. Challenges Encountered Collectors: • Otel Collectors have a tail based

    sampler, but it is stateless. Makes it completely useless for many scenarios. • Grafana fork above is way too out-dated. Built a personal fork. Why? • It still doesn’t solve some composite patterns: e.g. Specifically model around latencies and extend at a per svc level Agents: • To avoid network transmission costs, can the agents handle the above sampling and only push sampled traces to the collector • Can we decorate the spans with k8s specific attributes and other custom user attributes by default: pod, cluster, zone, ip, user agent etc -> Otel Contrib has some examples. Span Decoration: • In addition to the above, from a visualization perspective, can we normalize the spans based on open telemetry semantics Visualization: • Can we build up towards SLA dashboards, Better Service discovery/Visualization, A Better Query Engine?
  24. What we achieved Tracing • All the critical applications are

    now enabled with tracing • Framework for all new applications to go with tracing. • End to end support for database, cache, queue, network and other interacting components Additional Transformation: • Set explicit limits on cassandra to keep minimal retention policies (At the moment kept for week) • Built Additional pipelines to transform the trace data for ingestion into druid • Long term dashboarding on druid + BI tools being made available easier access • Jaeger UI is a bit restrictive and clunky and lacks certain features ◦ SQL based access to devs via the druid stores on the BI tools for building custom dashboards ◦ Provide additional notification options via slack or otherwise ◦ Custom rule sets / SLO violations defined by the devs Some Numbers: • Our Average number of traces / hour ~ 6 M
  25. Some Unsolved Challenges & Road Ahead Challenges: • Working with

    attribute based sampling as a proxy for tail based. Still certain problems exist • Attribute sampling is clunky. Doesn’t support list based rule sets. Patch in progress. Road Ahead(Exploration and Revisit) • Upstream PR for fixing attribute based sampling (List and regex based rules) • Implement Composite Policy(Ref: https://github.com/open-telemetry/opentelemetry-collector/issues/413) • Possibly also look at Adaptive Sampling • Data Pipelines for Span Normalizer, Structured tracer (Schema Registry), Trace Enrichment and Generating Service Discovery Patterns • Move some of our existing pipelines from golang to flink based processing : Better load and processing distribution
  26. What We have we been able to achieve • Tracing

    - Complete and working with many applications • Robust monitoring with Victoria metrics • Successfully killed Newrelic • Anomaly Detection and Visualization Components - First Phase going in Production Road Ahead(Exploration and Revisit) • Lots of work still pending on tracing (collector, agents, transformation and visualization) • We now have a solid multi year roadmap in the company, internally • Largely going to be work and contribution in the open source community
  27. Learnings • Was it worth building one such? • Cloud

    Costs Aren’t Cheap • Scalability at every single layer : Lots of failures • Standardization of tags across span data. Stick to open telemetry formats and build on it (rzp specific: payment_id, merchant_id etc). Enforce via Schema Registry. Enforce via code. Biggest hurdle: operational Enforcement • How do we make this useful for non engineering folks? Ops, Customer Support etc? • Did we meet our objective?