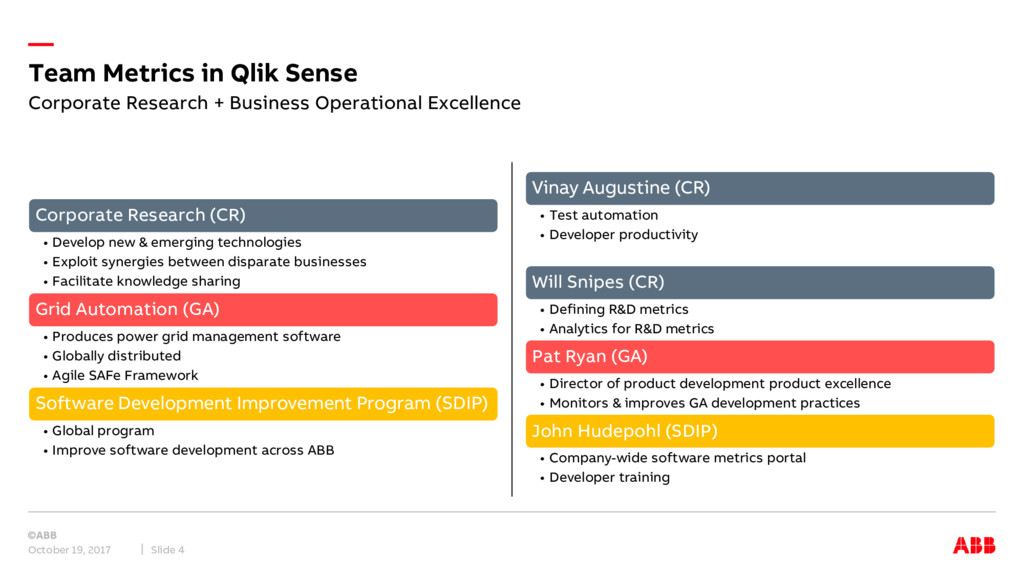
4 Vinay Augustine (CR) • Test automation • Developer productivity Will Snipes (CR) • Defining R&D metrics • Analytics for R&D metrics Pat Ryan (GA) • Director of product development product excellence • Monitors & improves GA development practices John Hudepohl (SDIP) • Company-wide software metrics portal • Developer training Corporate Research (CR) • Develop new & emerging technologies • Exploit synergies between disparate businesses • Facilitate knowledge sharing Grid Automation (GA) • Produces power grid management software • Globally distributed • Agile SAFe Framework Software Development Improvement Program (SDIP) • Global program • Improve software development across ABB Corporate Research + Business Operational Excellence
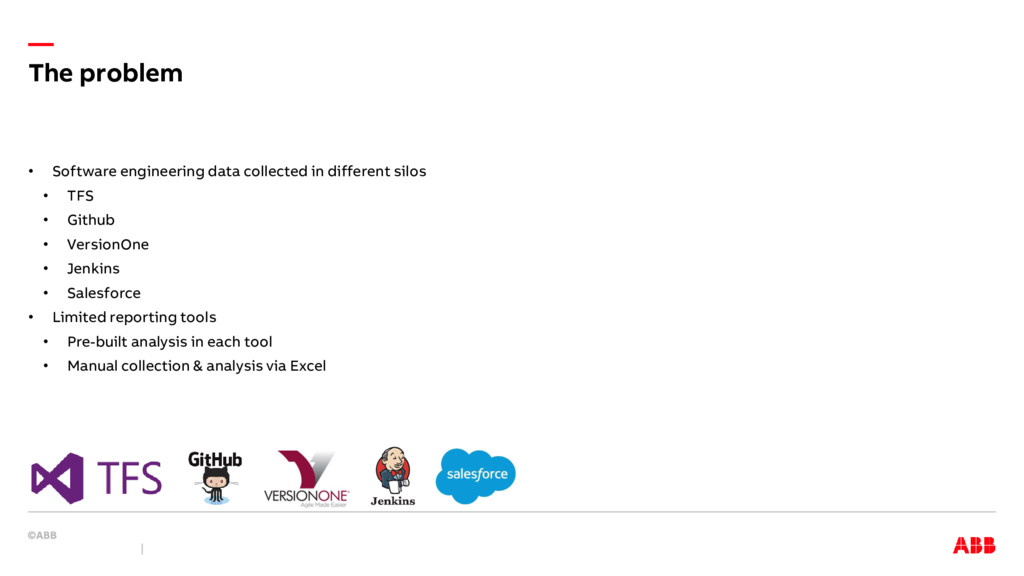
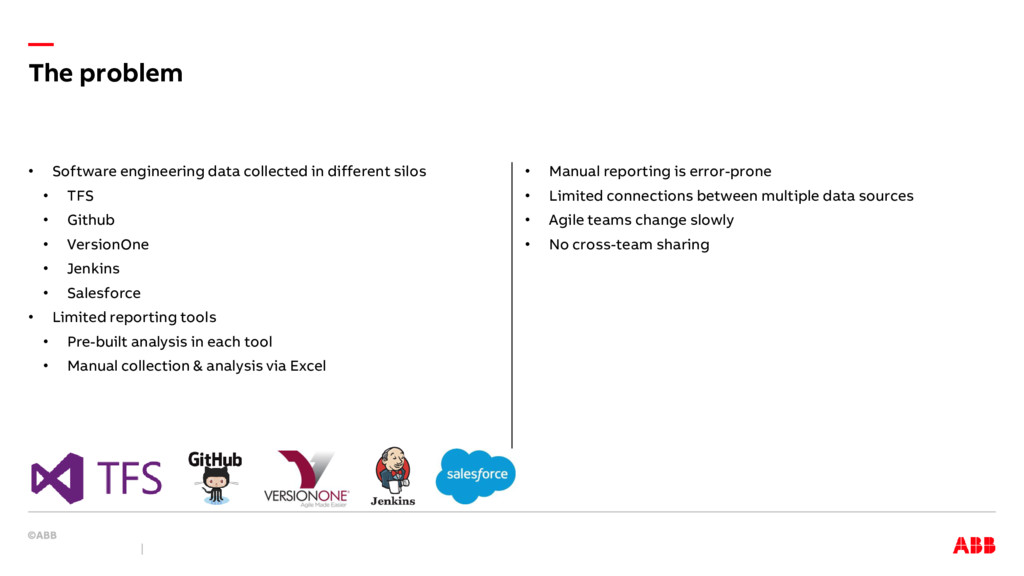
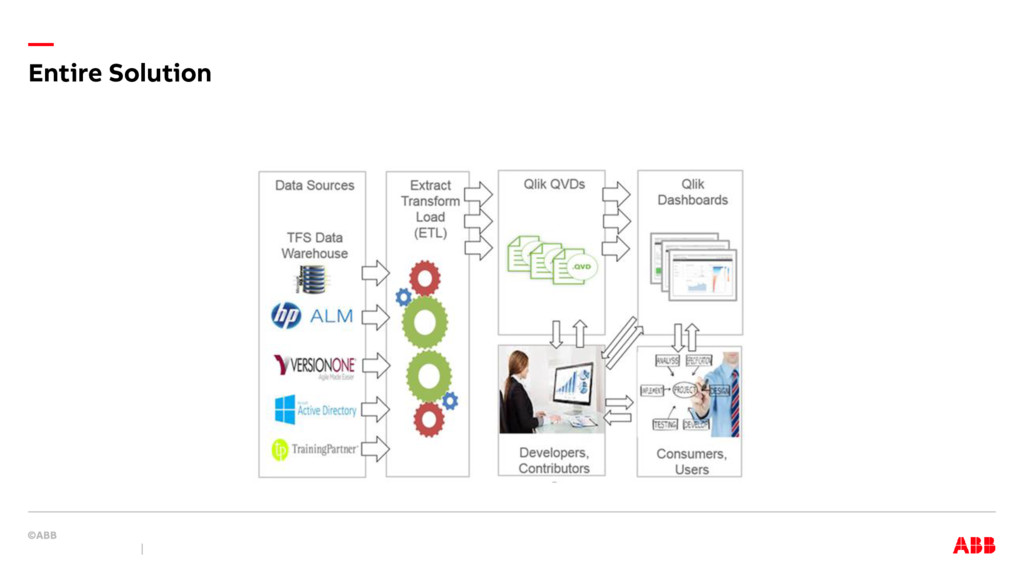
connections between multiple data sources • Agile teams change slowly • No cross-team sharing • Software engineering data collected in different silos • TFS • Github • VersionOne • Jenkins • Salesforce • Limited reporting tools • Pre-built analysis in each tool • Manual collection & analysis via Excel
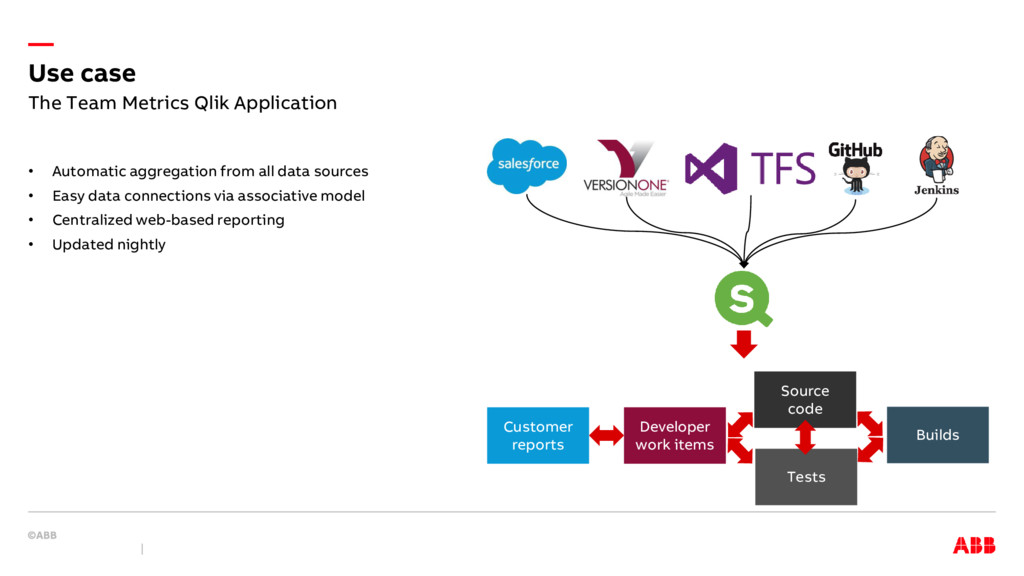
data connections via associative model • Centralized web-based reporting • Updated nightly Developer work items Use case The Team Metrics Qlik Application Customer reports Source code Tests Builds
the QSMP related to stakeholder interaction, infrastructure/process, design considerations, and project organization. We learned to engage business units with metric success stories. We followed an agile iterative development process with a two-week delivery cycle. We had part-time metric coordinators within the business units. We learned that we needed to dedicate servers for both development and production. We shortened refresh times by implementing automated incremental data loading. We track how much and when people in each business unit are using it. When designing dashboards, we incorporated features that provide • fast visualization rendering and filtering, • increase interactivity, • improve ease of navigation, • drill-down capability, • navigation buttons. Lessons Learned October 19, 2017 Slide 15