Upgrade to Pro — share decks privately, control downloads, hide ads and more …

Building a Manhole For Your App

Building a Manhole For Your App

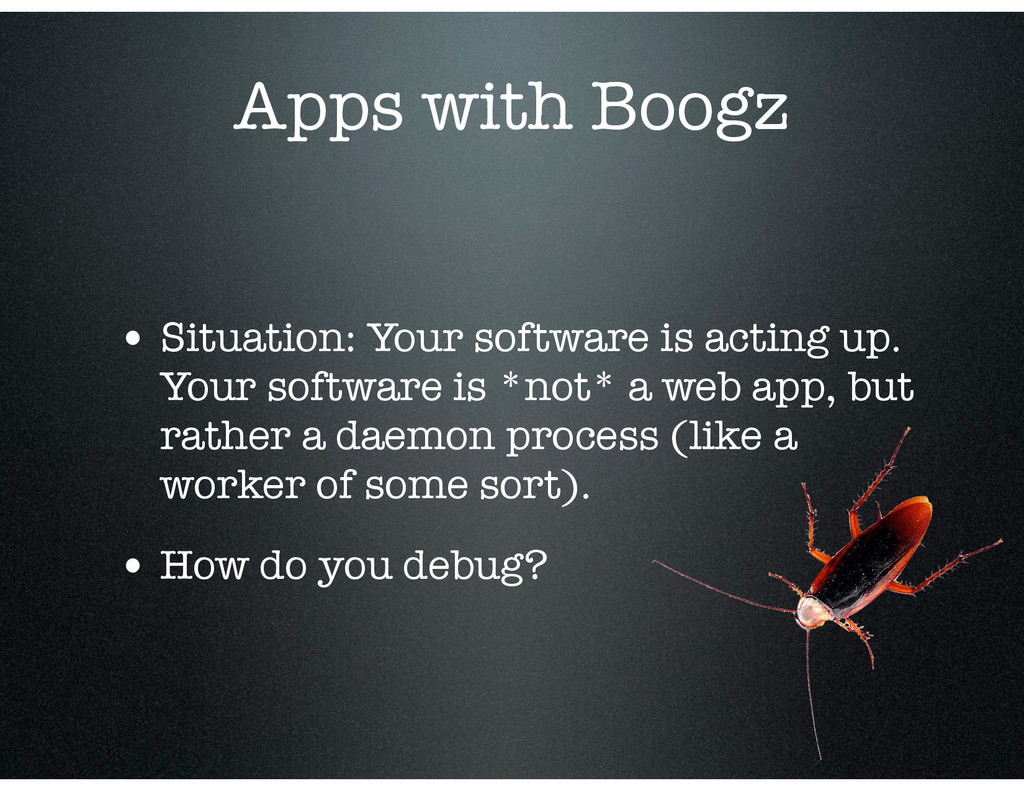
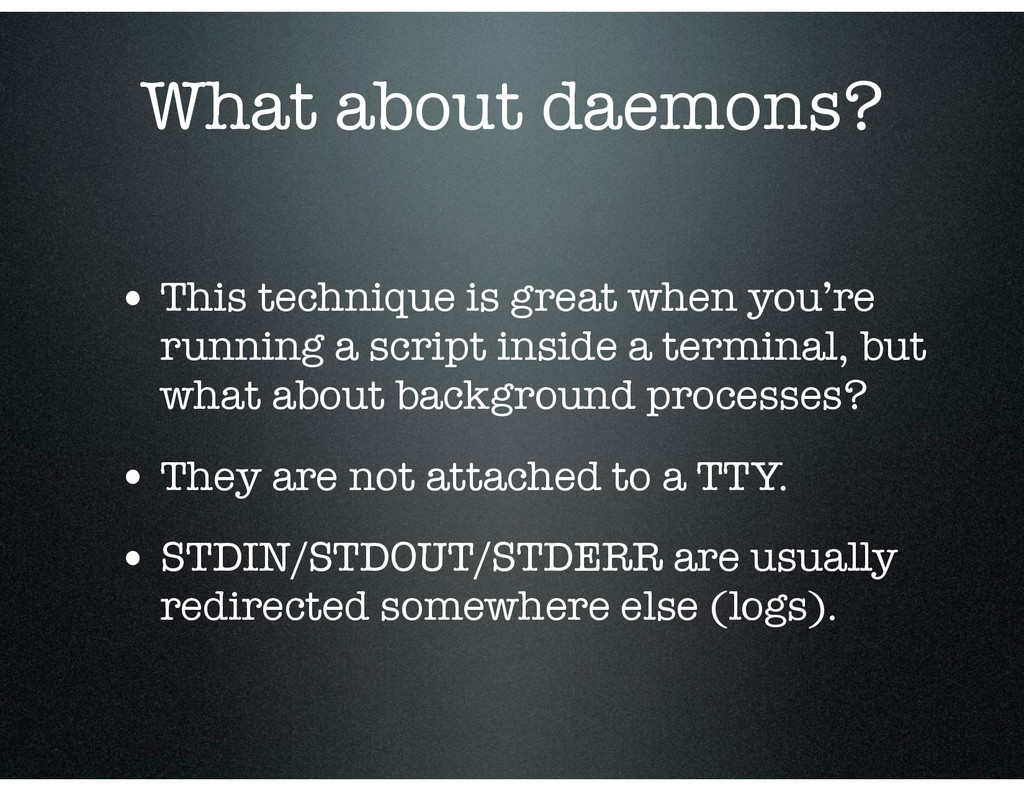
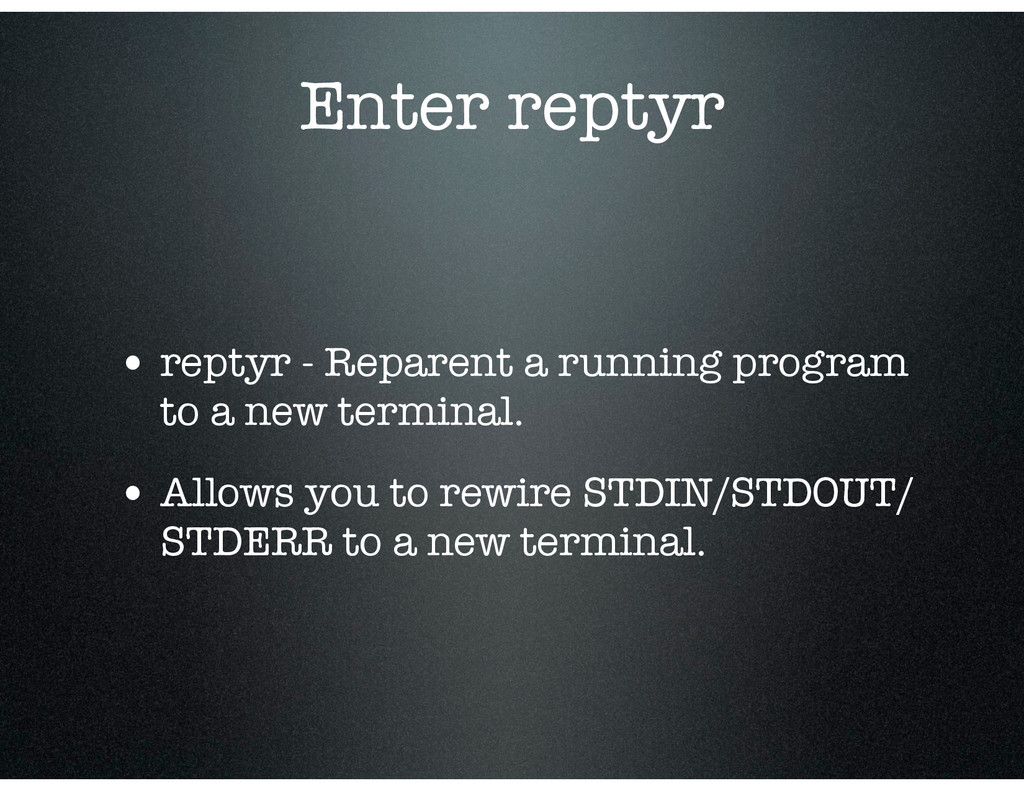
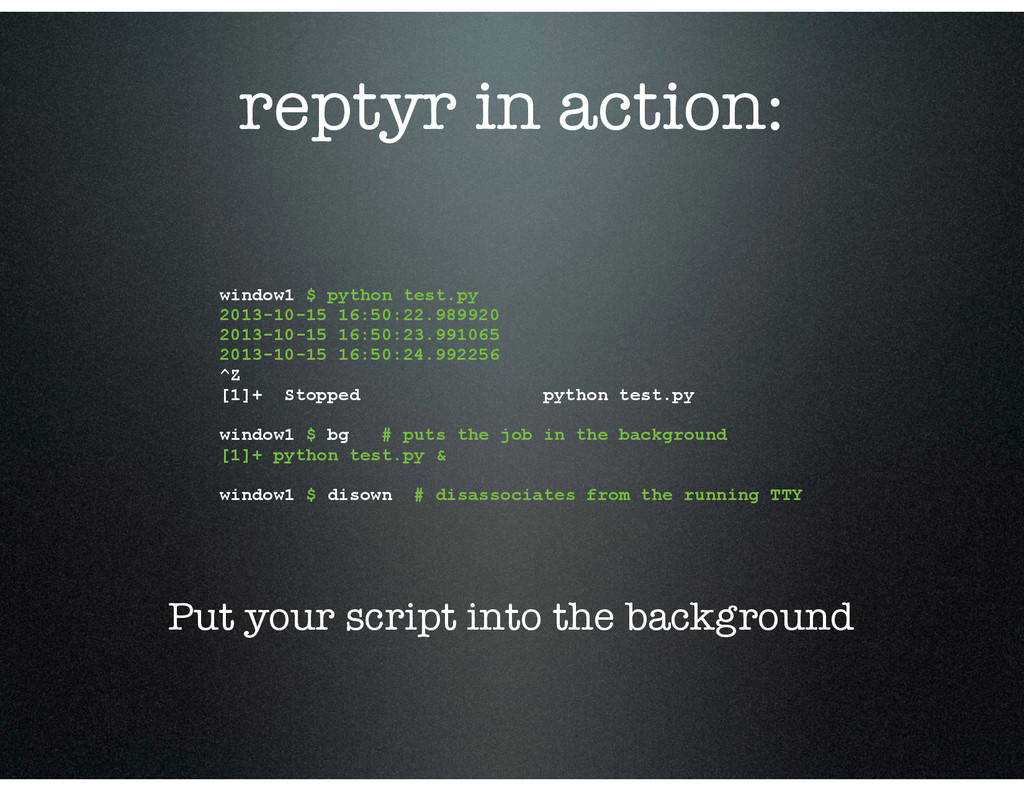
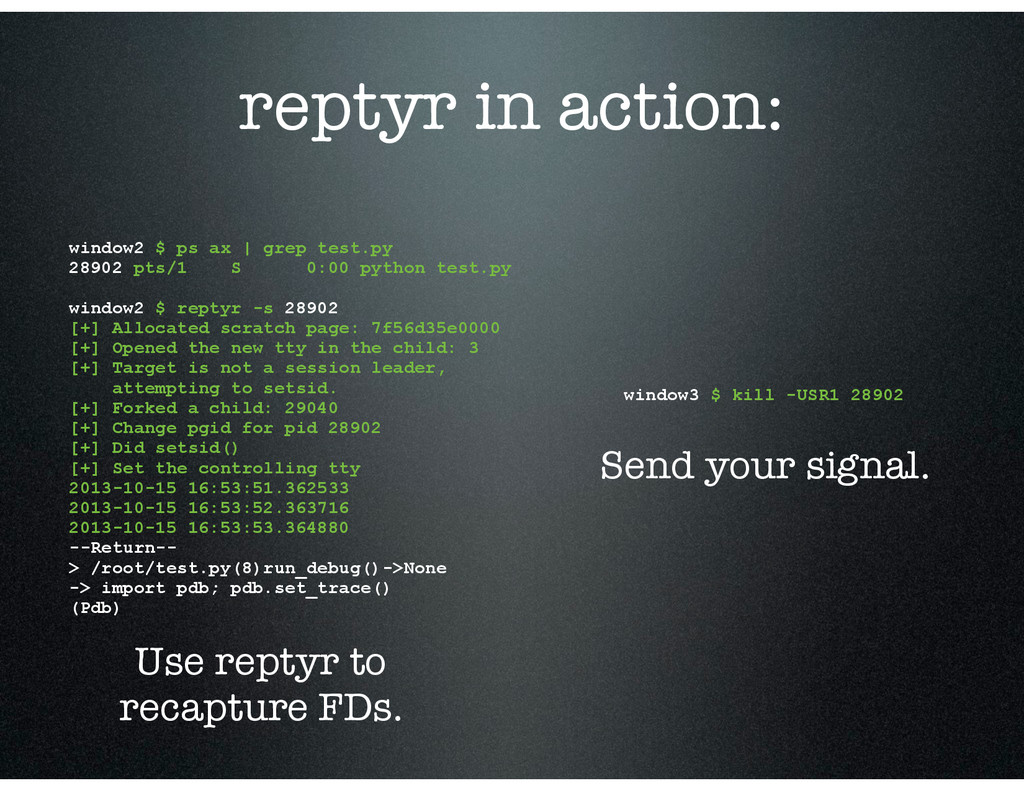
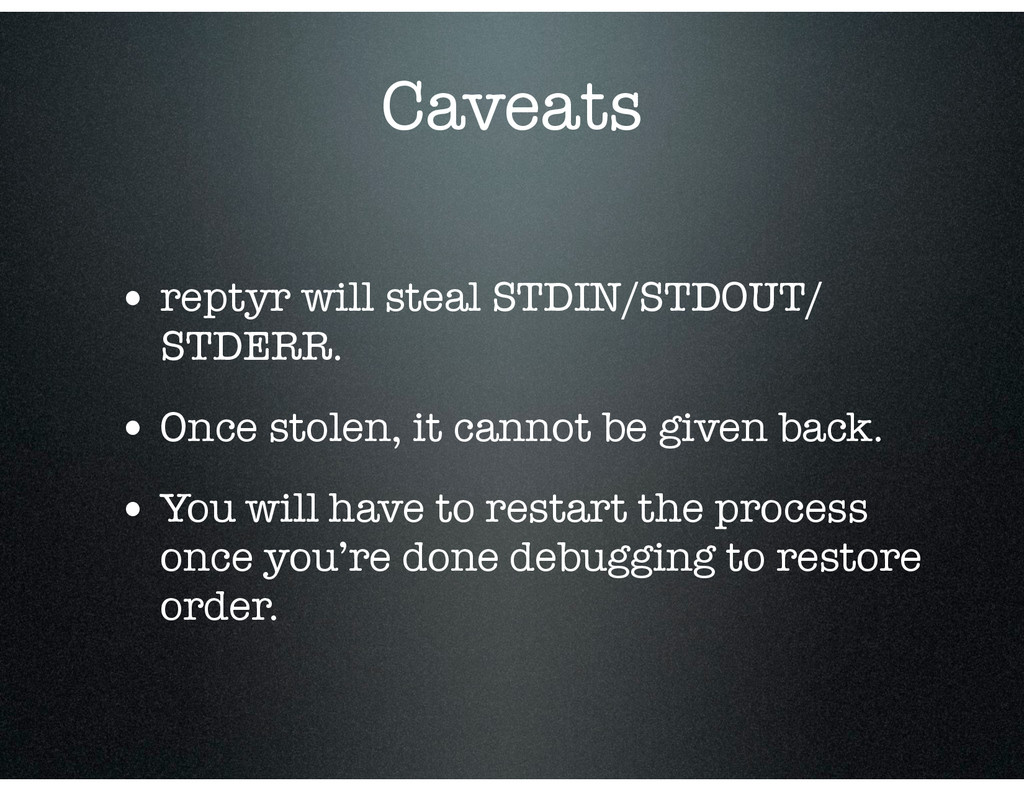
Situation: Your software is acting up. Your software is not a web app, but rather a daemon process (like a worker of some sort). How do you debug?

Hany Fahim, VM Farms Inc. Founder and CEO, gave this talk to the Django Toronto Meetup on October 16, 2014. It highlights some common tools used to debug a process while running.

VM Farms Inc.

October 16, 2013
Tweet

More Decks by VM Farms Inc.

Other Decks in Programming

Transcript

  1. Apps with Boogz • Situation: Your software is acting up.

    Your software is *not* a web app, but rather a daemon process (like a worker of some sort). • How do you debug?
  2. Tools • Standard “print” statements - there is nothing wrong

    with this. • pdb - very useful and powerful, requires you drop a set_trace(). • django-extensions/werkzeug - handy for web applications. • strace - introspect system calls. • Most of these tools require replicating the issues to debug.
  3. ... with signals! • Using standard Unix signals, one can

    communicate with a running process: $ cat test.py #!/usr/bin/python ! from time import sleep from datetime import datetime import signal ! def run_debug(signal, frame): import pdb; pdb.set_trace() ! ! if __name__ == '__main__': # attach our signal handler to SIGUSR1 signal.signal(signal.SIGUSR1, run_debug) while True: print datetime.now() sleep(1)
  4. In action: window1 $ python test.py 2013-10-15 16:33:59.697757 2013-10-15 16:34:00.698924

    2013-10-15 16:34:01.700167 2013-10-15 16:34:02.700923 2013-10-15 16:34:03.701884 2013-10-15 16:34:04.703049 2013-10-15 16:34:05.704226 2013-10-15 16:34:06.705380 2013-10-15 16:34:07.706541 2013-10-15 16:34:08.707743 2013-10-15 16:34:09.708956 2013-10-15 16:34:10.710099 2013-10-15 16:34:11.711319 2013-10-15 16:34:12.712514 2013-10-15 16:34:13.713713 --Return-- > /root/test.py(8)run_debug()->None -> import pdb; pdb.set_trace() window2 $ ps ax | grep test.py 28475 pts/1 S+ 0:00 python test.py window2 $ kill -USR1 28458 Sending USR1 to the process drops you in a PDB shell.
  5. What about daemons? • This technique is great when you’re

    running a script inside a terminal, but what about background processes? • They are not attached to a TTY. • STDIN/STDOUT/STDERR are usually redirected somewhere else (logs).
  6. Enter reptyr • reptyr - Reparent a running program to

    a new terminal. • Allows you to rewire STDIN/STDOUT/ STDERR to a new terminal.
  7. reptyr in action: window1 $ python test.py 2013-10-15 16:50:22.989920 2013-10-15

    16:50:23.991065 2013-10-15 16:50:24.992256 ^Z [1]+ Stopped python test.py ! window1 $ bg # puts the job in the background [1]+ python test.py & ! window1 $ disown # disassociates from the running TTY Put your script into the background
  8. reptyr in action: window2 $ ps ax | grep test.py

    28902 pts/1 S 0:00 python test.py ! window2 $ reptyr -s 28902 [+] Allocated scratch page: 7f56d35e0000 [+] Opened the new tty in the child: 3 [+] Target is not a session leader, attempting to setsid. [+] Forked a child: 29040 [+] Change pgid for pid 28902 [+] Did setsid() [+] Set the controlling tty 2013-10-15 16:53:51.362533 2013-10-15 16:53:52.363716 2013-10-15 16:53:53.364880 --Return-- > /root/test.py(8)run_debug()->None -> import pdb; pdb.set_trace() (Pdb) window3 $ kill -USR1 28902 Use reptyr to recapture FDs. Send your signal.
  9. Caveats • reptyr will steal STDIN/STDOUT/ STDERR. • Once stolen,

    it cannot be given back. • You will have to restart the process once you’re done debugging to restore order.