Upgrade to Pro — share decks privately, control downloads, hide ads and more …

Tales from the Ops Side - Dr. Strangecron

Tales from the Ops Side - Dr. Strangecron

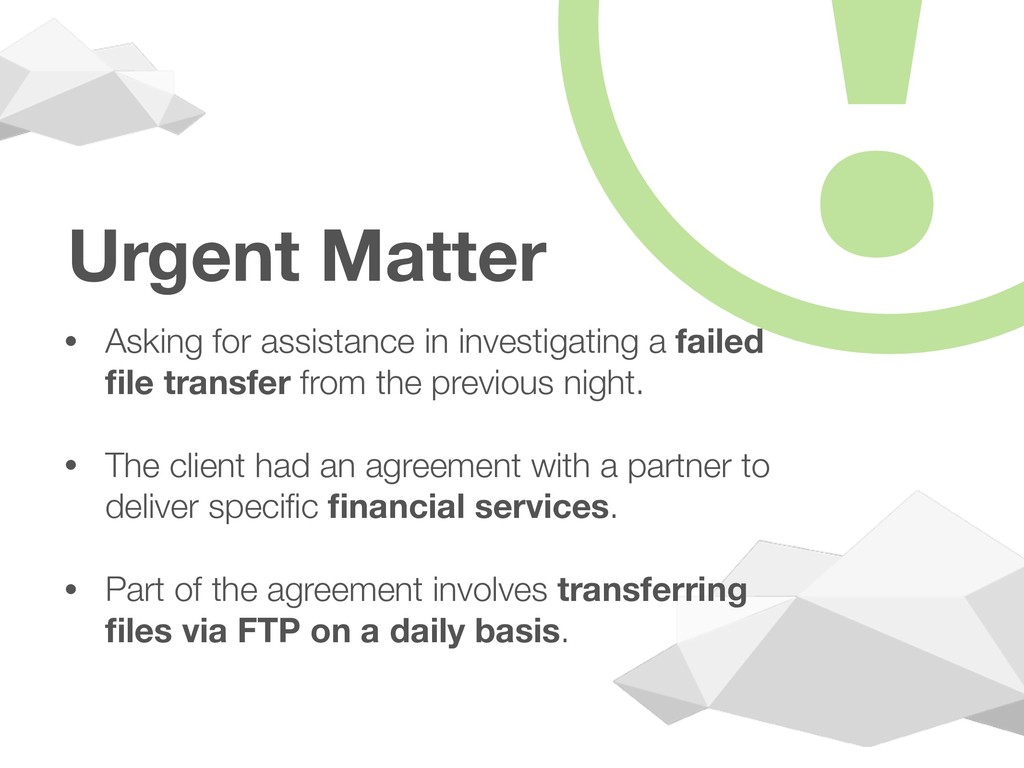
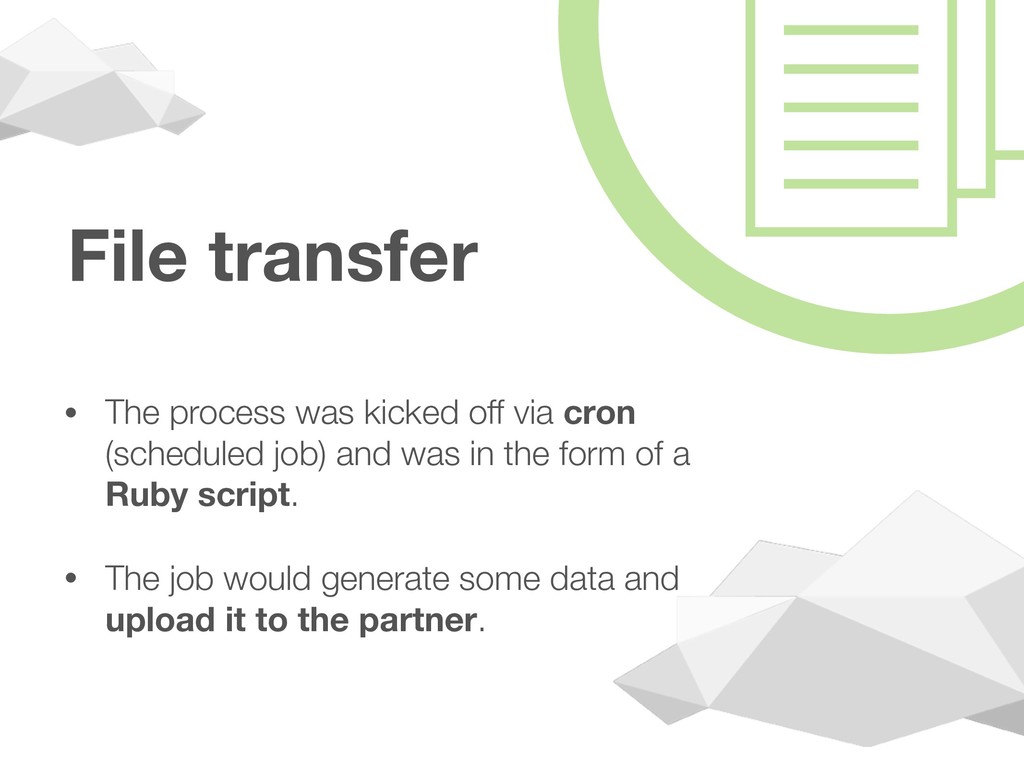
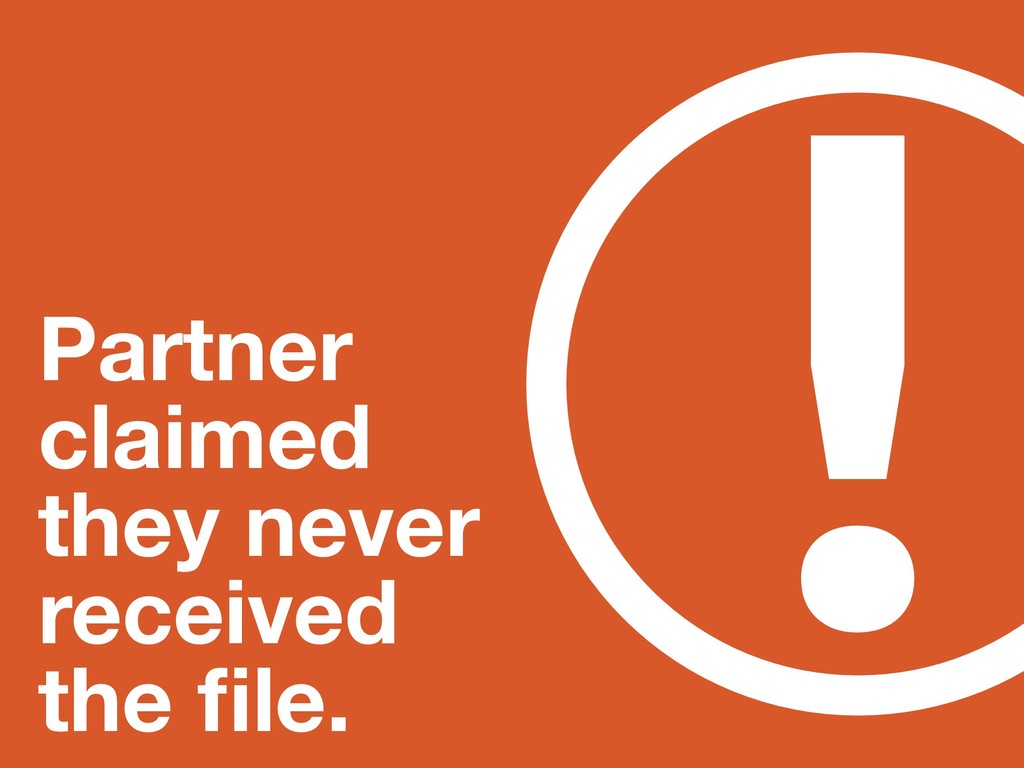
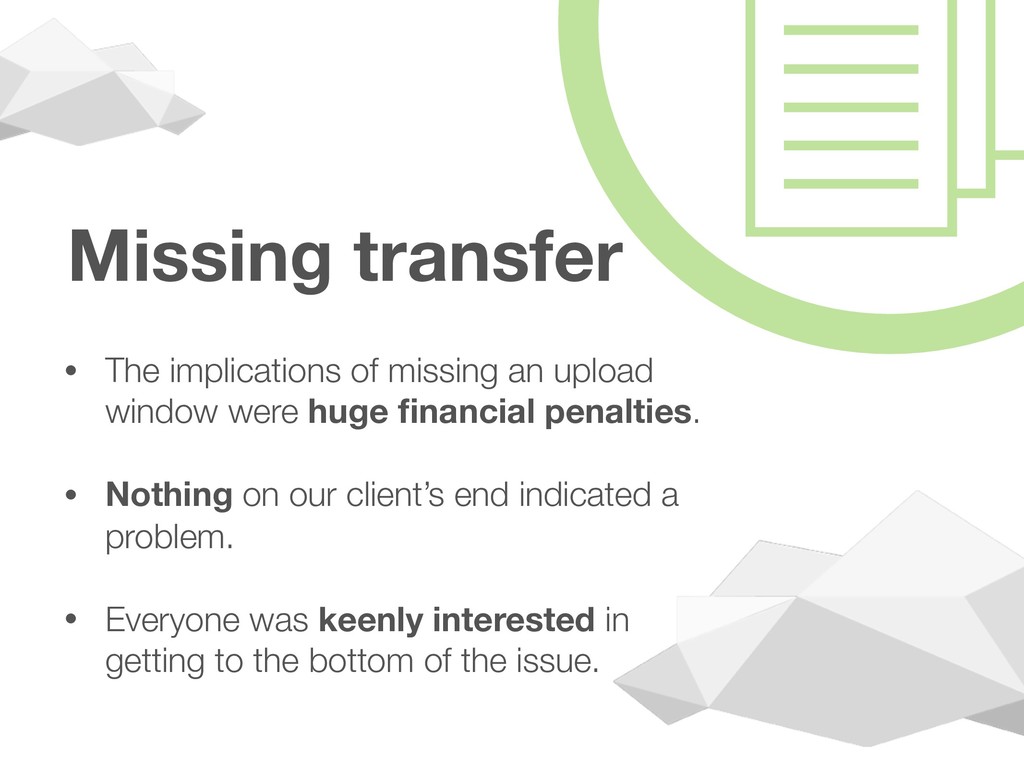
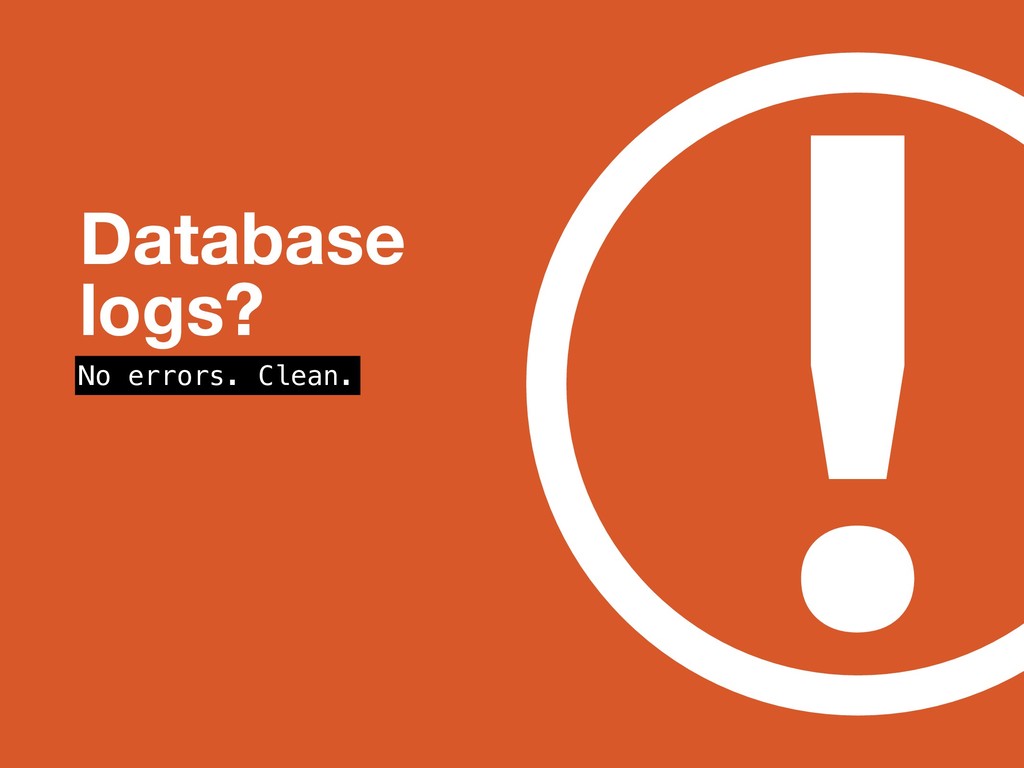
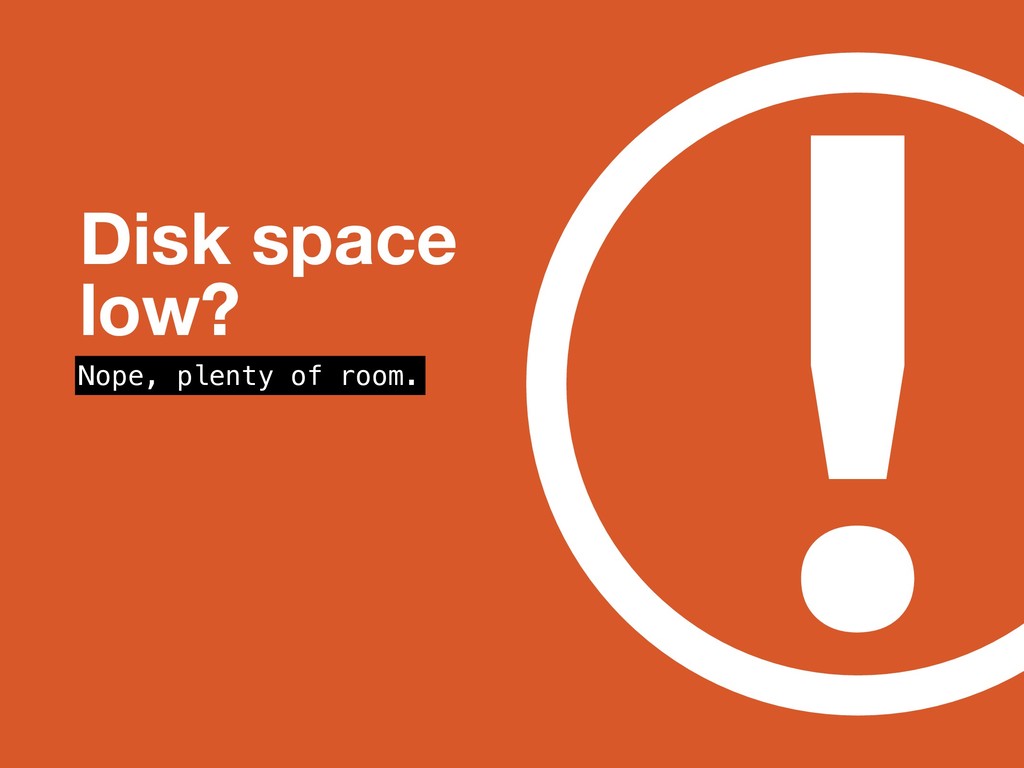
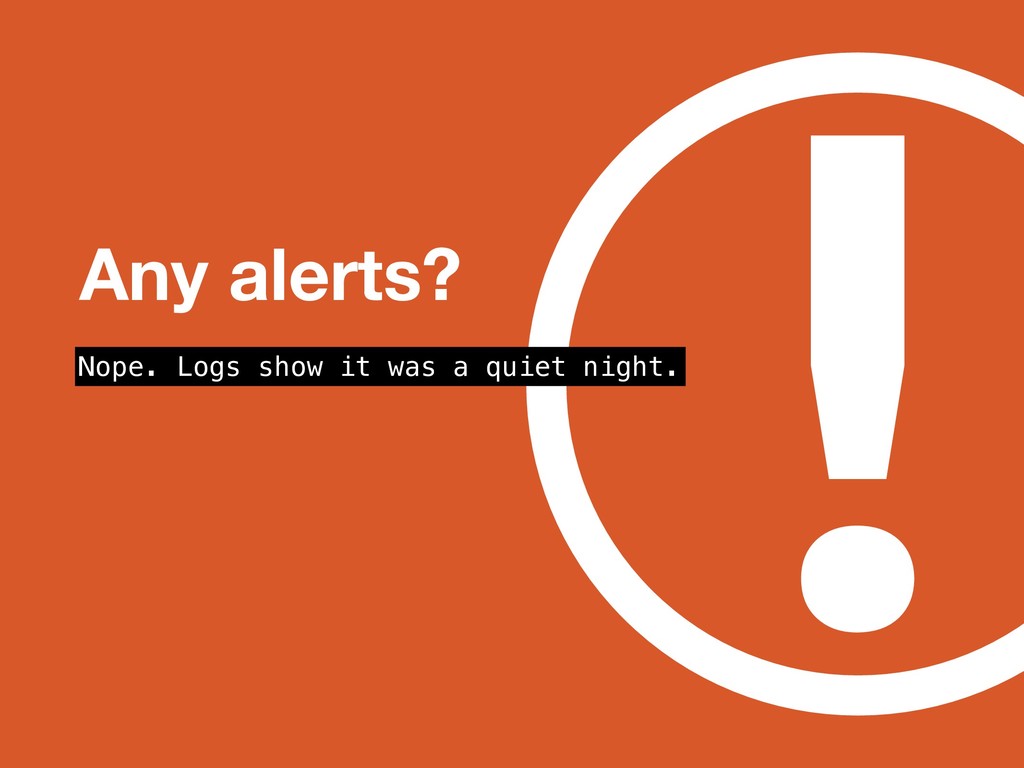
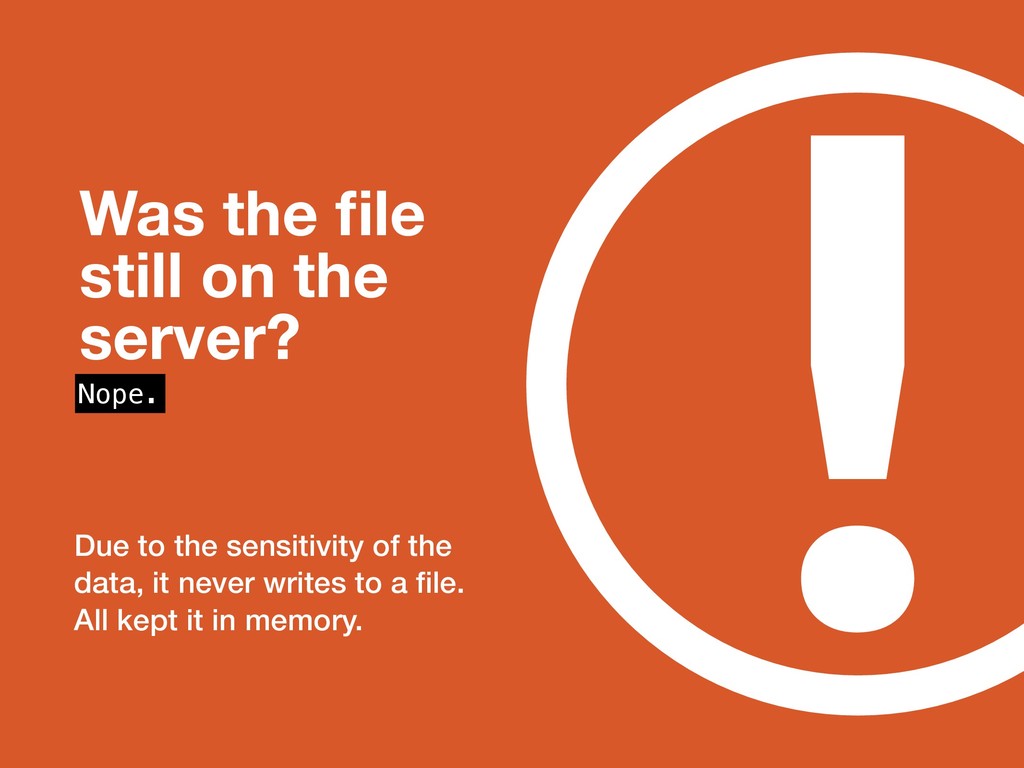
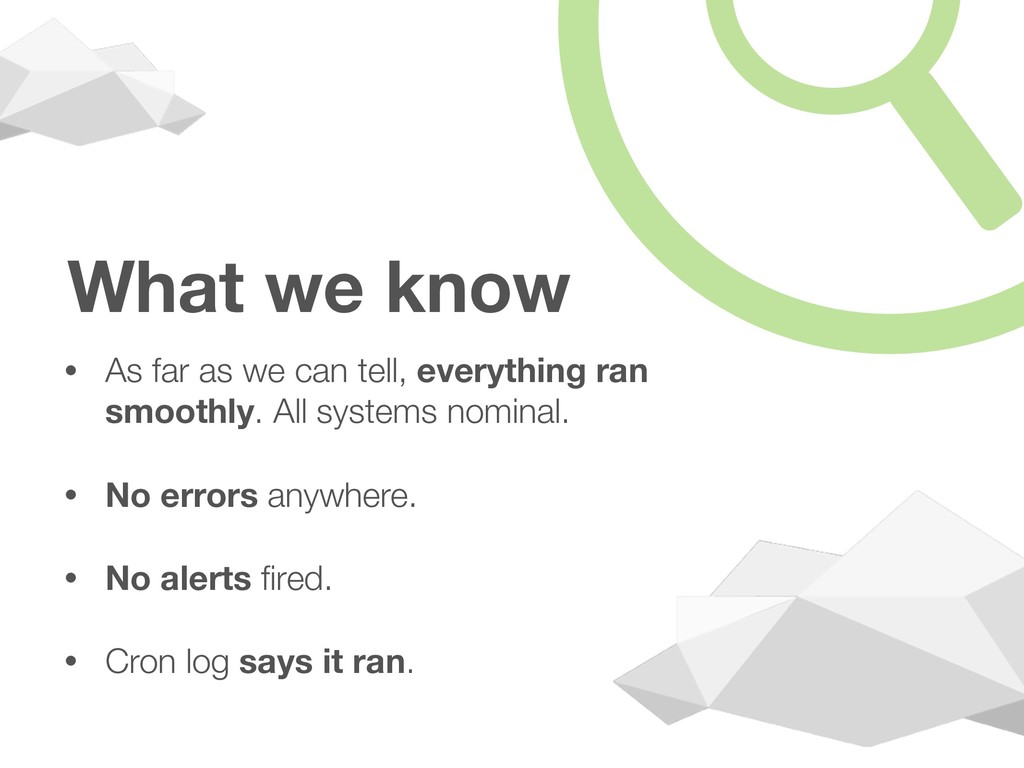
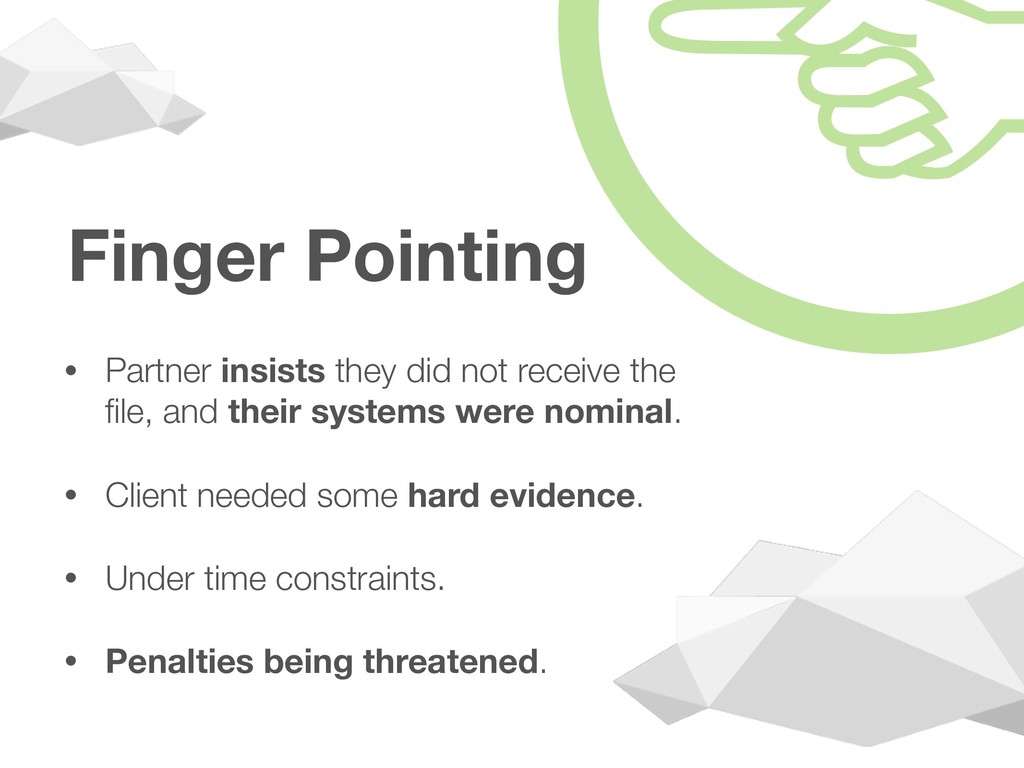
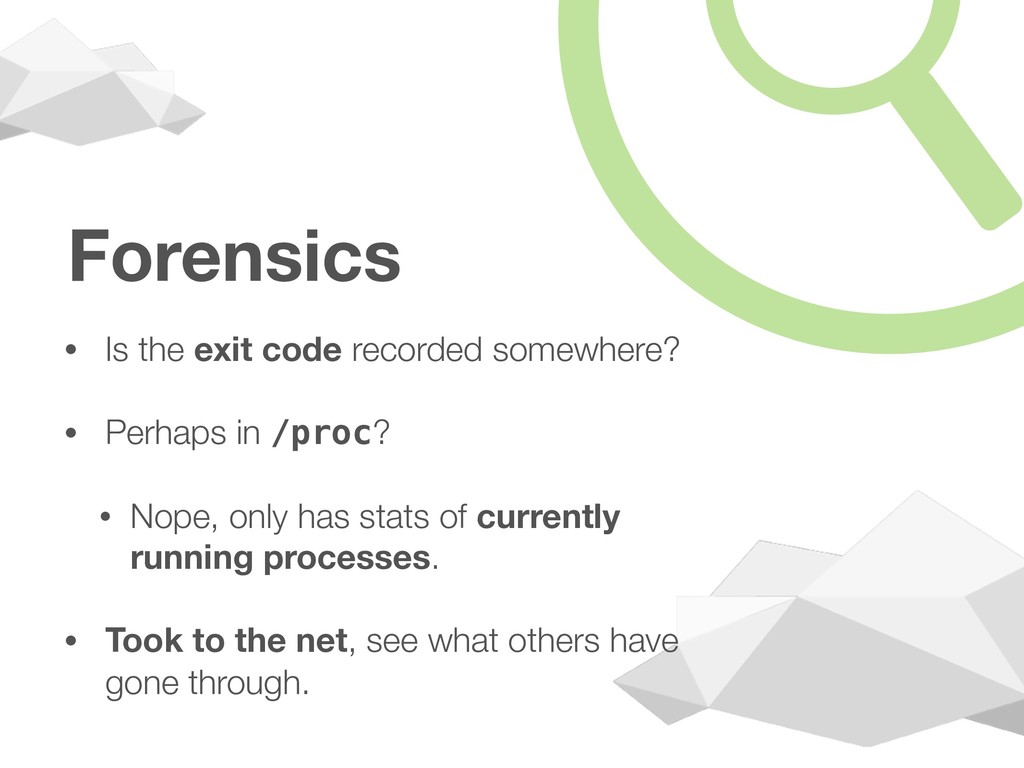
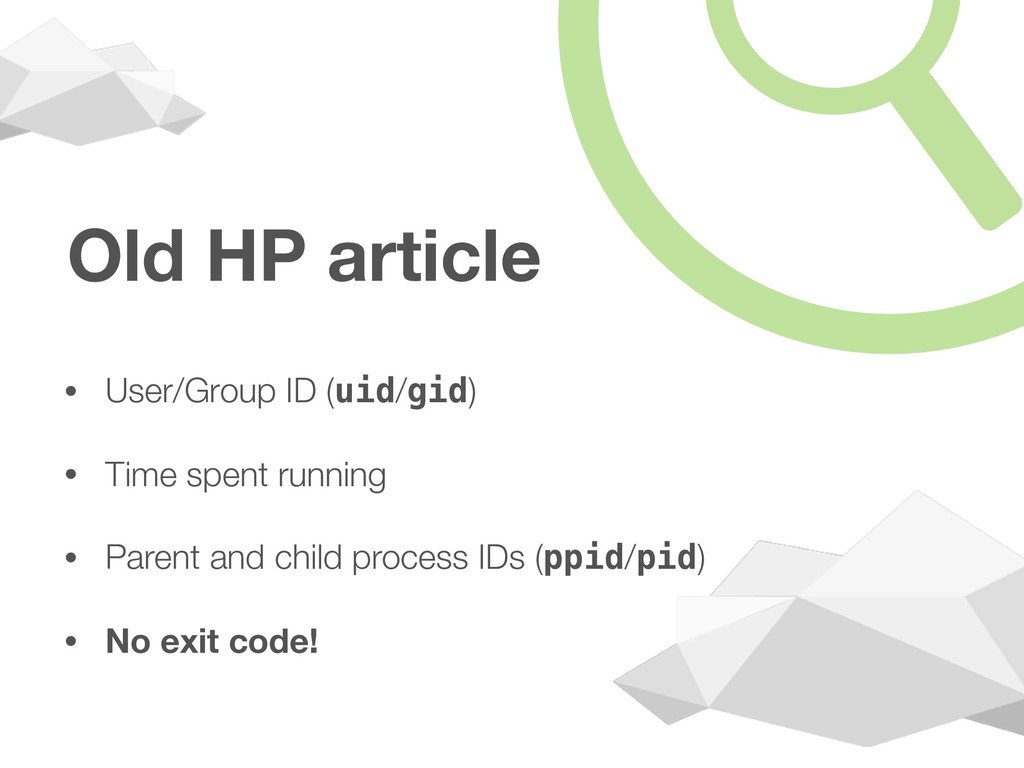
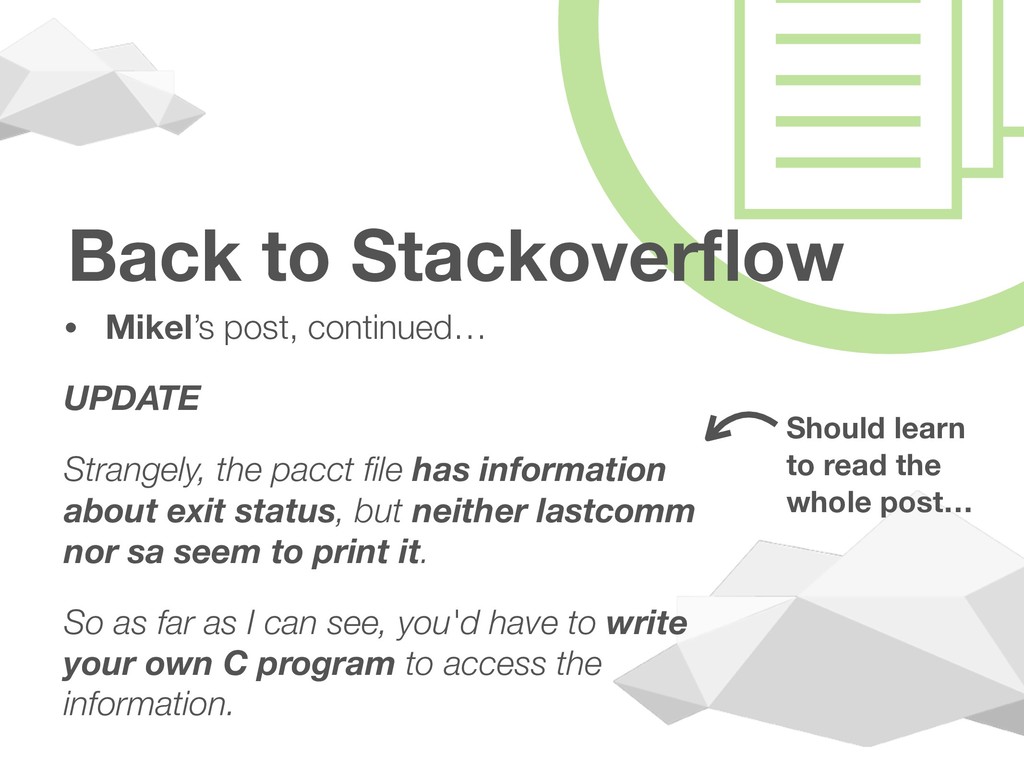
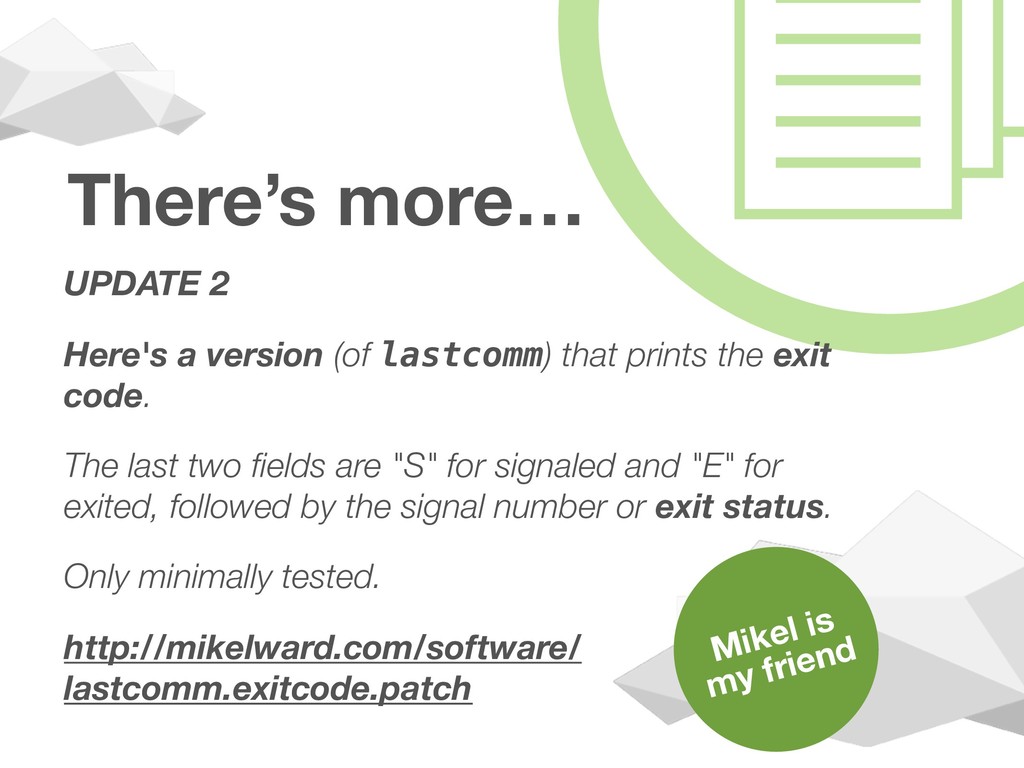
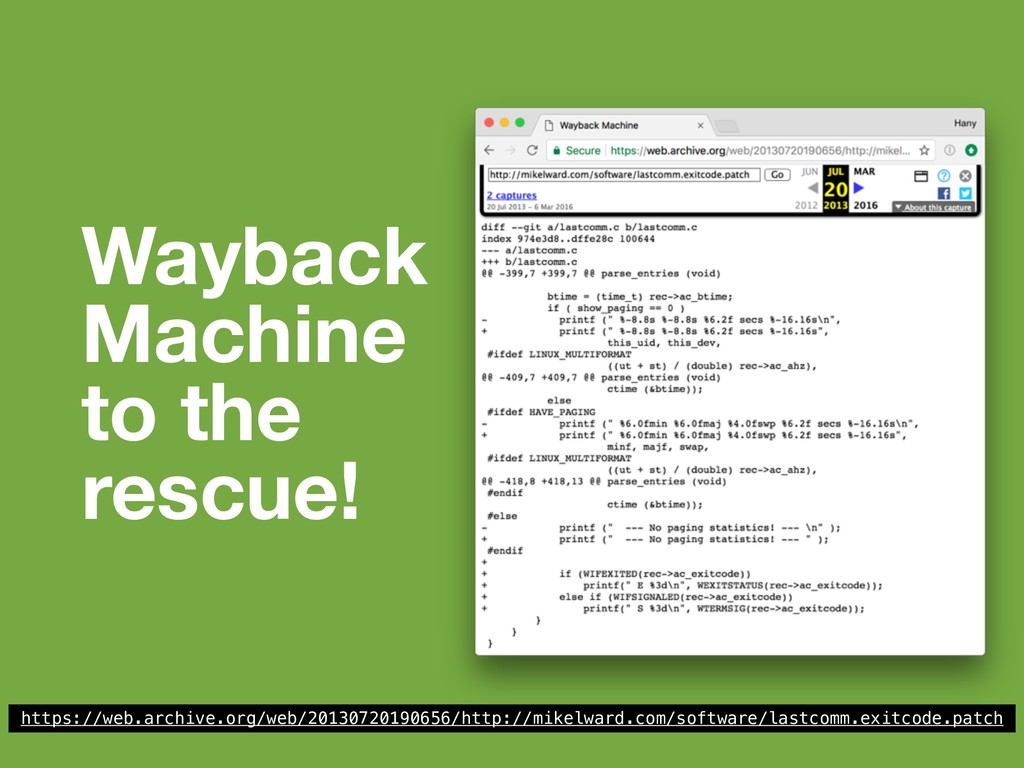
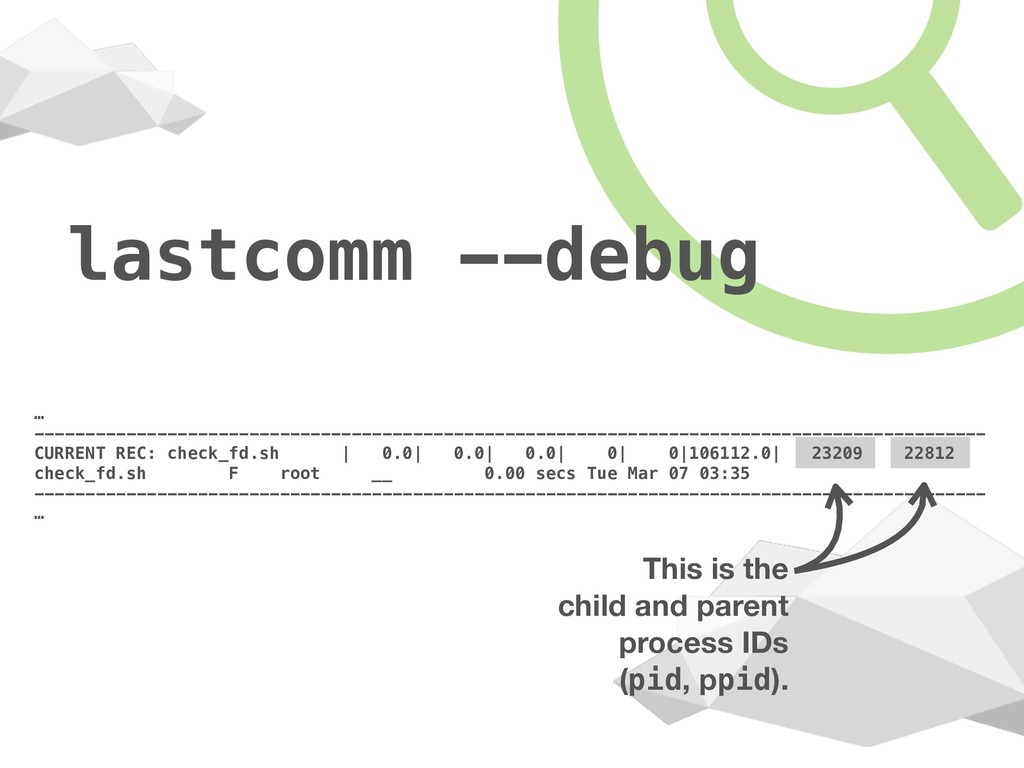
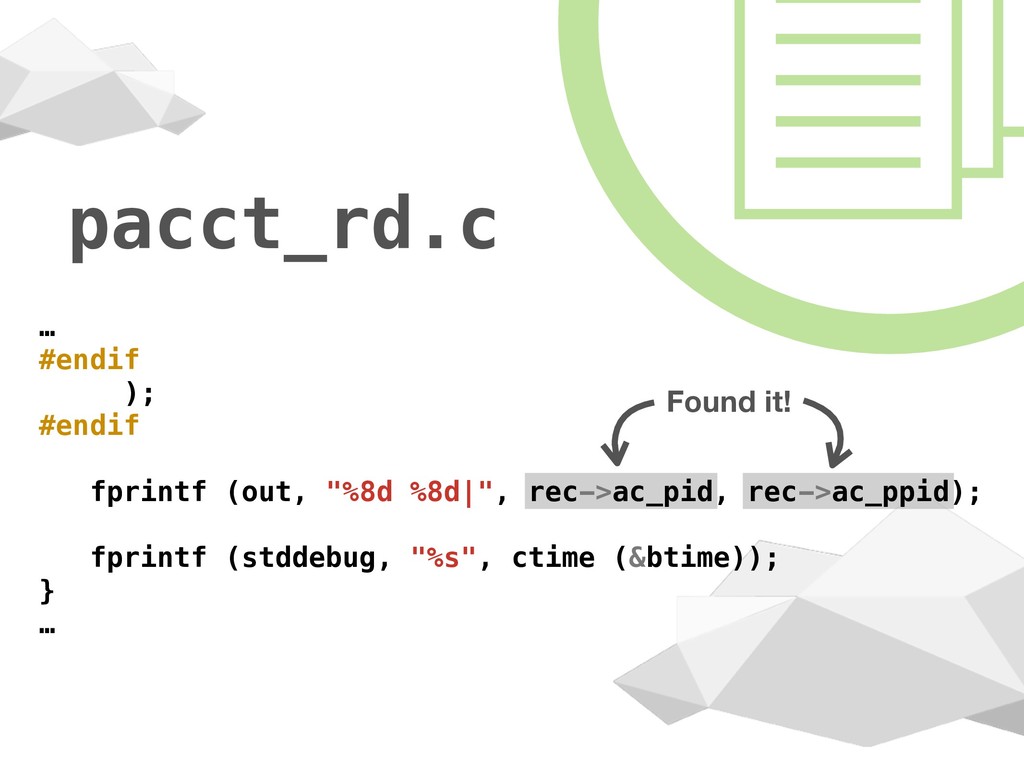
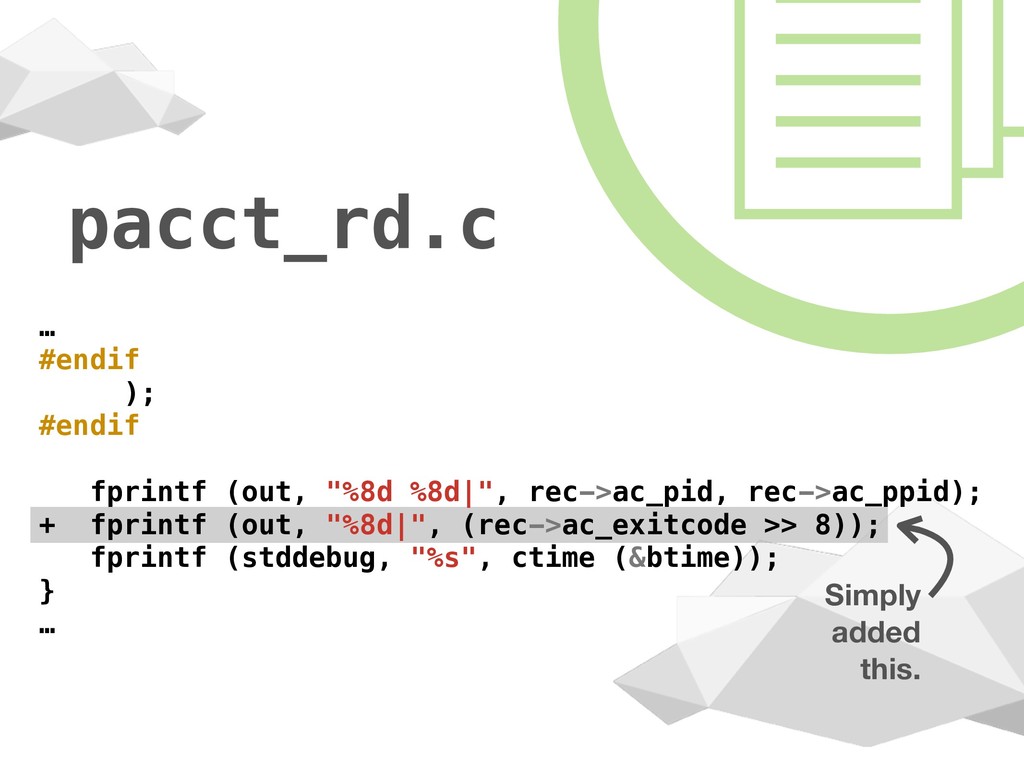
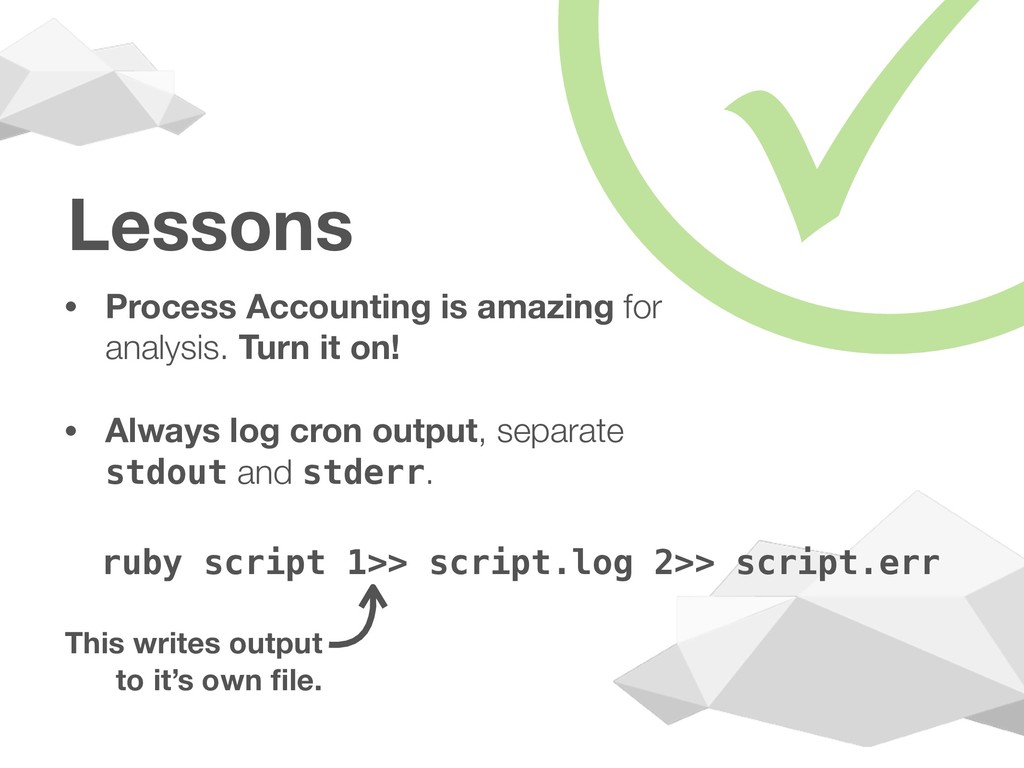
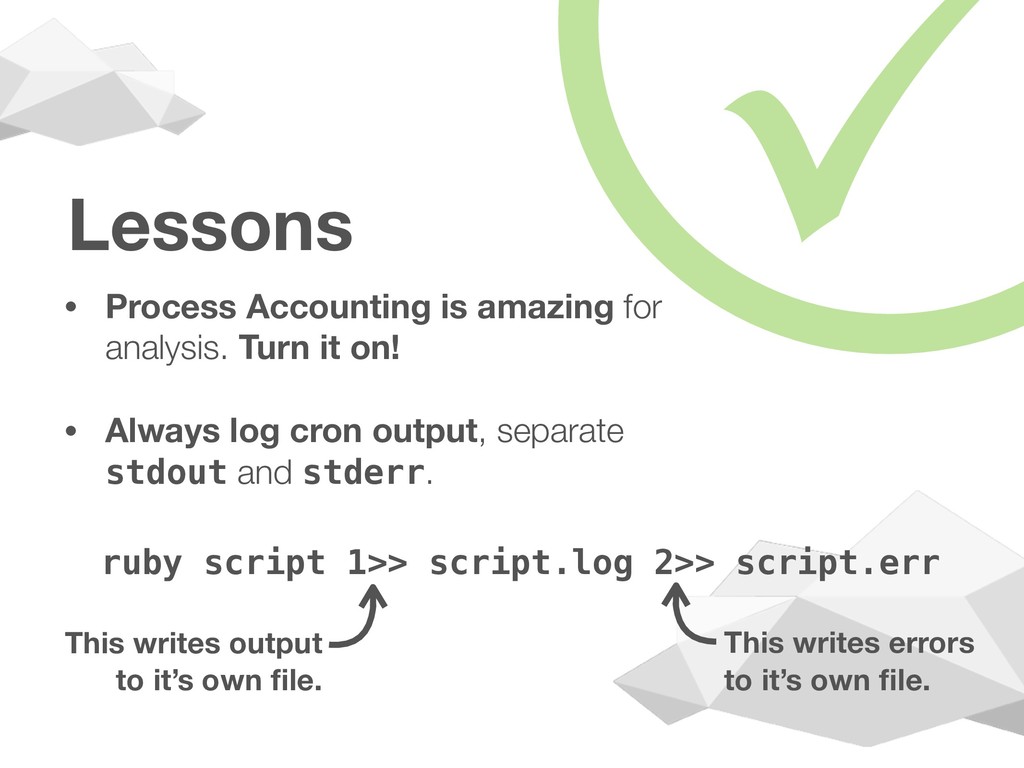
Back in 2016, one of our customers had a problem. Part of their business involved uploading some mission critical files to a 3rd party every night. One particular night, this 3rd party claimed they never received the files, but everything suggested they did. Finger pointing ensued, penalties threatened. Continuing our Tales from the Ops side series, this is the story of a taxing deep dive to uncover the truth.

VM Farms Inc.

November 27, 2017
Tweet

More Decks by VM Farms Inc.

Other Decks in Technology

Transcript

  1. Hany Fahim Founder & CEO @iHandroid Dr. Strangecron
 or: How

    I Learned to Stop Worrying
 and Love the lastcomm Tales From The Ops Side
  2. Urgent Matter • Asking for assistance in investigating a failed

    file transfer from the previous night. • The client had an agreement with a partner to deliver specific financial services. • Part of the agreement involves transferring files via FTP on a daily basis. !
  3. File transfer • The process was kicked off via cron

    (scheduled job) and was in the form of a Ruby script. • The job would generate some data and upload it to the partner. !
  4. Missing transfer • The implications of missing an upload window

    were huge financial penalties. • Nothing on our client’s end indicated a problem. • Everyone was keenly interested in getting to the bottom of the issue. !
  5. ? System logs? Cron logs showed the job fired. However,

    it does not show status. Only that it fired. At least we knew this.
  6. Searching for evidence • Perhaps network logs or graphs? •

    Data size was very small, so it would barely register on network graphs. • Contacted upstream, perhaps their firewalls recorded something? • Nope.
  7. Digging deeper • What exactly did this script do? •

    Very simple: connected to the database and grabbed some data, • Assembled the data in a specific format. • Connects via FTP and uploads.
  8. ! Was the file still on the server? Nope. Due

    to the sensitivity of the data, it never writes to a file. All kept it in memory.
  9. What we know • As far as we can tell,

    everything ran smoothly. All systems nominal. • No errors anywhere. • No alerts fired. • Cron log says it ran.
  10. Finger Pointing • Partner insists they did not receive the

    file, and their systems were nominal. • Client needed some hard evidence. • Under time constraints. • Penalties being threatened. "
  11. Forensics • Is the exit code recorded somewhere? • Perhaps

    in /proc? • Nope, only has stats of currently running processes. • Took to the net, see what others have gone through.
  12. Stackoverflow post • From 2011 • Q: Is there some

    way I can check which of my processes the kernel has killed? !
  13. Stackoverflow post • From 2011 • Q: Is there some

    way I can check which of my processes the kernel has killed? • A: Process Accounting could help here. - Mikel Ward ! Soon to be best friend.
  14. Process Accounting Process accounting is the method of recording and

    summarizing commands executed on Linux. The modern Linux kernel is capable of keeping process accounting records for the commands being run, the user who executed the command, the CPU time, and much more. ! Very interested in the “much more”.
  15. Yes we can. • We actually had process accounting enabled!

    • We installed it everywhere over 3 years ago in order to monitor deploys. • And yes, it was installed on this customer’s system! !
  16. Did we have the file? Yes we did! # ls

    -la pacct-20170307.gz -rw------- 1 root root 3454527 Mar 07 03:06 pacct-20170307.gz I <3 you psacct !
  17. psacct • Process Accounting comes with several tools to parse

    its main file. • Includes commands like: • sa - summarizes information about previously executed commands.
  18. psacct • Process Accounting comes with several tools to parse

    its main file. • Includes commands like: • sa - summarizes information about previously executed commands. • lastcomm - prints out information about previously executed commands. This looks like what we want.
  19. lastcomm …
 check_fd.sh F root __ 0.00 secs Tue Mar

    07 03:35 awk root __ 0.00 secs Tue Mar 07 03:35 grep root __ 0.00 secs Tue Mar 07 03:35 check_fd.sh F root __ 0.00 secs Tue Mar 07 03:35 dirname root __ 0.00 secs Tue Mar 07 03:35 wc root __ 0.00 secs Tue Mar 07 03:35 … It’s very verbose. And no exit code!
  20. lastcomm -h # lastcomm -h Usage: lastcomm [-hV] [-f file]

    [command] ... [user] ... [terminal] ... [--file <file>] [--strict-match] [--print-controls] [--pid] [--user <name>] [--tty <name>] [--command <name>] [--debug] [--version] [--help] This may help us.
  21. lastcomm --debug … -------------------------------------------------------------------------------------------- CURRENT REC: check_fd.sh | 0.0| 0.0|

    0.0| 0| 0|106112.0| 23209 22812 check_fd.sh F root __ 0.00 secs Tue Mar 07 03:35 -------------------------------------------------------------------------------------------- CURRENT REC: awk | 0.0| 0.0| 0.0| 0| 0|105984.0| 23212 23209 awk root __ 0.00 secs Tue Mar 07 03:35 -------------------------------------------------------------------------------------------- CURRENT REC: grep | 0.0| 0.0| 0.0| 0| 0|103296.0| 23211 23209 grep root __ 0.00 secs Tue Mar 07 03:35 -------------------------------------------------------------------------------------------- CURRENT REC: check_fd.sh | 0.0| 0.0| 0.0| 0| 0|106112.0| 23205 22812 check_fd.sh F root __ 0.00 secs Tue Mar 07 03:35 -------------------------------------------------------------------------------------------- CURRENT REC: dirname | 0.0| 0.0| 0.0| 0| 0|100928.0| 23208 23190 dirname root __ 0.00 secs Tue Mar 07 03:35 -------------------------------------------------------------------------------------------- … What does all this mean?
  22. $ man lastcomm Most helpful man page entry ever. --debug

    Print verbose internal information.
  23. Old HP article • User/Group ID (uid/gid) • Time spent

    running • Parent and child process IDs (ppid/pid) • No exit code!
  24. ! Back to Stackoverflow • Mikel’s post, continued… UPDATE Strangely,

    the pacct file has information about exit status, but neither lastcomm nor sa seem to print it. So as far as I can see, you'd have to write your own C program to access the information. Should learn to read the whole post…
  25. There’s more… UPDATE 2 Here's a version (of lastcomm) that

    prints the exit code. The last two fields are "S" for signaled and "E" for exited, followed by the signal number or exit status. Only minimally tested. http://mikelward.com/software/ lastcomm.exitcode.patch ! Mikel is my friend
  26. What are the chances a 6 yr old patch will

    “Just Work?” $ patch < lastcomm.exitcode.patch
  27. " Debian Patch • Turns out, this patch was made

    for a 6 yr old version of Debian. • We’re running Red Hat. • Not even close to being compatible. • But, at least we know what he was doing!
  28. Closer look… + if (WIFEXITED(rec->ac_exitcode)) + printf(" E %3d\n", WEXITSTATUS(rec->ac_exitcode));

    + else if (WIFSIGNALED(rec->ac_exitcode)) + printf(" S %3d\n", WTERMSIG(rec->ac_exitcode)); He’s just printing the exit code!
  29. /usr/include/sys/acct.h … struct acct_v3 { char ac_flag; /* Flags */

    char ac_version; /* Always set to ACCT_VERSION */ u_int16_t ac_tty; /* Control Terminal */ u_int32_t ac_exitcode; /* Exitcode */ … That’s what we’re looking for!
  30. lastcomm --debug … --------------------------------------------------------------------------------------------- CURRENT REC: check_fd.sh | 0.0| 0.0|

    0.0| 0| 0|106112.0| 23209 22812 check_fd.sh F root __ 0.00 secs Tue Mar 07 03:35 --------------------------------------------------------------------------------------------- … This is the child and parent process IDs (pid, ppid).
  31. pacct_rd.c … #endif ); #endif fprintf (out, "%8d %8d|", rec->ac_pid,

    rec->ac_ppid); fprintf (stddebug, "%s", ctime (&btime)); } … Found it! !
  32. pacct_rd.c … #endif ); #endif fprintf (out, "%8d %8d|", rec->ac_pid,

    rec->ac_ppid); + fprintf (out, "%8d|", (rec->ac_exitcode >> 8)); fprintf (stddebug, "%s", ctime (&btime)); } … Simply added this. !
  33. Package it up! • Created a patch file. • Downloaded

    the source RPM. • Modified it to add our patch. !
  34. Moment of truth… $ rpmbuild -ba psacct.spec … Wrote: psacct-6.3.2-70.vmf.el6.x86_64.rpm

    Success! Time to test! $ lastcomm -f /var/account/pacct-20170307 … Result?
  35. Result! --------------------------------------------------------------------------- CURRENT REC: bash | 12.0| 7.0|66098.0| 500| 501|108992.0|

    6404 6402| 1| bash deploy __ 0.19 secs Tue Mar 07 06:00 --------------------------------------------------------------------------- CURRENT REC: ruby |26416.0|2223.0|66053.0| 500| 501|1107968.0| 6596 6404| 1| ruby deploy __ 286.39 secs Tue Mar 07 06:00 --------------------------------------------------------------------------- Our glorious exit code! Exit Code of 1 means an error occurred!
  36. More interesting info --------------------------------------------------------------------------- CURRENT REC: bash | 12.0| 7.0|66098.0|

    500| 501|108992.0| 6404 6402| 1| bash deploy __ 0.19 secs Tue Mar 07 06:00 --------------------------------------------------------------------------- CURRENT REC: ruby |26416.0|2223.0|66053.0| 500| 501|1107968.0| 6596 6404| 1| ruby deploy __ 286.39 secs Tue Mar 07 06:00 --------------------------------------------------------------------------- This is the execution time.
  37. More interesting info --------------------------------------------------------------------------- CURRENT REC: bash | 12.0| 7.0|66098.0|

    500| 501|108992.0| 6404 6402| 1| bash deploy __ 0.19 secs Tue Mar 07 06:00 --------------------------------------------------------------------------- CURRENT REC: ruby |26416.0|2223.0|66053.0| 500| 501|1107968.0| 6596 6404| 1| ruby deploy __ 286.39 secs Tue Mar 07 06:00 --------------------------------------------------------------------------- This is the execution time. This is the processing time.
  38. Long Run Time? • Script ran for 660s (66,098 centiseconds)

    or just over 11 minutes. • However “CPU time” was < 5 min (286s). • Is this normal?
  39. Previous Night --------------------------------------------------------------------------- CURRENT REC: bash | 14.0| 6.0|4847.0| 500|

    501|108992.0| 28332 28329| 0| bash deploy __ 0.20 secs Mon Mar 06 06:00 --------------------------------------------------------------------------- CURRENT REC: ruby |2369.0| 749.0|4800.0| 500| 501|658432.0| 28532 28332| 0| ruby deploy __ 31.18 secs Mon Mar 06 06:00 --------------------------------------------------------------------------- Much shorter execution time.
  40. Previous Night --------------------------------------------------------------------------- CURRENT REC: bash | 14.0| 6.0|4847.0| 500|

    501|108992.0| 28332 28329| 0| bash deploy __ 0.20 secs Mon Mar 06 06:00 --------------------------------------------------------------------------- CURRENT REC: ruby |2369.0| 749.0|4800.0| 500| 501|658432.0| 28532 28332| 0| ruby deploy __ 31.18 secs Mon Mar 06 06:00 --------------------------------------------------------------------------- Much shorter execution time. Shorter processing time too!
  41. Previous Night --------------------------------------------------------------------------- CURRENT REC: bash | 14.0| 6.0|4847.0| 500|

    501|108992.0| 28332 28329| 0| bash deploy __ 0.20 secs Mon Mar 06 06:00 --------------------------------------------------------------------------- CURRENT REC: ruby |2369.0| 749.0|4800.0| 500| 501|658432.0| 28532 28332| 0| ruby deploy __ 31.18 secs Mon Mar 06 06:00 --------------------------------------------------------------------------- Much shorter execution time. Shorter processing time too! Exit code
 of 0!
  42. ? What was the script doing for 11 minutes? …

    but only processing for 5 min? Was it waiting for something? Did it hit some kind of timeout?
  43. ? What was the script doing for 11 minutes? …

    but only processing for 5 min? Was it waiting for something? Did it hit some kind of timeout? This was the magic word.
  44. We had our answer read_timeout
 
 Number of seconds to

    wait for one block to be read. This means it’s not our end! !
  45. Sum it up! • Cron ran, grabbed data, went to

    upload. • Sat there waiting for 10 minutes for the other side to respond, • Until the timeout was triggered, and the process exited with 1. • Client’s logging configuration was not sufficient to capture this particular error. !
  46. Lessons • Process Accounting is amazing for analysis. Turn it

    on! • Always log cron output, separate stdout and stderr. !
  47. Lessons • Process Accounting is amazing for analysis. Turn it

    on! • Always log cron output, separate stdout and stderr. ruby script 1>> script.log 2>> script.err ! This writes output to it’s own file.
  48. Lessons • Process Accounting is amazing for analysis. Turn it

    on! • Always log cron output, separate stdout and stderr. ruby script 1>> script.log 2>> script.err ! This writes errors to it’s own file. This writes output to it’s own file.