Upgrade to Pro — share decks privately, control downloads, hide ads and more …

HPI In Practice: Making the Connection Between Health and Active Transportation

HPI In Practice: Making the Connection Between Health and Active Transportation

WALKSacramento

February 20, 2020
Tweet

More Decks by WALKSacramento

Other Decks in Education

Transcript

  1. WALKSacramento is a nonprofit planning and advocacy organization that improves

    quality of life and health equity through community-centered policy and systems change in land use and transportation.
  2. • Focuses on health and livability outcomes • Aggregates and

    parses out social and physical determinants of health • Fills gaps from CalEnviroScreen What We Like About HPI HPI CALENVIROSCREEN
  3. Safe Routes to Parks and Healthy Retail Goal: Improve health

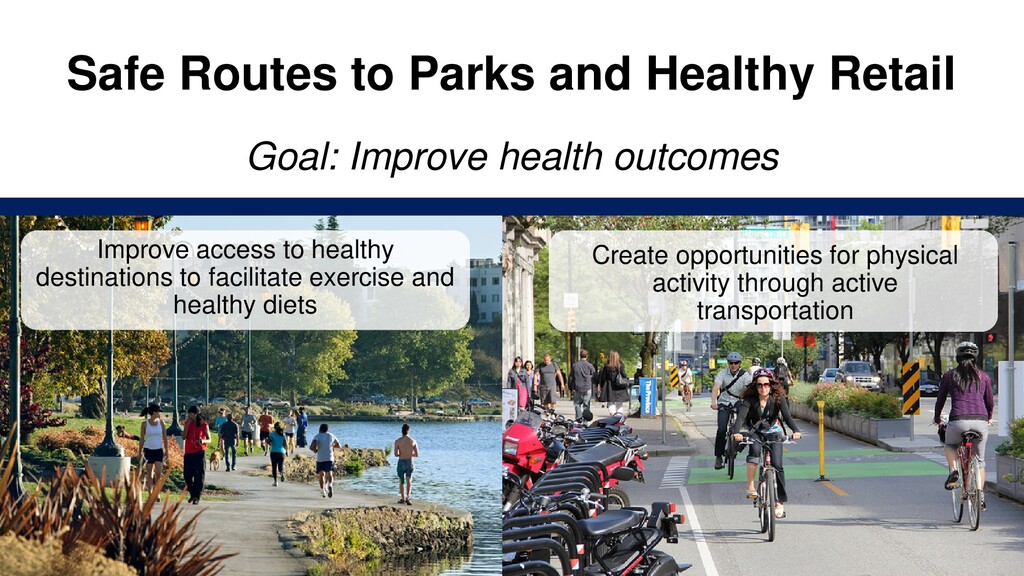
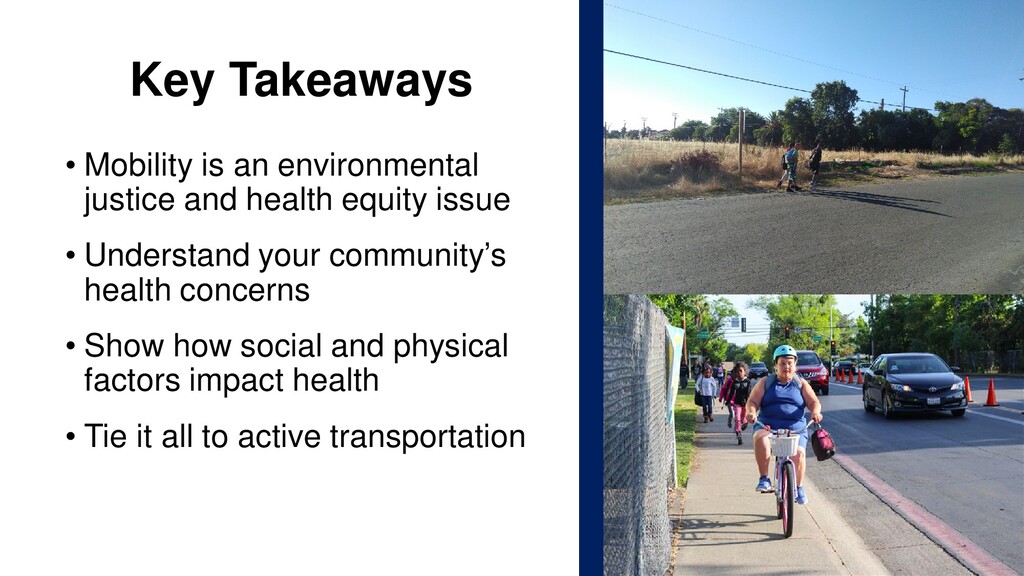
    outcomes Improve access to healthy destinations to facilitate exercise and healthy diets Create opportunities for physical activity through active transportation
  4. Indicators North Sacramento Priority Census Tracts South Sacramento Priority Census

    Tracts Sacramento County HPI Indicators Median Household Income $29,154 $31,114 $67,305 Above Poverty 70.91% 67.52% 37.7% No Automobile Access 17.13% 13.94% 7.13% Homeownership 39.06% 38.1% 56.9% Decision Support Layers Asthma Diagnosis 11.31% 10.92% 9.16% Asthma ER Admissions 115.4 per 10,000 visits 100.09 per 10,000 visits 68.92 per 10,000 visits Diabetes Diagnosis 13.33% 13.53% 9.84% Heart Disease Diagnosis 6.74% 6.43% 4.3% Obesity 33.81% 32.33% 26.01% Children 9.45% 9.05% 6.72% English Speaking 9.81% 17.63% 7.19% Urban Heat Island Index 8873.79 3880.26 6220.34
  5. AUTOMOBILE ACCESS 13.94% Households WITHOUT automobile access 23.34% Households WITHOUT

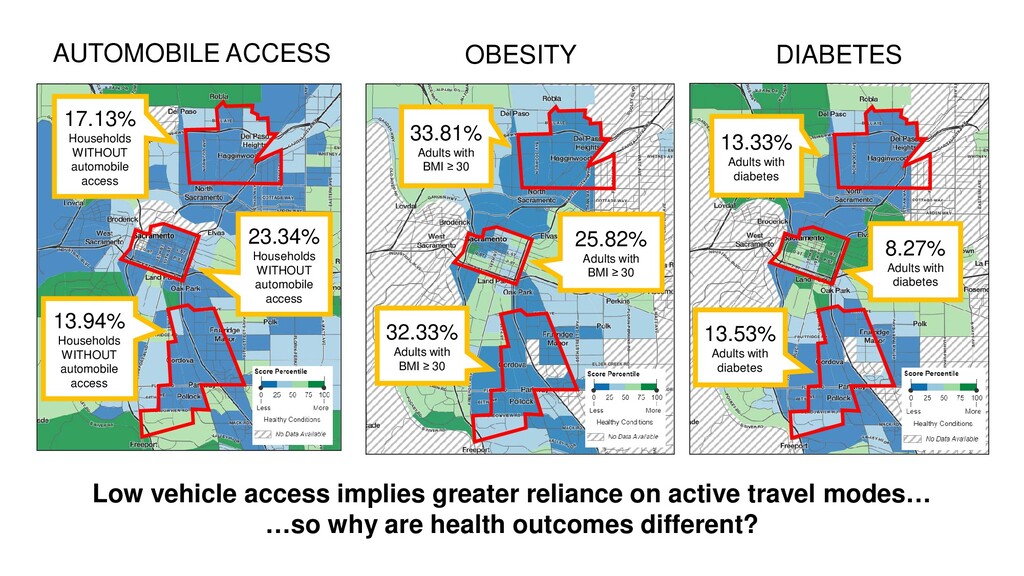
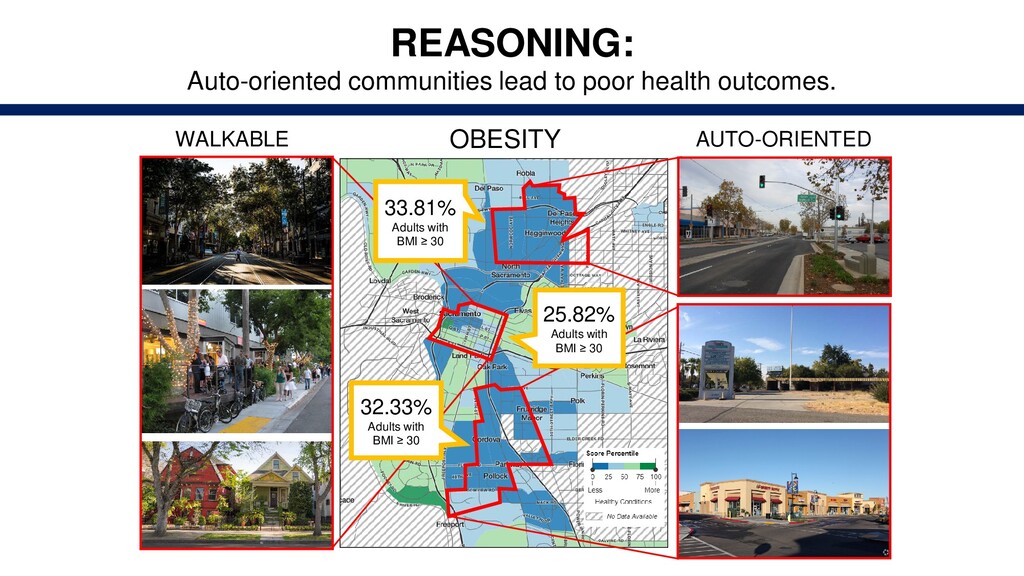
    automobile access 17.13% Households WITHOUT automobile access 33.81% Adults with BMI ≥ 30 32.33% Adults with BMI ≥ 30 25.82% Adults with BMI ≥ 30 OBESITY Low vehicle access implies greater reliance on active travel modes… …so why are health outcomes different? 13.33% Adults with diabetes 13.53% Adults with diabetes 8.27% Adults with diabetes DIABETES
  6. WALKABLE AUTO-ORIENTED 33.81% Adults with BMI ≥ 30 32.33% Adults

    with BMI ≥ 30 25.82% Adults with BMI ≥ 30 REASONING: Auto-oriented communities lead to poor health outcomes. OBESITY
  7. Redefining “Access” • Accessible via multiple modes of transportation •

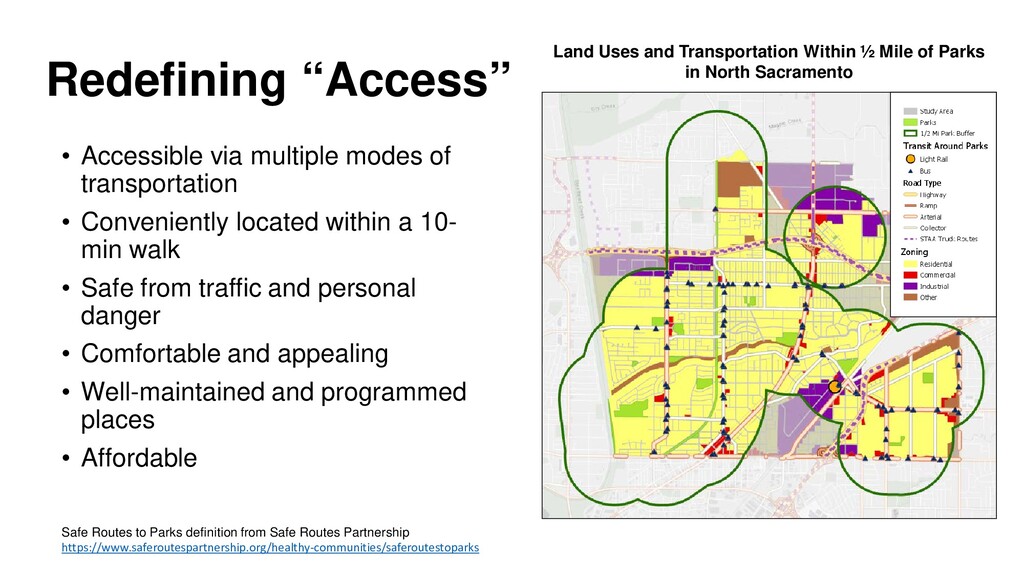
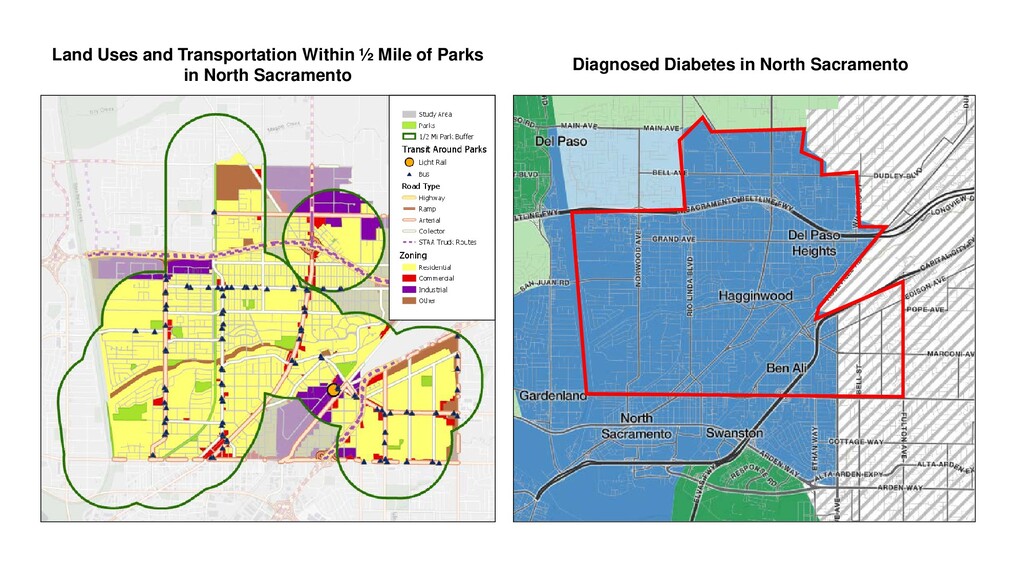
    Conveniently located within a 10- min walk • Safe from traffic and personal danger • Comfortable and appealing • Well-maintained and programmed places • Affordable Land Uses and Transportation Within ½ Mile of Parks in North Sacramento Safe Routes to Parks definition from Safe Routes Partnership https://www.saferoutespartnership.org/healthy-communities/saferoutestoparks
  8. Land Uses and Transportation Within ½ Mile of Parks in

    North Sacramento Diagnosed Diabetes in North Sacramento
  9. HPI in ATP: San Juan USD Case Study Priority health

    concerns: •Chronic disease •Substance abuse •Mental health
  10. HPI in ATP: San Juan USD Case Study Chronic disease

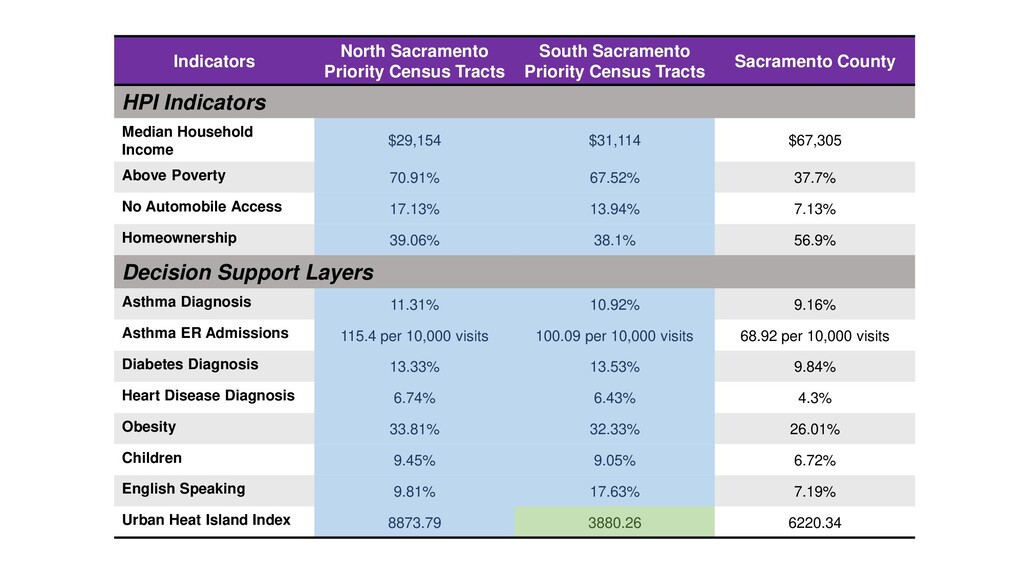
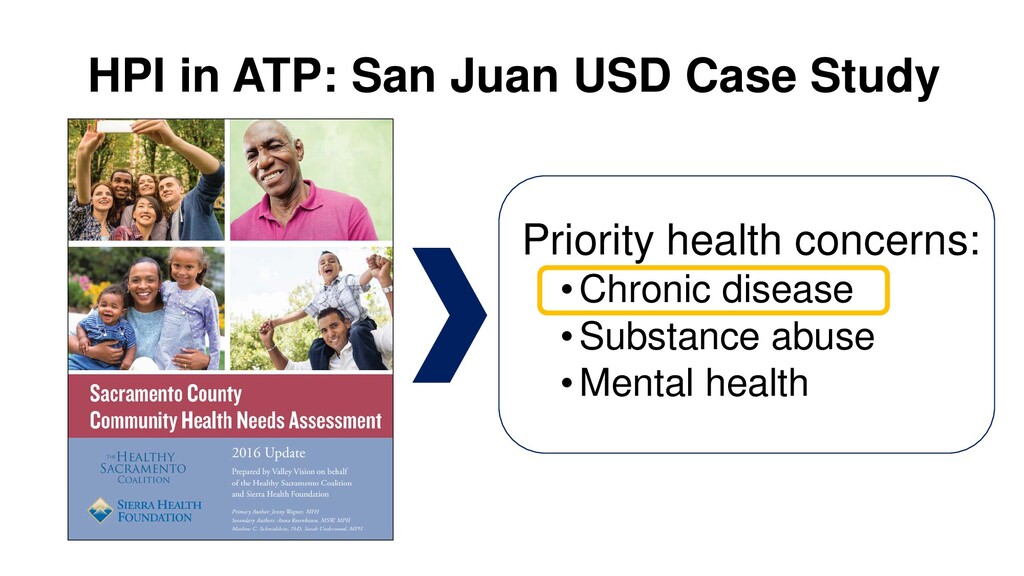
    indicators: • Asthma ED visits • Heart disease ED visits • Diabetes Chronic disease prevention is both a priority and demonstrated need, especially for children and youth. ACTIVE TRANSPORTATION JUSTIFICATION: Asthma ER Admissions 17.5 percentile 68.92 per 10,000 asthma ER visits
  11. Key Takeaways • Mobility is an environmental justice and health

    equity issue • Understand your community’s health concerns • Show how social and physical factors impact health • Tie it all to active transportation