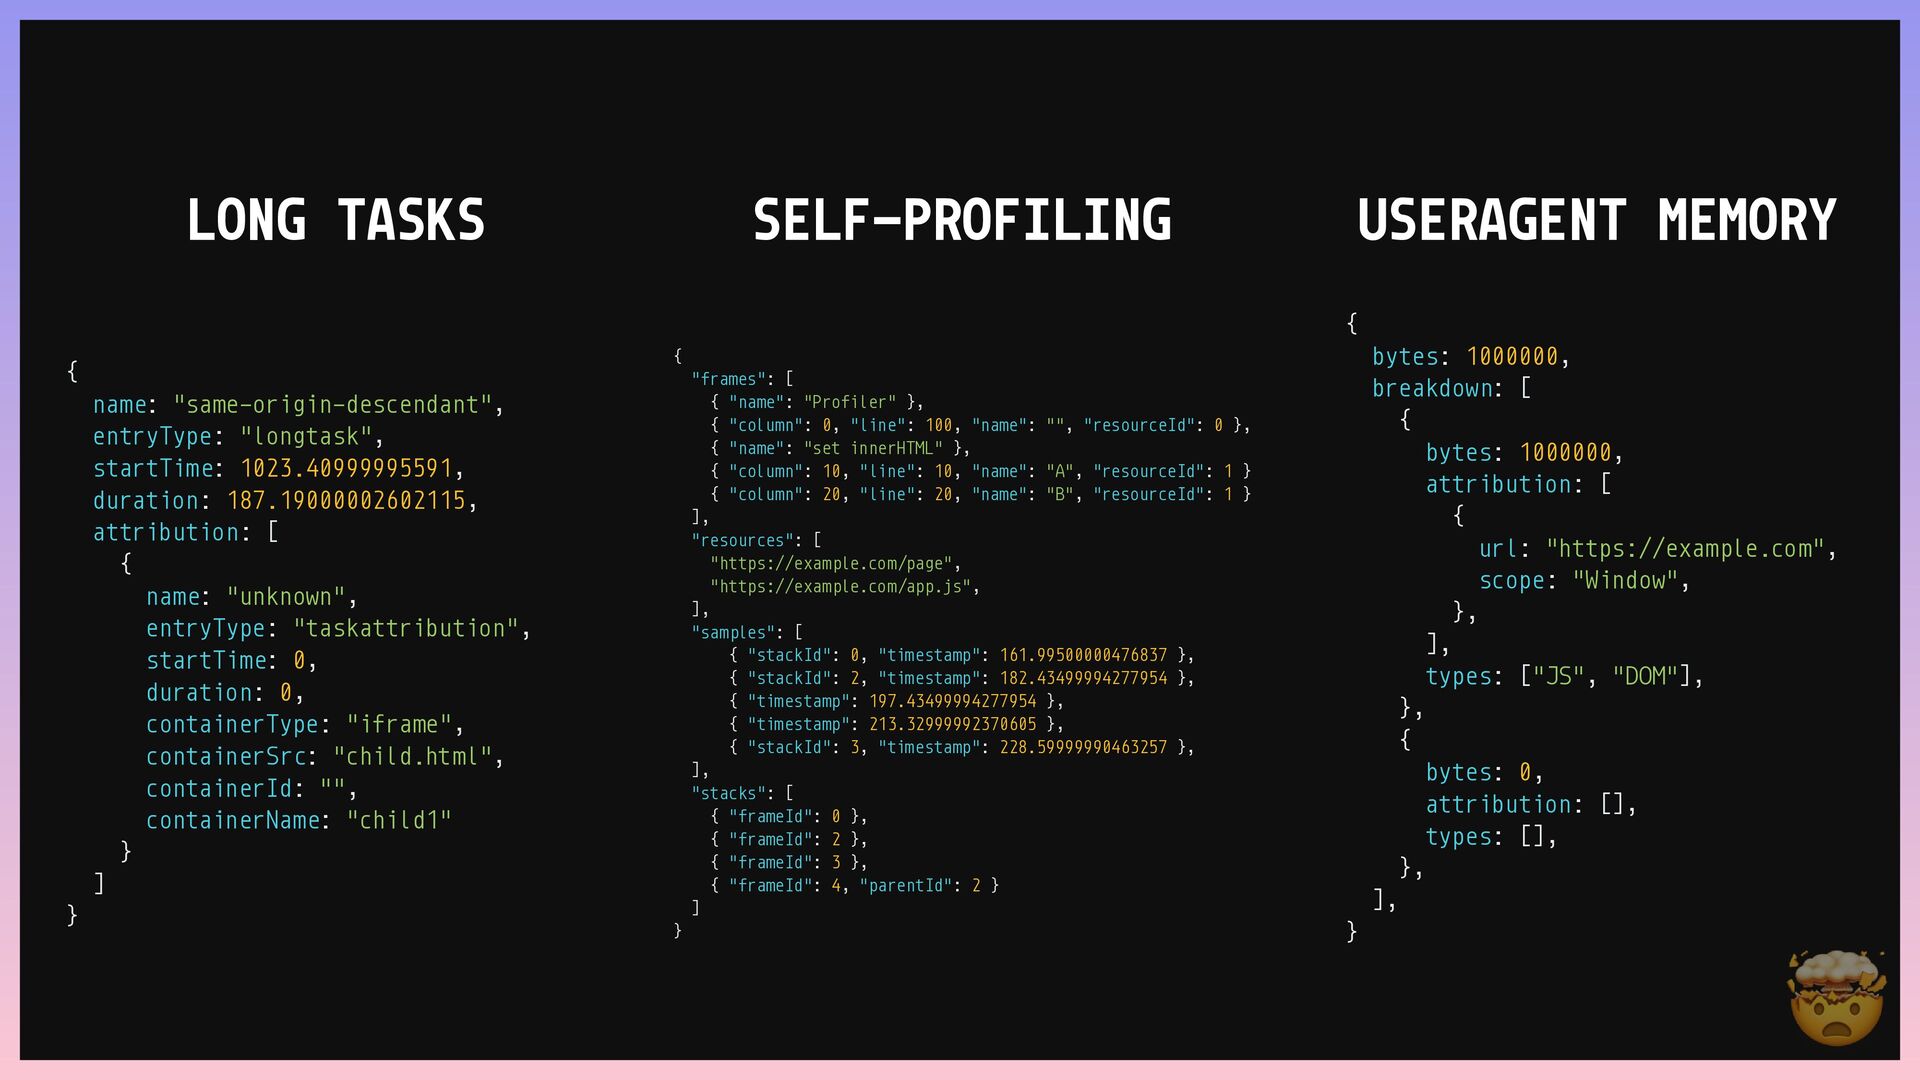
[ { name: "unknown", entryType: "taskattribution", startTime: 0, duration: 0, containerType: "iframe", containerSrc: "child.html", containerId: "", containerName: "child1" } ] } { bytes: 1000000, breakdown: [ { bytes: 1000000, attribution: [ { url: "https://example.com", scope: "Window", }, ], types: ["JS", "DOM"], }, { bytes: 0, attribution: [], types: [], }, ], } { "frames": [ { "name": "Profiler" }, { "column": 0, "line": 100, "name": "", "resourceId": 0 }, { "name": "set innerHTML" }, { "column": 10, "line": 10, "name": "A", "resourceId": 1 } { "column": 20, "line": 20, "name": "B", "resourceId": 1 } ], "resources": [ "https://example.com/page", "https://example.com/app.js", ], "samples": [ { "stackId": 0, "timestamp": 161.99500000476837 }, { "stackId": 2, "timestamp": 182.43499994277954 }, { "timestamp": 197.43499994277954 }, { "timestamp": 213.32999992370605 }, { "stackId": 3, "timestamp": 228.59999990463257 }, ], "stacks": [ { "frameId": 0 }, { "frameId": 2 }, { "frameId": 3 }, { "frameId": 4, "parentId": 2 } ] } LONG TASKS SELF-PROFILING USERAGENT MEMORY 🤯