of Publicly Available Data from the California Child Welfare Indicators Project http://cssr.berkeley.edu/ucb_childwelfare/Default.aspx Anne Happel, Ph.D. April 2020 send comments to [email protected]
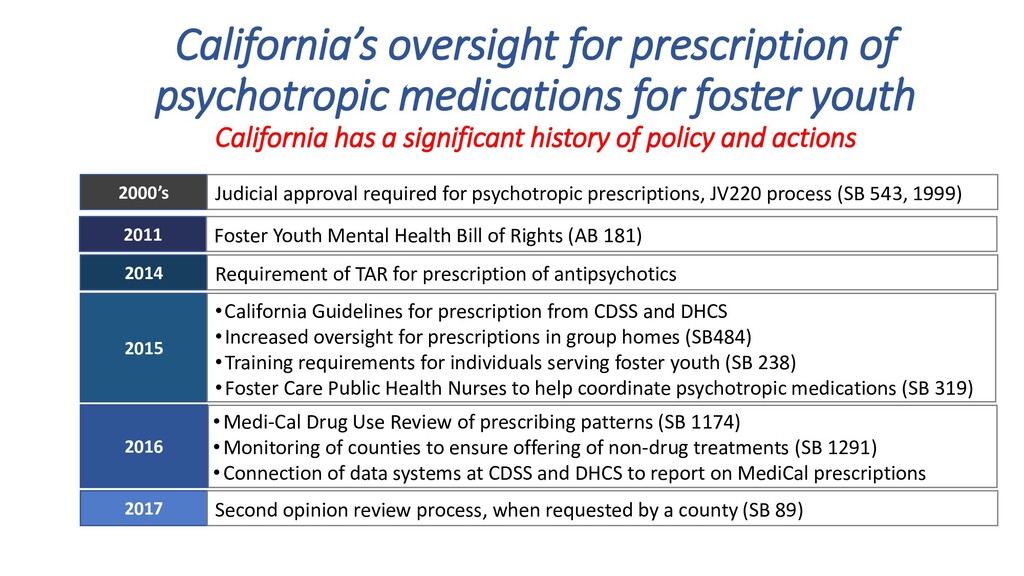
California has a significant history of policy and actions 2000’s 2014 2015 Judicial approval required for psychotropic prescriptions, JV220 process (SB 543, 1999) Requirement of TAR for prescription of antipsychotics •California Guidelines for prescription from CDSS and DHCS •Increased oversight for prescriptions in group homes (SB484) •Training requirements for individuals serving foster youth (SB 238) •Foster Care Public Health Nurses to help coordinate psychotropic medications (SB 319) 2011 Foster Youth Mental Health Bill of Rights (AB 181) 2016 •Medi-Cal Drug Use Review of prescribing patterns (SB 1174) •Monitoring of counties to ensure offering of non-drug treatments (SB 1291) •Connection of data systems at CDSS and DHCS to report on MediCal prescriptions 2017 Second opinion review process, when requested by a county (SB 89)
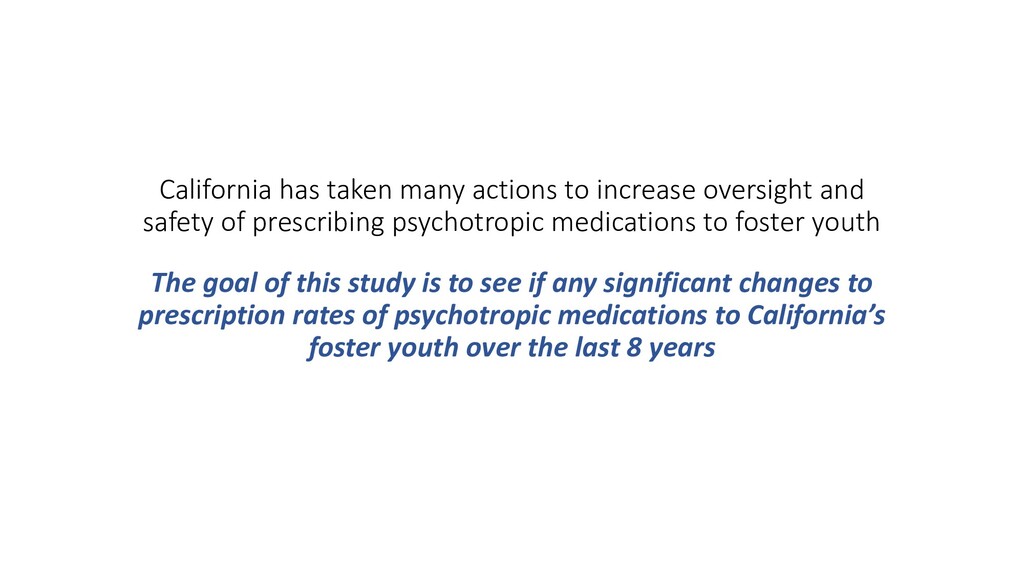
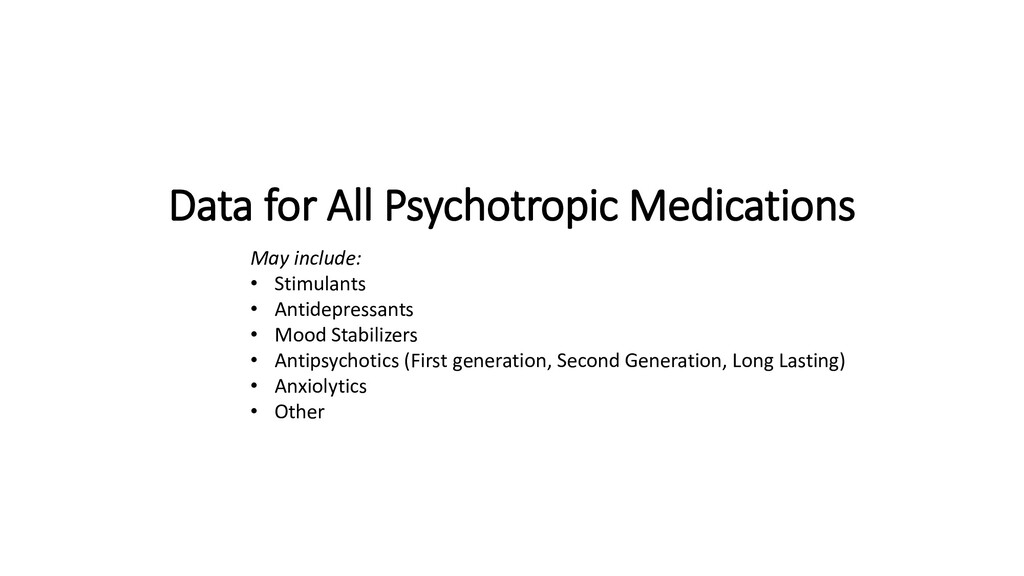
of prescribing psychotropic medications to foster youth The goal of this study is to see if any significant changes to prescription rates of psychotropic medications to California’s foster youth over the last 8 years
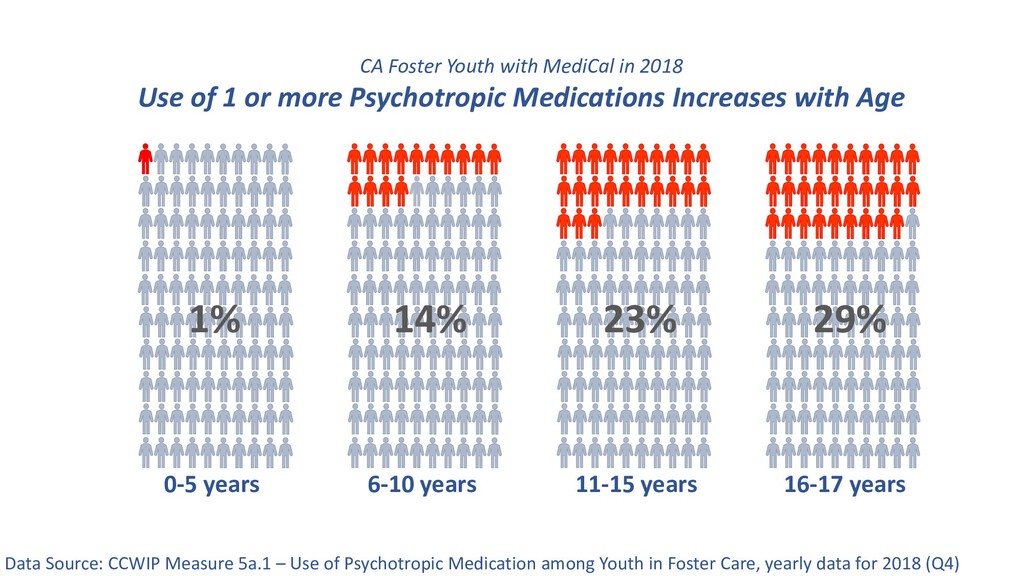
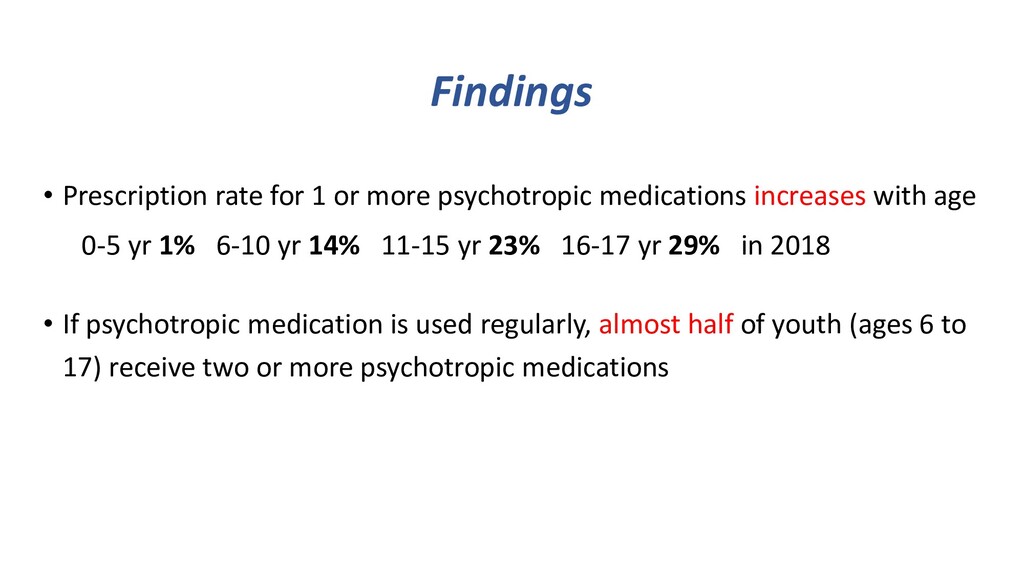
or more Psychotropic Medications Increases with Age Data Source: CCWIP Measure 5a.1 – Use of Psychotropic Medication among Youth in Foster Care, yearly data for 2018 (Q4) 0-5 years 6-10 years 11-15 years 16-17 years 1% 14% 23% 29%
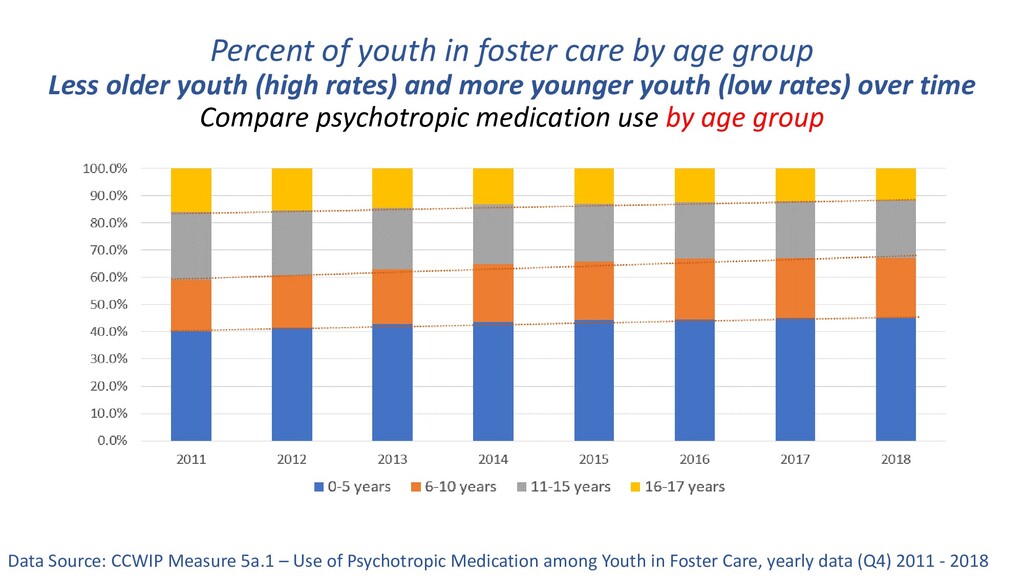
older youth (high rates) and more younger youth (low rates) over time Compare psychotropic medication use by age group 0.0% 10.0% 20.0% 30.0% 40.0% 50.0% 60.0% 70.0% 80.0% 90.0% 100.0% 2011 2012 2013 2014 2015 2016 2017 2018 0-5 years 6-10 years 11-15 years 16-17 years Data Source: CCWIP Measure 5a.1 – Use of Psychotropic Medication among Youth in Foster Care, yearly data (Q4) 2011 - 2018
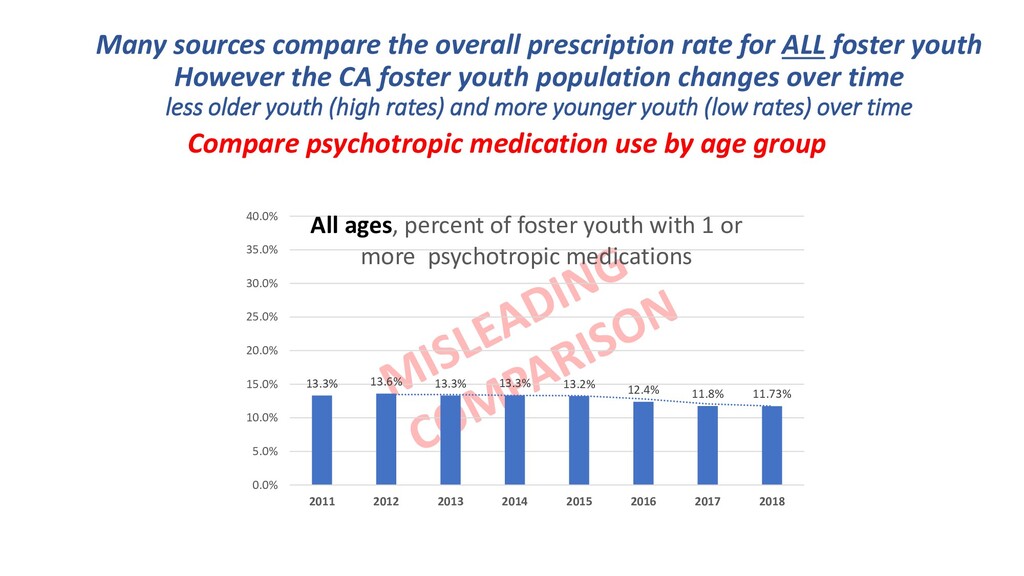
youth However the CA foster youth population changes over time less older youth (high rates) and more younger youth (low rates) over time 13.3% 13.6% 13.3% 13.3% 13.2% 12.4% 11.8% 11.73% 0.0% 5.0% 10.0% 15.0% 20.0% 25.0% 30.0% 35.0% 40.0% 2011 2012 2013 2014 2015 2016 2017 2018 All ages, percent of foster youth with 1 or more psychotropic medications Compare psychotropic medication use by age group
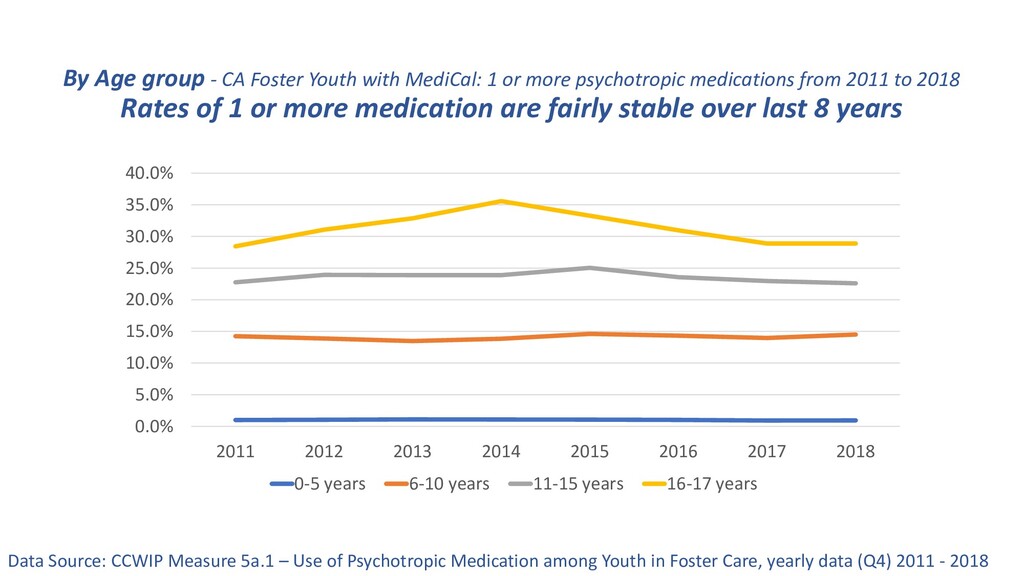
or more psychotropic medications from 2011 to 2018 Rates of 1 or more medication are fairly stable over last 8 years 0.0% 5.0% 10.0% 15.0% 20.0% 25.0% 30.0% 35.0% 40.0% 2011 2012 2013 2014 2015 2016 2017 2018 0-5 years 6-10 years 11-15 years 16-17 years Data Source: CCWIP Measure 5a.1 – Use of Psychotropic Medication among Youth in Foster Care, yearly data (Q4) 2011 - 2018
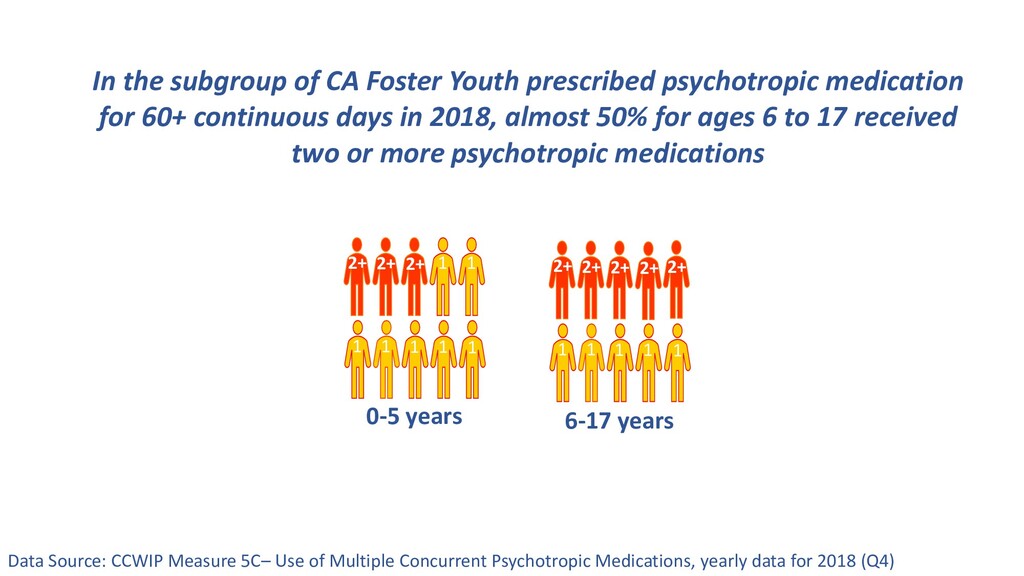
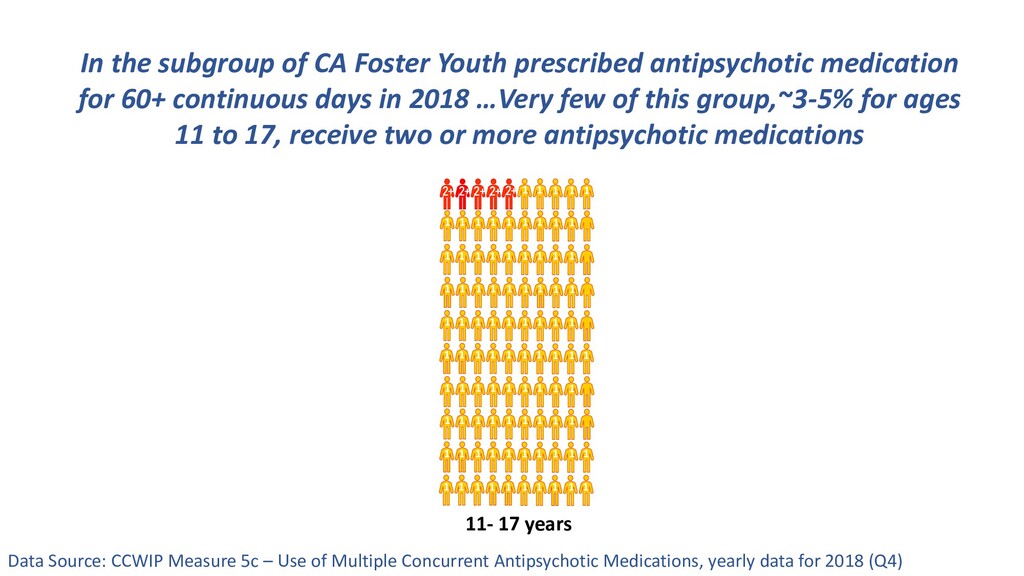
Medications, yearly data for 2018 (Q4) 0-5 years 6-17 years 1 1 1 1 2+ 2+ 1 1 1 2+ In the subgroup of CA Foster Youth prescribed psychotropic medication for 60+ continuous days in 2018, almost 50% for ages 6 to 17 received two or more psychotropic medications 1 1 1 2+ 2+ 1 1 1 2+ 2+ 2+ 1 2+
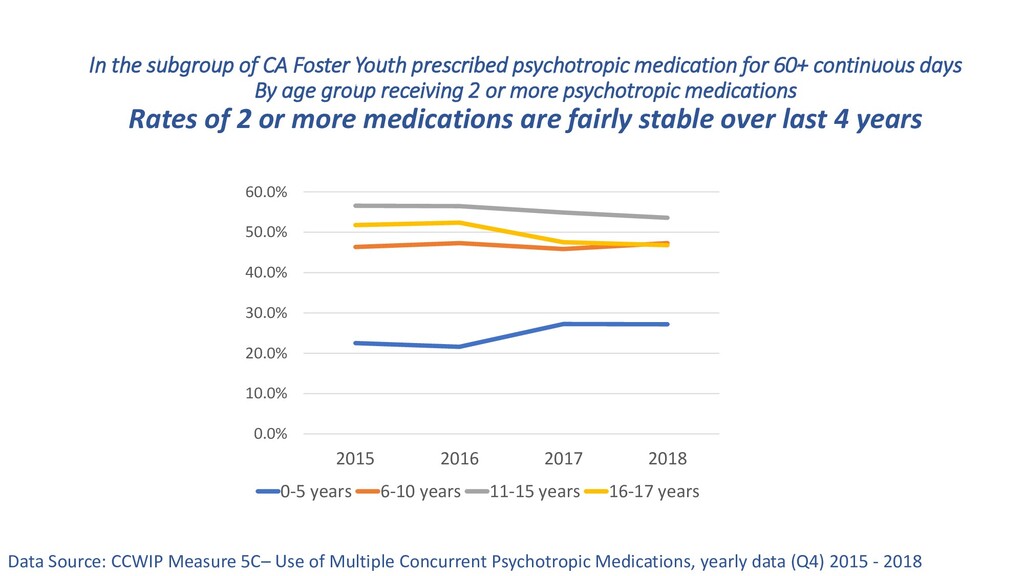
for 60+ continuous days By age group receiving 2 or more psychotropic medications Rates of 2 or more medications are fairly stable over last 4 years Data Source: CCWIP Measure 5C– Use of Multiple Concurrent Psychotropic Medications, yearly data (Q4) 2015 - 2018 0.0% 10.0% 20.0% 30.0% 40.0% 50.0% 60.0% 2015 2016 2017 2018 0-5 years 6-10 years 11-15 years 16-17 years
increases with age 0-5 yr 1% 6-10 yr 14% 11-15 yr 23% 16-17 yr 29% in 2018 • If psychotropic medication is used regularly, almost half of youth (ages 6 to 17) receive two or more psychotropic medications
age group Overall rates for all CA youth in foster care cannot be easily compared between years because the distribution of age groups is changing over time - less older youth (high rates) and more younger youth (low rates)
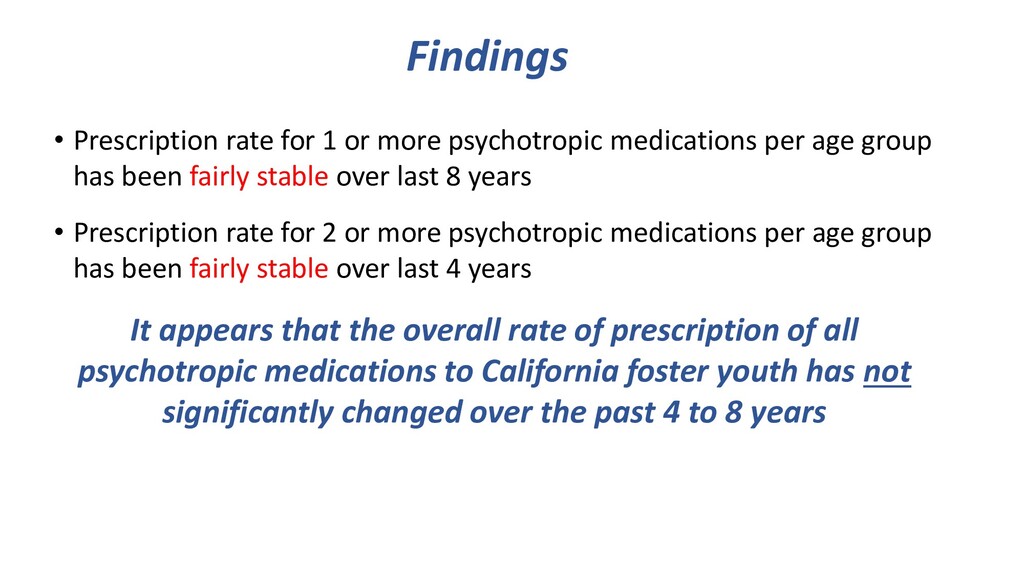
per age group has been fairly stable over last 8 years • Prescription rate for 2 or more psychotropic medications per age group has been fairly stable over last 4 years It appears that the overall rate of prescription of all psychotropic medications to California foster youth has not significantly changed over the past 4 to 8 years
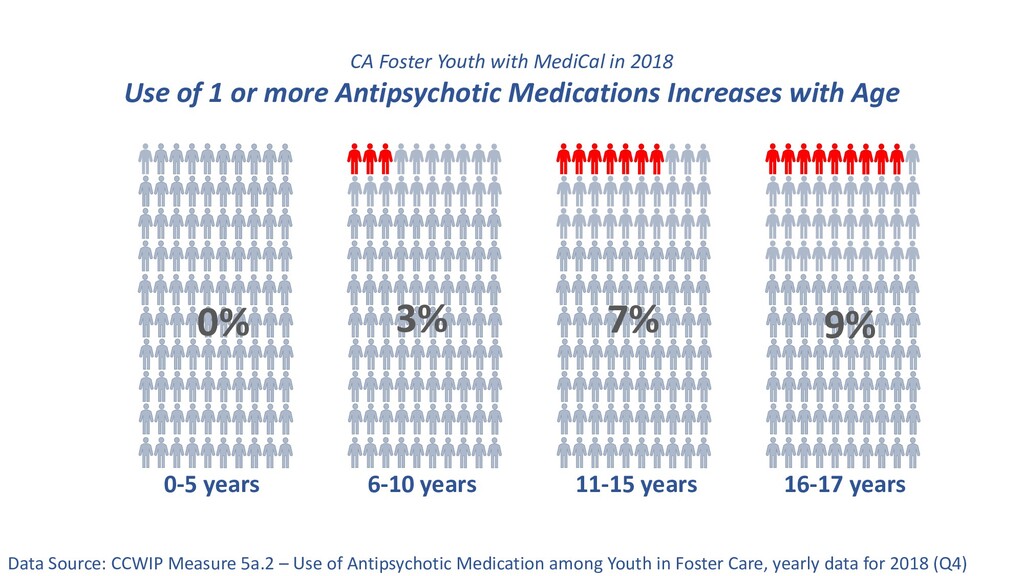
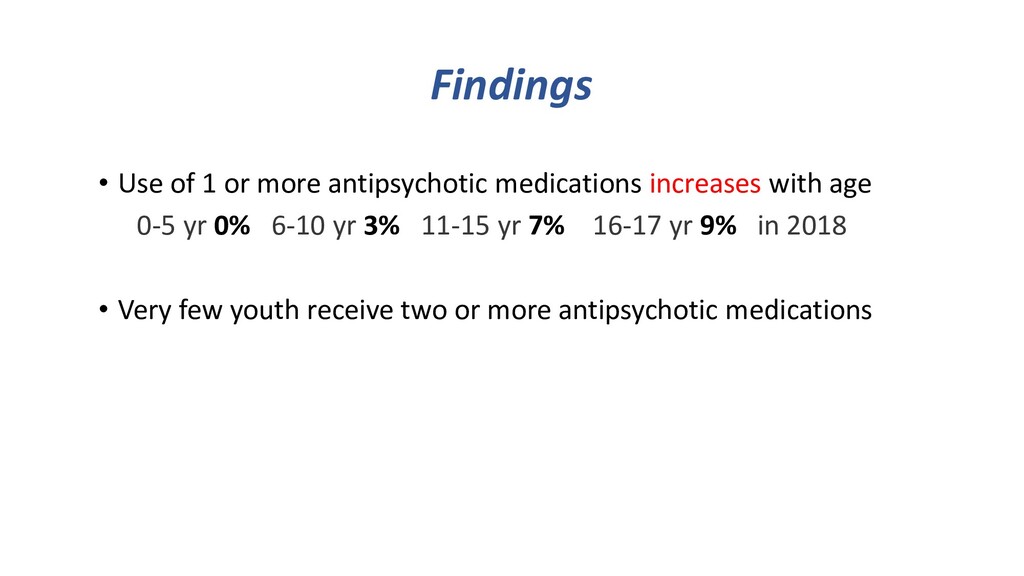
or more Antipsychotic Medications Increases with Age Data Source: CCWIP Measure 5a.2 – Use of Antipsychotic Medication among Youth in Foster Care, yearly data for 2018 (Q4) 0-5 years 6-10 years 11-15 years 16-17 years 0% 3% 7% 9%
requires physicians to submit a Treatment Authorization Request (TAR) before prescribing antipsychotic medication for youth under the age of 18 who are covered by Medi-Cal • A state pharmacist now must verify the “medical necessity” of each prescription
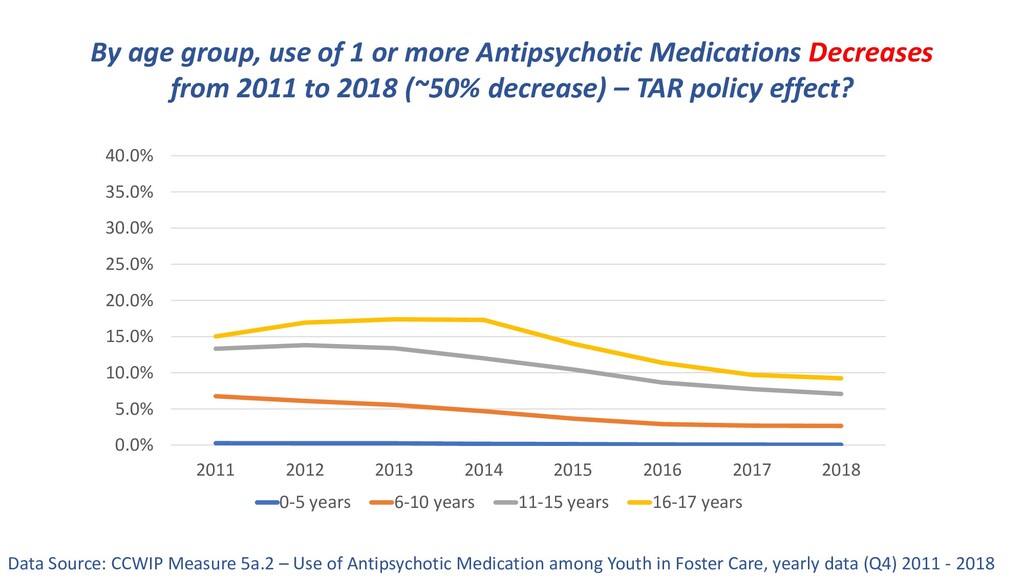
Decreases from 2011 to 2018 (~50% decrease) – TAR policy effect? Data Source: CCWIP Measure 5a.2 – Use of Antipsychotic Medication among Youth in Foster Care, yearly data (Q4) 2011 - 2018 0.0% 5.0% 10.0% 15.0% 20.0% 25.0% 30.0% 35.0% 40.0% 2011 2012 2013 2014 2015 2016 2017 2018 0-5 years 6-10 years 11-15 years 16-17 years
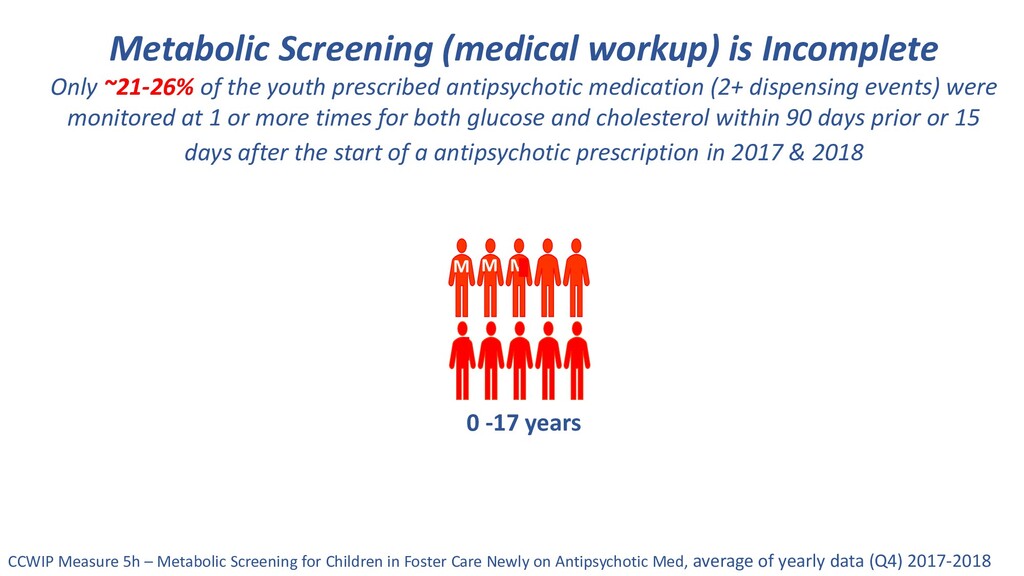
youth prescribed antipsychotic medication (2+ dispensing events) were monitored at 1 or more times for both glucose and cholesterol within 90 days prior or 15 days after the start of a antipsychotic prescription in 2017 & 2018 CCWIP Measure 5h – Metabolic Screening for Children in Foster Care Newly on Antipsychotic Med, average of yearly data (Q4) 2017-2018 0 -17 years M M M
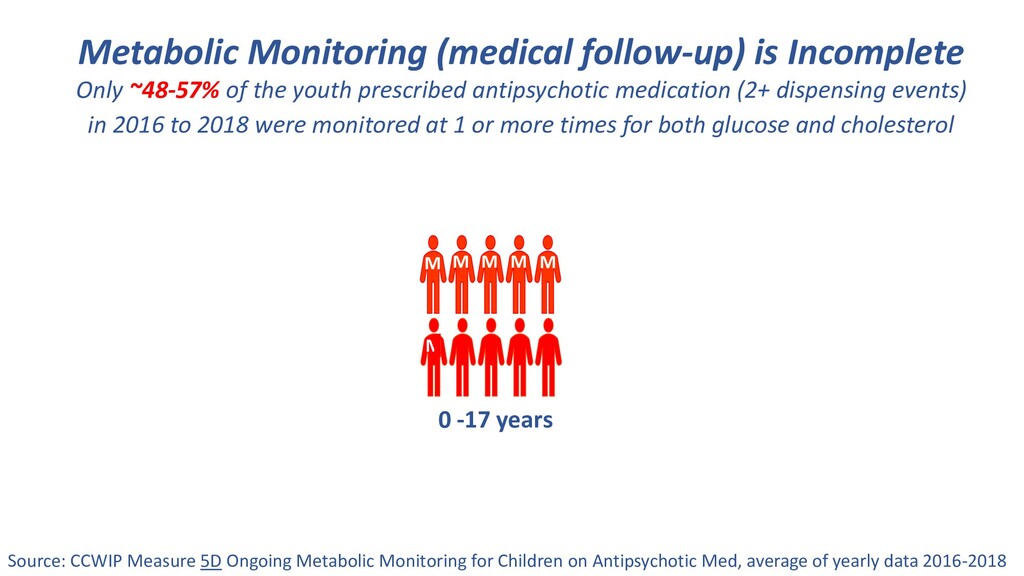
youth prescribed antipsychotic medication (2+ dispensing events) in 2016 to 2018 were monitored at 1 or more times for both glucose and cholesterol Source: CCWIP Measure 5D Ongoing Metabolic Monitoring for Children on Antipsychotic Med, average of yearly data 2016-2018 0 -17 years M M M M M M M
decreased from 2011 to 2018, ~50% decrease may be due to the TAR policy The rate of prescription antipsychotic medication to California foster youth appears to have significantly decreased (~50%) and correlates with the timing of the TAR policy
incomplete Required lab tests for screening (medical workup before prescription) & monitoring (medical follow-up after prescription) for antipsychotic prescriptions appear to be lacking
that may help answer questions about the effectiveness of policies and oversight • Analysis of aggregated data - does not contain personal identification information • The following suggestions are intended to be “low-hanging fruit” – data analysis that may be easily performed with the current data that CDSS receives from CDPH
for each class of psychotropic medication by age group. Look for significant increases or decreases over time per class of drug. The existing public data shows that the prescription rate of antipsychotics has significantly decreased over time, yet rates of prescription of all psychotropic drugs has remained stable over time. • Which classes of psychotropic medications have increased prescription rates? • Have other classes of psychotropic medications decreased prescription rates? 2. Compare LA County to the rest of California by age group and class of psychotropic medication to see if there are significant differences in rates of prescriptions. Has LA County prescription practices altered the rates of prescriptions of psychotropic medications to foster youth? • LA County has had a long established second review process by consultants • LA County originated the prescribing parameters
for issues identified in previous auditors reports • Percent of foster care youth (per age group) with prescriptions for multiple psychotropic medications in the same class – examine over time • Percent of foster care youth (per age group) with psychotropic prescriptions that exceed the state’s guidelines for each age group – examine over time