Upgrade to Pro — share decks privately, control downloads, hide ads and more …

MicroXchg: Logging and Metrics in Microservice Architectures

MicroXchg: Logging and Metrics in Microservice Architectures

Alexander Heusingfeld

February 05, 2016
Tweet

More Decks by Alexander Heusingfeld

Other Decks in Technology

Transcript

  1. Don’t Fly Blind
    Logging and Metrics in Microservice Architectures
    Tammo van Lessen | [email protected]
    Alexander Heusingfeld | [email protected]
    #microxchg #logging #metrics
    www.innoQ.com

    View Slide

  2. The Talk Today
    > Motivation
    > Distributed Logging
    > Distributed Metrics
    > Conclusions

    View Slide

  3. Breaking the monolith

    View Slide

  4. If you review a
    monolithic application …
    © innoQ/Roman Stranghöner

    View Slide

  5. …and look into the
    black box…
    © innoQ/Roman Stranghöner

    View Slide

  6. …you’ll find it consists
    of multiple Bounded
    Contexts.
    © innoQ/Roman Stranghöner

    View Slide

  7. If you’re able to treat every
    Bounded Context as a
    separately deployable,
    independent component…
    © innoQ/Roman Stranghöner

    View Slide

  8. … you’ll have a self-contained
    system - which can lead to a 

    microservice architecture
    Introduction to self-contained systems: https://www.innoq.com/de/links/self-contained-systems-infodeck/

    View Slide

  9. A Broken Monolith

    View Slide

  10. Architectural Decisions
    > Domain Architecture


    > Macro Architecture


    > Micro Architecture

    View Slide

  11. Logging in a Distributed
    Environment

    View Slide

  12. Requirements
    > Apply a well-thought logging concept
    > Aggregate logs in different formats from
    different systems
    > Search & Correlate
    > Visualize & Drill-down
    > Alerting

    View Slide

  13. Use Thread Contexts / MDCs
    %-5p: [%X{loginId}] %m%n
    ThreadContext.put("loginId", login);
    logger.error("Something bad happened!");
    ThreadContext.clear();
    + Layout:
    ERROR: [John Doe] Something bad happened!
    Log:

    View Slide

  14. Use Thread Contexts / MDCs
    {
    "@version" => "1",
    "@timestamp" => "2014-04-29T14:21:14.988-07:00",
    "logger" => "com.example.LogStashExampleTest",
    "level" => "ERROR",
    "thread" => "Test worker",
    "message" => "Something bad happened!",
    "Properties" => {
    "loginId" => "John Doe"
    }
    }
    ThreadContext.put("loginId", login);
    logger.error("Something bad happened!");
    ThreadContext.clear();
    + JSON Layout
    Log:

    View Slide

  15. Define QoS for Log Messages
    > Log messages may have 
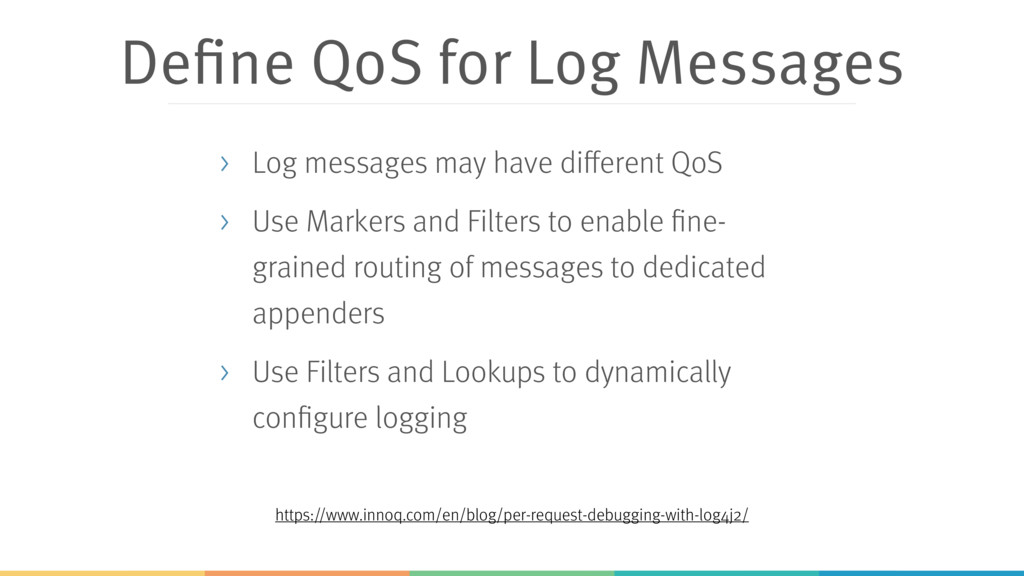
different QoS
    > Use Markers and Filters to enable fine-
    grained routing of messages to dedicated
    appenders
    > Use Filters and Lookups to dynamically
    configure logging
    https://www.innoq.com/en/blog/per-request-debugging-with-log4j2/

    View Slide

  16. Requirements
    > Apply a well-thought logging concept
    > Aggregate logs in different formats from
    different systems
    > Search & Correlate
    > Visualize & Drill-down
    > Alerting

    View Slide

  17. Logstash Architecture

    View Slide

  18. Default ELK-Stack Setup
    Shipper / 

    Logstash Forwarder
    Storage & Search Visualize
    https://www.elastic.co/products/logstash
    Push

    View Slide

  19. Distributed Logstash Setup
    Shipper / 

    Logstash Forwarder
    Broker Indexer Storage & Search Visualize
    https://www.elastic.co/products/logstash
    Push Pull

    View Slide

  20. Requirements
    > Apply a well-thought logging concept
    > Aggregate logs in different formats from
    different systems
    > Search & Correlate
    > Visualize & Drill-down
    > Alerting

    View Slide

  21. View Slide

  22. Requirements
    > Apply a well-thought logging concept
    > Aggregate logs in different formats from
    different systems
    > Search & Correlate
    > Visualize & Drill-down
    > Alerting

    View Slide

  23. Filter Log Stream For Alerts
    input {

    }
    filter {
    if [message] =~ /.*(CRITICAL|FATAL|ERROR|EXCEPTION).*/ {
    mutate { add_tag => "alarm" }
    }
    if [message] =~ /.*(?i)ignoreme.*/ {
    mutate { remove_tag => "alarm" }
    }
    }
    output {
    if [type] == "production" {
    if "alarm" in [tags] {
    pagerduty {
    description => "%{host} - %{log_level}: %{log_message}"
    details => {
    "timestamp" => "%{@timestamp}"
    "host" => "%{host}"
    "log_level" => "%{log_level}"
    "message" => "%{log_message}"
    "path" => "%{path}"
    }

    }
    }
    }
    }

    View Slide

  24. Logging is cool…
    And I can use it to collect metrics as well, right?
    © http://www.flickr.com/photos/dkeats/3128150892/

    View Slide

  25. Logging is cool…
    And I can use it to collect metrics as well, right?
    Watch out!
    © http://www.flickr.com/photos/dkeats/3128150892/

    View Slide

  26. Metrics

    View Slide

  27. Kinds of Metrics

    View Slide

  28. Kinds of Metrics
    > Business Metrics

    View Slide

  29. Kinds of Metrics
    > Business Metrics
    > Application Metrics

    View Slide

  30. Kinds of Metrics
    > Business Metrics
    > Application Metrics
    > System Metrics

    View Slide

  31. Why should a developer care?

    View Slide

  32. View Slide

  33. View Slide

  34. Types of Metrics

    View Slide

  35. Gauges
    A gauge is an instrument that measures
    a value.
    © https://secure.flickr.com/photos/profilerehab/4974589604/

    View Slide

  36. Counters
    A counter is a simple incrementing and
    decrementing integer.
    © https://secure.flickr.com/photos/mwichary/2273099939/

    View Slide

  37. Meters
    A meter measures the rate at which a
    set of events occur.
    © https://www.flickr.com/photos/springfieldhomer/1244320899

    View Slide

  38. Histograms
    A histogram measures the distribution
    of values.
    © https://secure.flickr.com/photos/boulter/3998842325/

    View Slide

  39. Timers
    A timer is a histogram over a duration.
    © https://secure.flickr.com/photos/psd/4686988937/

    View Slide

  40. Distributed Metrics Architecture
    Measure
    Collect &
    Sample
    Store
    Query &
    Graph
    Anomaly
    Detection
    Alerting
    CEP
    Dashboards

    View Slide

  41. Grafana for Technicians
    © http://grafana.org/

    View Slide

  42. Grafana for Technicians
    © http://grafana.org/

    View Slide

  43. Dashing for Management Dashboards
    © https://shopify.github.io/dashing/

    View Slide

  44. + producer unaware of target
    + multiple targets possible
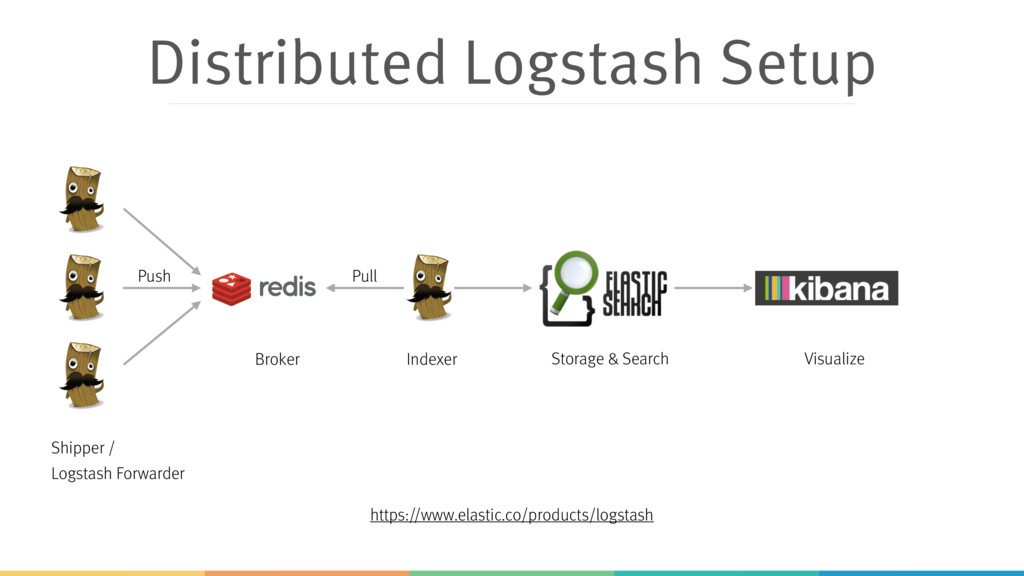
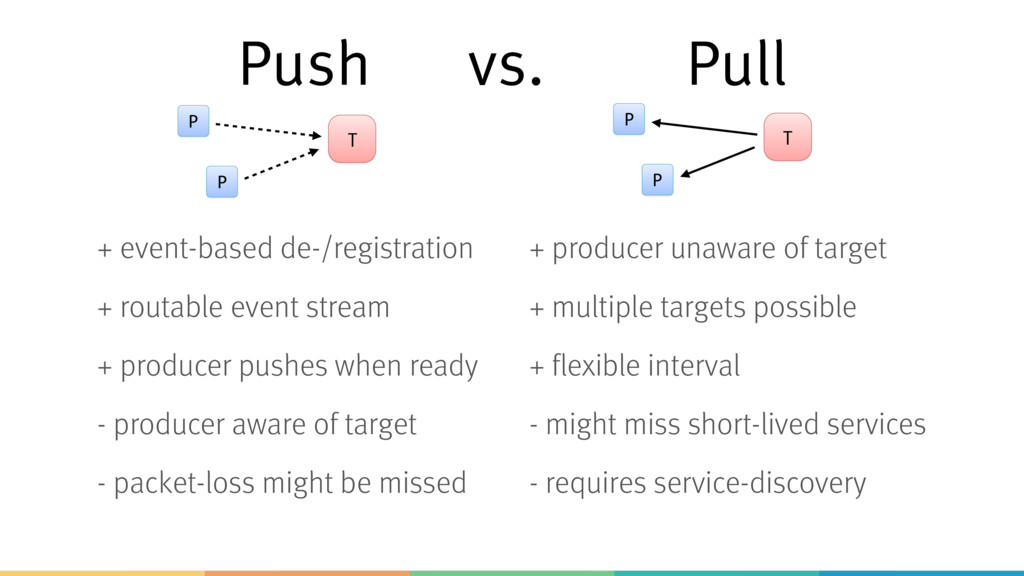
    + flexible interval
    - might miss short-lived services
    - requires service-discovery
    P
    T
    P
    Push
    + event-based de-/registration
    + routable event stream
    + producer pushes when ready
    - producer aware of target
    - packet-loss might be missed
    Pull
    P
    T
    P
    vs.

    View Slide

  45. Some Recommendations
    > Think about what metrics are of importance
    for operating your application
    > Consider retention policies
    > Carefully design your dashboards
    > Think about non-standard graph types

    View Slide

  46. Sample architecture

    View Slide

  47. View Slide

  48. Conclusions
    > Create and document concepts for logging and metrics
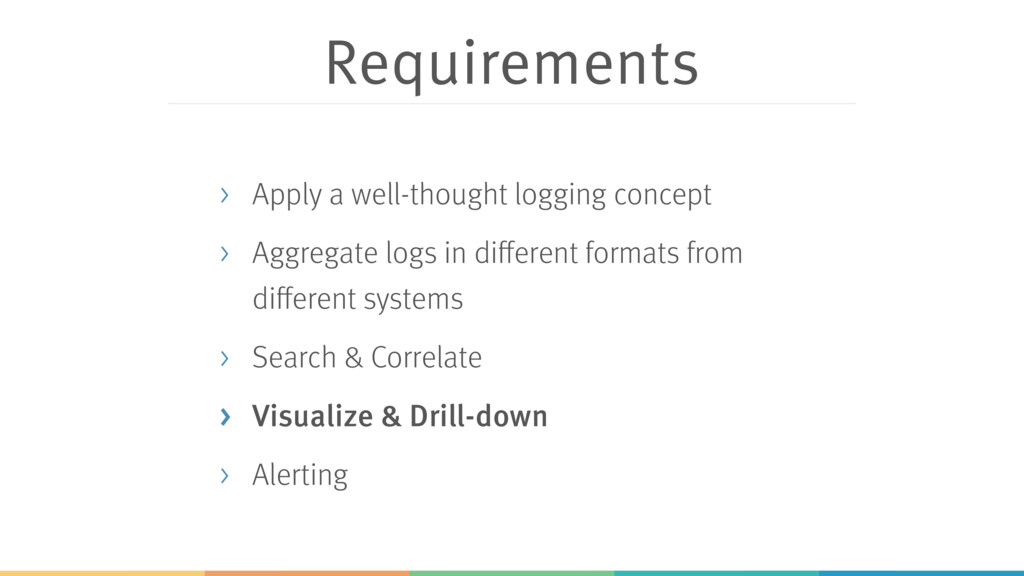
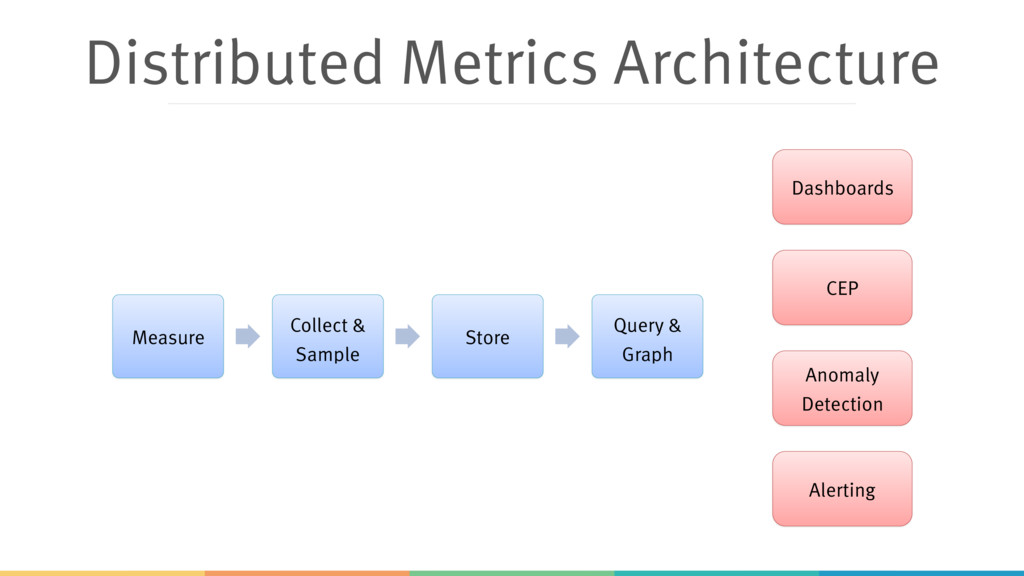
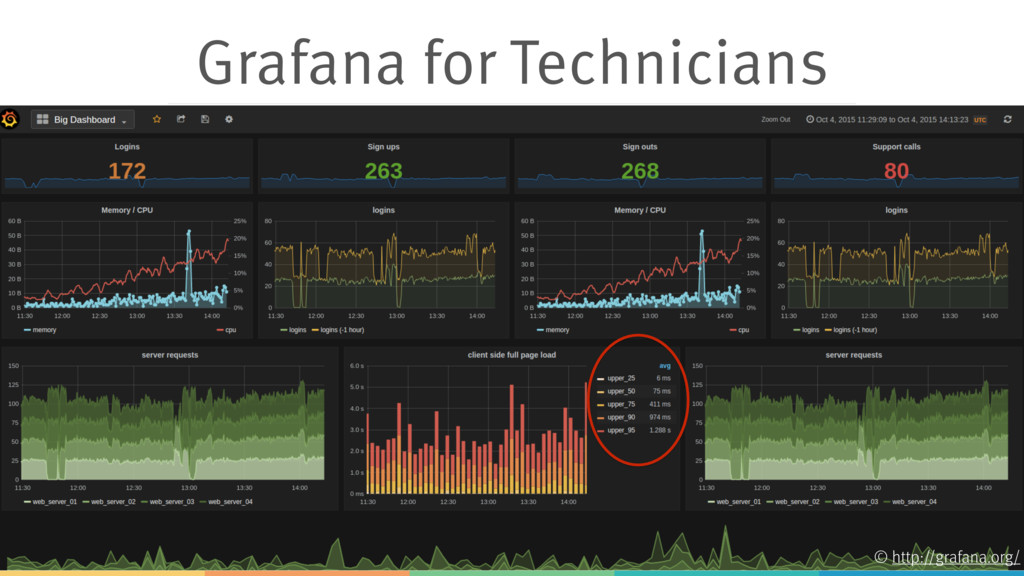
    > Collect & aggregate distributed logs and metrics
    > Create dashboards tailored for your audience
    > Correlate your data to make conscious decisions
    > Don’t create your very own big data problem
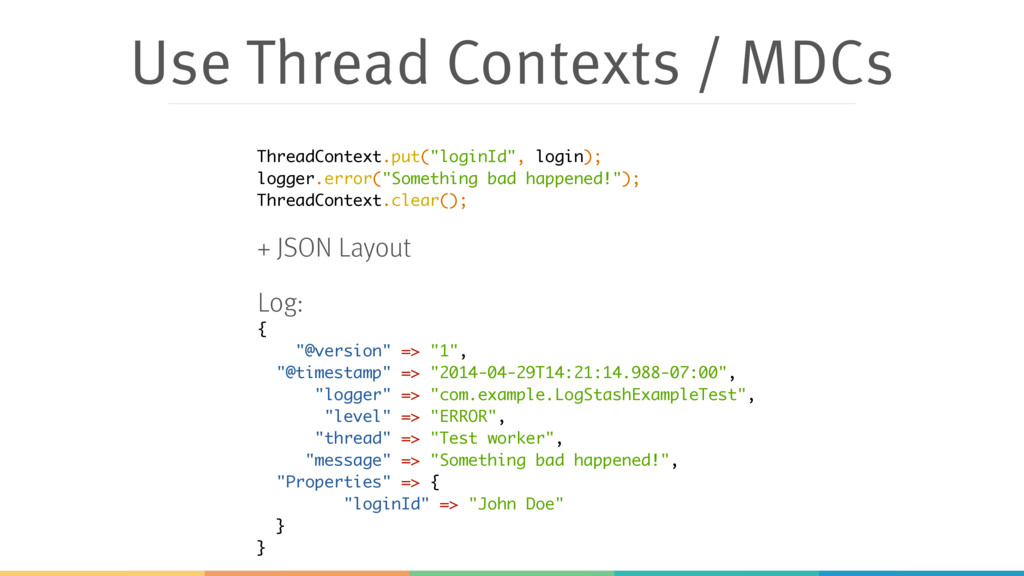
    View Slide

  49. Prevent the apocalypse!
    Logging shows events.
    Metrics show state.
    Don't fly blind!
    © http://www.flickr.com/photos/pasukaru76/5067879762

    View Slide

  50. Tammo van Lessen | @taval
    [email protected]
    Alexander Heusingfeld | @goldstift
    [email protected]
    Thank you!
    Questions?
    Comments?
    innoQ Deutschland GmbH
    Krischerstr. 100
    D-40789 Monheim am Rhein
    Germany
    Phone: +49 2173 3366-0
    innoQ Schweiz GmbH
    Gewerbestr. 11
    CH-6330 Cham
    Switzerland
    Phone: +41 41 743 0116
    www.innoq.com
    Ohlauer Straße 43
    D-10999 Berlin
    Germany
    Phone: +49 2173 3366-0
    Ludwigstr. 180 E
    D-63067 Offenbach
    Germany
    Phone: +49 2173 3366-0
    Kreuzstr. 16
    D-80331 München
    Germany
    Telefon +49 2173 3366-0
    https://www.innoq.com/en/talks/

    View Slide