Upgrade to Pro — share decks privately, control downloads, hide ads and more …

decksh samples

Anthony Starks
January 08, 2020

decksh samples

Examples of decksh visualizations and information displays

Anthony Starks

January 08, 2020
Tweet

More Decks by Anthony Starks

Other Decks in Design

Transcript

  1. Apple Fiscal 4Q 2018 Results Revenue by region (Billion USD)

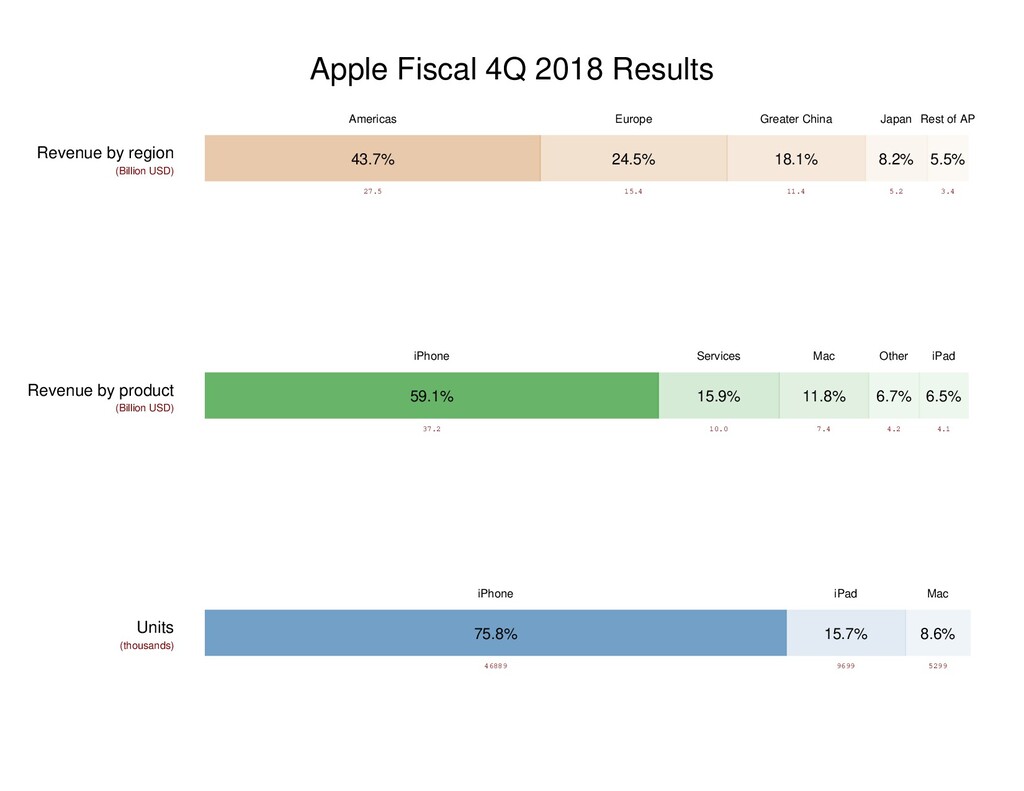
    Revenue by product (Billion USD) Units (thousands) Americas 27.5 43.7% Europe 15.4 24.5% Greater China 11.4 18.1% Japan 5.2 8.2% Rest of AP 3.4 5.5% iPhone 37.2 59.1% Services 10.0 15.9% Mac 7.4 11.8% Other 4.2 6.7% iPad 4.1 6.5% iPhone 46889 75.8% iPad 9699 15.7% Mac 5299 8.6%
  2. Apple Fiscal 4Q 2018 Results Revenue by region (Billion USD)

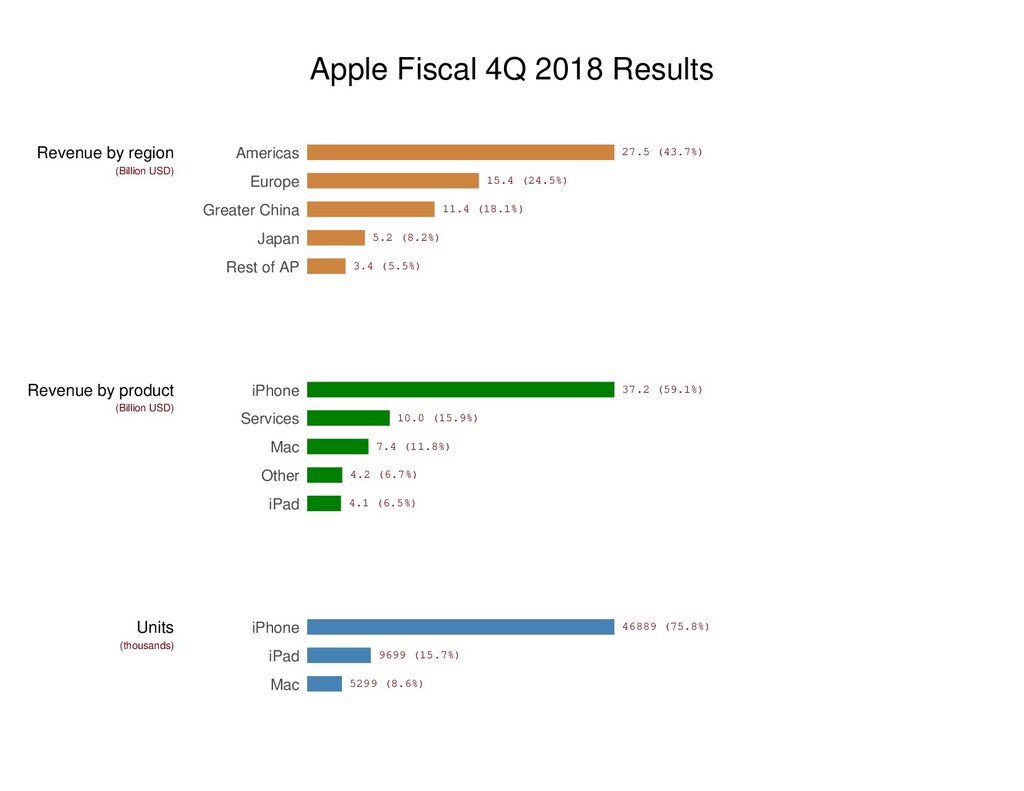
    Revenue by product (Billion USD) Units (thousands) Americas 27.5 (43.7%) Europe 15.4 (24.5%) Greater China 11.4 (18.1%) Japan 5.2 (8.2%) Rest of AP 3.4 (5.5%) iPhone 37.2 (59.1%) Services 10.0 (15.9%) Mac 7.4 (11.8%) Other 4.2 (6.7%) iPad 4.1 (6.5%) iPhone 46889 (75.8%) iPad 9699 (15.7%) Mac 5299 (8.6%)
  3. United States $ 116.18 Billion Colombia $17.10420 India $16.52980 Brazil

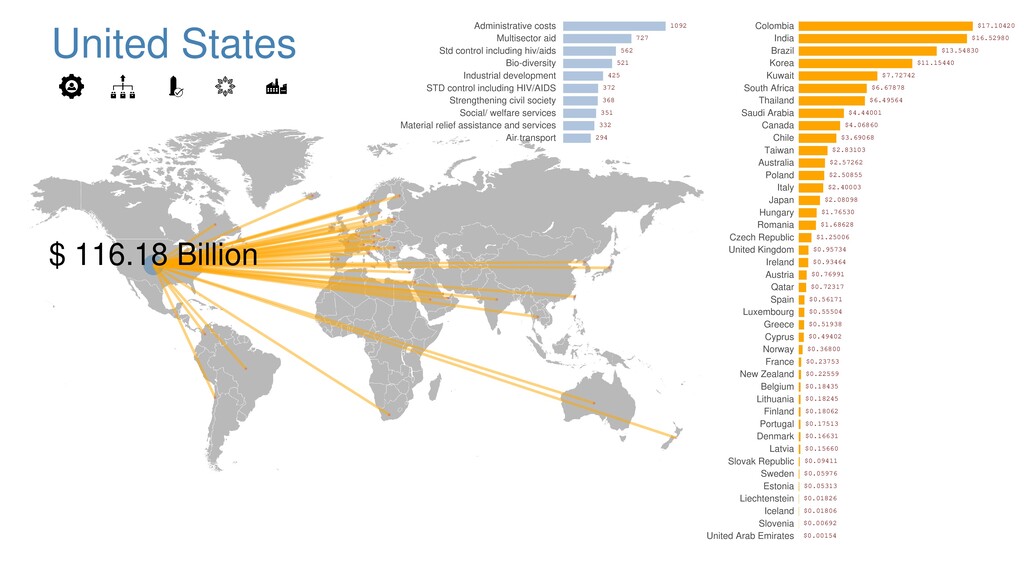
    $13.54830 Korea $11.15440 Kuwait $7.72742 South Africa $6.67878 Thailand $6.49564 Saudi Arabia $4.44001 Canada $4.06860 Chile $3.69068 Taiwan $2.83103 Australia $2.57262 Poland $2.50855 Italy $2.40003 Japan $2.08098 Hungary $1.76530 Romania $1.68628 Czech Republic $1.25006 United Kingdom $0.95734 Ireland $0.93464 Austria $0.76991 Qatar $0.72317 Spain $0.56171 Luxembourg $0.55504 Greece $0.51938 Cyprus $0.49402 Norway $0.36800 France $0.23753 New Zealand $0.22559 Belgium $0.18435 Lithuania $0.18245 Finland $0.18062 Portugal $0.17513 Denmark $0.16631 Latvia $0.15660 Slovak Republic $0.09411 Sweden $0.05976 Estonia $0.05313 Liechtenstein $0.01826 Iceland $0.01806 Slovenia $0.00692 United Arab Emirates $0.00154 Administrative costs 1092 Multisector aid 727 Std control including hiv/aids 562 Bio-diversity 521 Industrial development 425 STD control including HIV/AIDS 372 Strengthening civil society 368 Social/ welfare services 351 Material relief assistance and services 332 Air transport 294
  4. Evolution of Baby Names in the US: 1880-2015 0 25000

    50000 75000 100000 1880 1900 1920 1940 1960 1980 2000 Amanda Ashley Betty Deborah Dorothy Helen Jessica Linda Patricia
  5. Evolution of Baby Names in the US: 1880-2015 Amanda Ashley

    Betty 0 25000 50000 75000 100000 Deborah Dorothy Helen 0 25000 50000 75000 100000 Jessica Linda Patricia 0 25000 50000 75000 100000 1880 1920 1960 2000 1880 1920 1960 2000 1880 1920 1960 2000
  6. Jane Doe Blood Pressure Systolic Diastolic 50 75 100 125

    150 Normal 2018-12-16 2018-12-23 2018-12-30 2019-01-07 2019-01-14 2019-01-23 2019-02-01 2019-02-09 50 75 100 125 150 Normal Heart Rate Beats/Min 40 60 80 100 120 Avg. 2018-12-16 2018-12-23 2018-12-30 2019-01-07 2019-01-14 2019-01-23 2019-02-01 2019-02-09
  7. Bitcoin Closing Price, 2017 0 5000 10000 15000 20000 Jan-01

    Apr-01 Jun-30 Sep-28 Dec-26 Bitcoin Volume (billions), 2017 50 150 250 350
  8. Ranking Fast Food Burgers 140 White Castle 520 Jumbo Jack

    530 Shackburger 540 Big Mac 590 Whataburger 590 Fatburger 660 Whopper 670 Double-Double 670 Famous Star 950 Baconator 990 Five Guys 380 580 1260 940 1220 1190 980 1440 1210 1630 1050 Calories Sodium (mg)
  9. -1.00 -0.50 0.00 0.50 1.00 1880 1900 1920 1940 1960

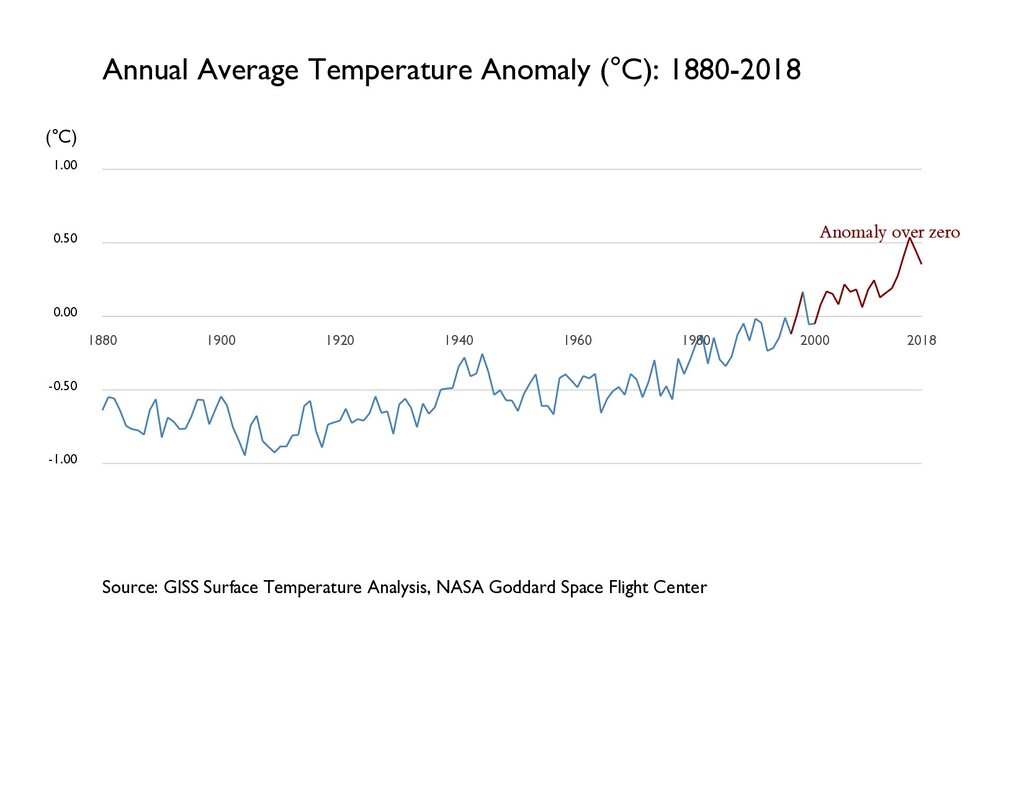
    1980 2000 2018 Annual Average Temperature Anomaly (°C): 1880-2018 (°C) Anomaly over zero Source: GISS Surface Temperature Analysis, NASA Goddard Space Flight Center
  10. Go Package Commits by Hour SVGo 0 20 40 60

    00 02 04 06 08 10 12 14 16 18 20 22 deck 00 02 04 06 08 10 12 14 16 18 20 22 gift 00 02 04 06 08 10 12 14 16 18 20 22 x/mod 0 20 40 60 00 02 04 06 08 10 12 14 16 18 20 22 x/image 00 02 04 06 08 10 12 14 16 18 20 22 x/text 00 02 04 06 08 10 12 14 16 18 20 22
  11. Disney Studio Entertainment: Revenue and Operating Income $6.0B 2001 $6.7B

    2002 $7.4B 2003 $8.7B 2004 $7.6B 2005 $7.5B 2006 $7.5B 2007 $7.3B 2008 $6.1B 2009 $6.7B 2010 $6.4B 2011 $5.8B 2012 $6.0B 2013 $7.3B 2014 $7.4B 2015 $9.4B 2016 $8.4B 2017 $10.0B 2018 0.3 2001 0.3 2002 0.6 2003 0.7 2004 0.2 2005 0.7 2006 1.2 2007 1.1 2008 0.2 2009 0.7 2010 0.6 2011 0.7 2012 0.7 2013 1.5 2014 2.0 2015 2.7 2016 2.4 2017 3.0 2018 Total Revenue Operating Income First Year Owning All Pixar Economics First Year Owning Marvel Studios Paramount- Marvel Distro. Deal Ends First Lucasfilm Release
  12. German Wildfires 2012-2018 2014 saw a record number of fires

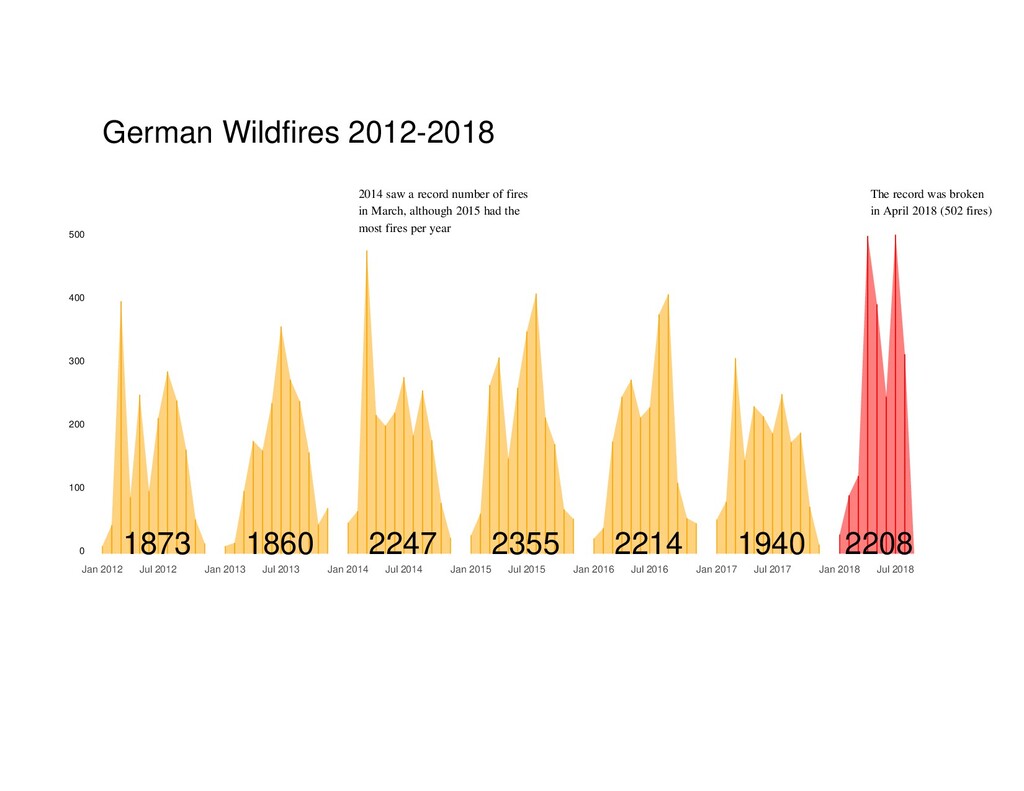
    in March, although 2015 had the most fires per year The record was broken in April 2018 (502 fires) 0 100 200 300 400 500 Jan 2012 Jul 2012 1873 Jan 2013 Jul 2013 1860 Jan 2014 Jul 2014 2247 Jan 2015 Jul 2015 2355 Jan 2016 Jul 2016 2214 Jan 2017 Jul 2017 1940 Jan 2018 Jul 2018 2208
  13. Product Market Share (% of the market) North America Europe

    Latin America Asia ProductD 84 ProductH 36 ProductL 16 ProductD 15 ProductL 14 ProductP 11 ProductC 10 ProductB 4 ProductO 3 ProductJ 2 ProductF 2 ProductQ 1 ProductN 1 ProductI 1 ProductO 24 ProductH 19 ProductD 16 ProductL 14 ProductP 7 ProductI 5 ProductB 5 ProductC 4 ProductJ 3 ProductE 2 ProductF 1 ProductD 41 ProductH 18 ProductO 17 ProductL 10 ProductB 6 ProductP 3 ProductF 3 ProductQ 1 ProductD 33 ProductL 21 ProductO 20 ProductD 20 ProductH 19 ProductO 16 ProductL 14 ProductH 12 ProductB 12 ProductB 9 ProductP 6 ProductP 5 ProductJ 4 ProductM 2 ProductI 2 ProductE 2 ProductC 2 ProductN 1 ProductJ 1 ProductF 1 ProductC 1 JPAC Africa Eurasia China ProductH 28 ProductL 15 ProductO 10 ProductP 9 ProductK 6 ProductE 6 ProductD 6 ProductJ 5 ProductB 5 ProductG 3 ProductI 2 ProductF 2 ProductA 2 ProductM 1 ProductC 1 ProductD 33 ProductB 16 ProductH 13 ProductO 12 ProductP 8 ProductL 7 ProductC 5 ProductJ 3 ProductQ 2 ProductI 1 ProductD 33 ProductO 16 ProductL 14 ProductH 12 ProductB 12 ProductP 6 ProductJ 4 ProductI 2 ProductC 2 ProductD 84 ProductL 16
  14. A record 64 million Americans live in multigenerational households The

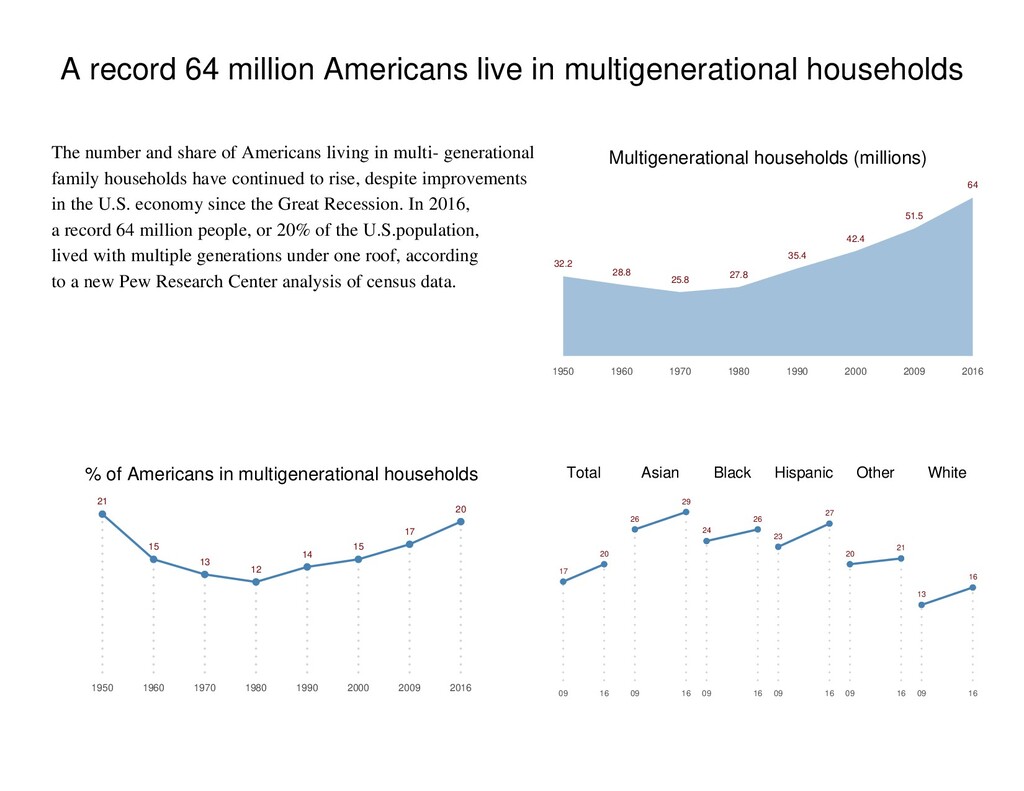
    number and share of Americans living in multi- generational family households have continued to rise, despite improvements in the U.S. economy since the Great Recession. In 2016, a record 64 million people, or 20% of the U.S.population, lived with multiple generations under one roof, according to a new Pew Research Center analysis of census data. Multigenerational households (millions) 32.2 1950 28.8 1960 25.8 1970 27.8 1980 35.4 1990 42.4 2000 51.5 2009 64 2016 % of Americans in multigenerational households 21 1950 15 1960 13 1970 12 1980 14 1990 15 2000 17 2009 20 2016 Total 17 09 20 16 Asian 26 09 29 16 Black 24 09 26 16 Hispanic 23 09 27 16 Other 20 09 21 16 White 13 09 16 16
  15. 0 400000 800000 1200000 1600000 1981 1985 1989 1993 1997

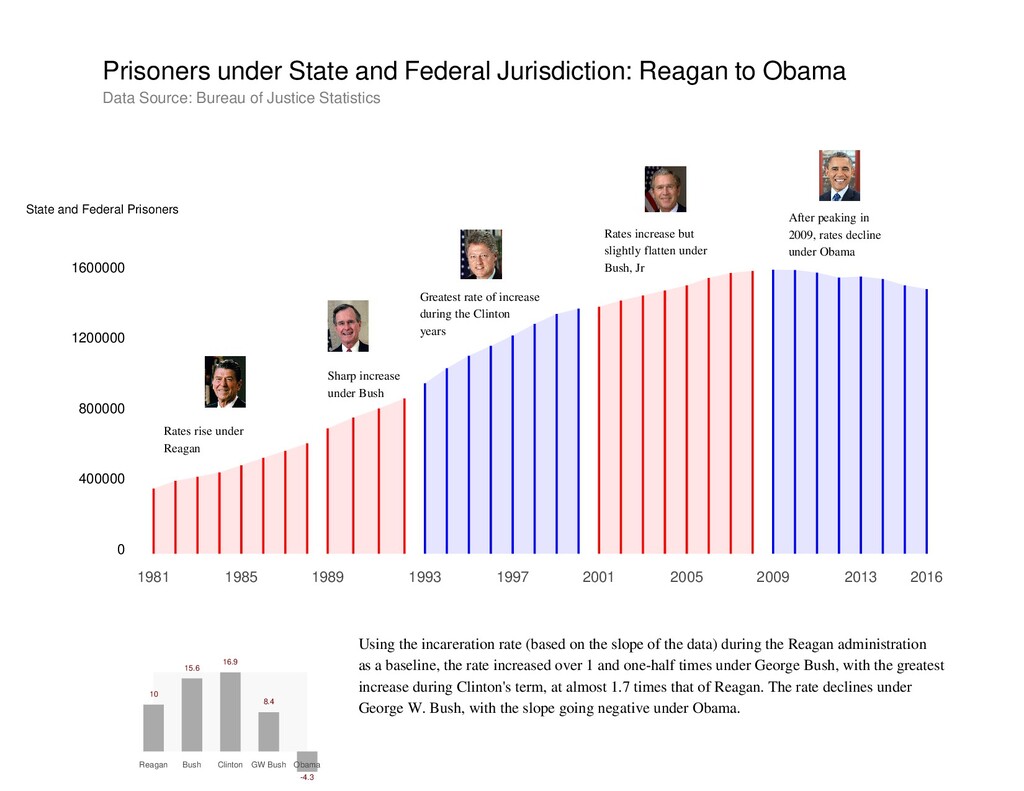
    2001 2005 2009 2013 2016 Prisoners under State and Federal Jurisdiction: Reagan to Obama Data Source: Bureau of Justice Statistics State and Federal Prisoners Rates rise under Reagan Sharp increase under Bush Greatest rate of increase during the Clinton years Rates increase but slightly flatten under Bush, Jr After peaking in 2009, rates decline under Obama 10 Reagan 15.6 Bush 16.9 Clinton 8.4 GW Bush -4.3 Obama Using the incareration rate (based on the slope of the data) during the Reagan administration as a baseline, the rate increased over 1 and one-half times under George Bush, with the greatest increase during Clinton's term, at almost 1.7 times that of Reagan. The rate declines under George W. Bush, with the slope going negative under Obama.
  16. OVERVIEW OF SANOFI IN 2018 Sales 0 10 20 30

    40 38.809 2016 35.072 2017 34.463 2018 Income 0 2 4 6 8 7.308 2016 6.943 2017 6.819 2018 Debt 0 5 10 15 20 8.234 2016 5.161 2017 17.628 2018 Earnings per share 0 2 4 6 5.68 2016 5.52 2017 5.47 2018 Debt per share 0 1 2 3 2.96 2016 3.03 2017 3.07 2018
  17. Indy 500 Fastest Lap (mph) 120 160 200 240 1950

    1960 1970 1980 1990 2000 2010 2018 Indy 500 Fastest Lap (sec) 30 40 50 60 70 1950 1960 1970 1980 1990 2000 2010 2018
  18. Succession US Viewers (millions) One million viewers Source: Wikipedia: Succession

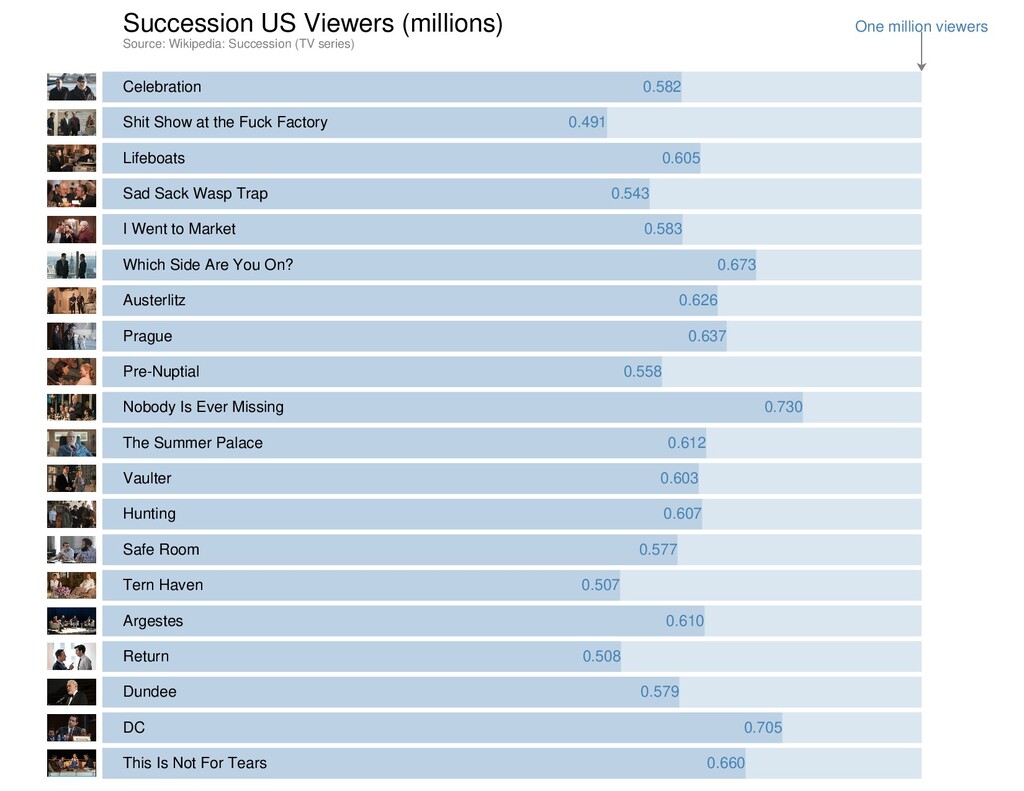
    (TV series) 0.582 Celebration 0.491 Shit Show at the Fuck Factory 0.605 Lifeboats 0.543 Sad Sack Wasp Trap 0.583 I Went to Market 0.673 Which Side Are You On? 0.626 Austerlitz 0.637 Prague 0.558 Pre-Nuptial 0.730 Nobody Is Ever Missing 0.612 The Summer Palace 0.603 Vaulter 0.607 Hunting 0.577 Safe Room 0.507 Tern Haven 0.610 Argestes 0.508 Return 0.579 Dundee 0.705 DC 0.660 This Is Not For Tears
  19. How much of your life the U.S. has been at

    war Source: Washington Post: https://twitter.com/ianbremmer/status/1215389030013132800 birthdate % war 1905 34.8% 1906 35.1% 1907 35.4% 1908 35.7% 1909 36.0% 1910 36.4% 1911 36.7% 1912 37.0% 1913 37.4% 1914 37.7% 1915 38.1% 1916 38.5% 1917 38.8% 1918 38.2% 1919 37.6% 1920 38.0% 1921 38.4% 1922 38.8% 1923 39.2% 1924 39.6% 1925 40.0% 1926 40.4% 1927 40.9% 1928 41.3% 1929 41.8% 1930 42.2% 1931 42.7% 1932 43.2% 1933 43.7% 1934 44.2% 1935 44.7% 1936 45.2% 1937 45.8% 1938 46.3% 1939 46.9% 1940 47.5% 1941 48.1% 1942 47.4% 1943 46.8% 1944 46.1% 1945 45.3% 1946 44.6% 1947 45.2% 1948 45.8% 1949 46.5% 1950 47.1% 1951 46.4% 1952 45.6% 1953 44.8% 1954 43.9% 1955 44.6% 1956 45.3% 1957 46.0% 1958 46.8% 1959 47.5% 1960 48.3% 1961 49.2% 1962 50.0% 1963 50.9% 1964 51.8% 1965 52.7% 1966 51.9% 1967 50.9% 1968 50.0% 1969 49.0% 1970 48.0% 1971 46.9% 1972 45.8% 1973 44.7% 1974 43.5% 1975 44.4% 1976 45.5% 1977 46.5% 1978 47.6% 1979 48.8% 1980 50.0% 1981 51.3% 1982 52.6% 1983 54.1% 1984 55.6% 1985 57.1% 1986 58.8% 1987 60.6% 1988 62.5% 1989 64.5% 1990 66.7% 1991 69.0% 1992 67.9% 1993 70.4% 1994 73.1% 1995 76.0% 1996 79.2% 1997 82.6% 1998 86.4% 1999 90.5% 2001 100.0% 2002 100.0% 2003 100.0% 2004 100.0% 2005 100.0% 2006 100.0% 2007 100.0% 2008 100.0% 2009 100.0% 2010 100.0% 2011 100.0% 2012 100.0% 2013 100.0% 2014 100.0% 2015 100.0% 2016 100.0% 2017 100.0% 2018 100.0% 2019 100.0%
  20. Average High/Low Temperatures (°F) Avg. High Avg. Low Fairbanks -25

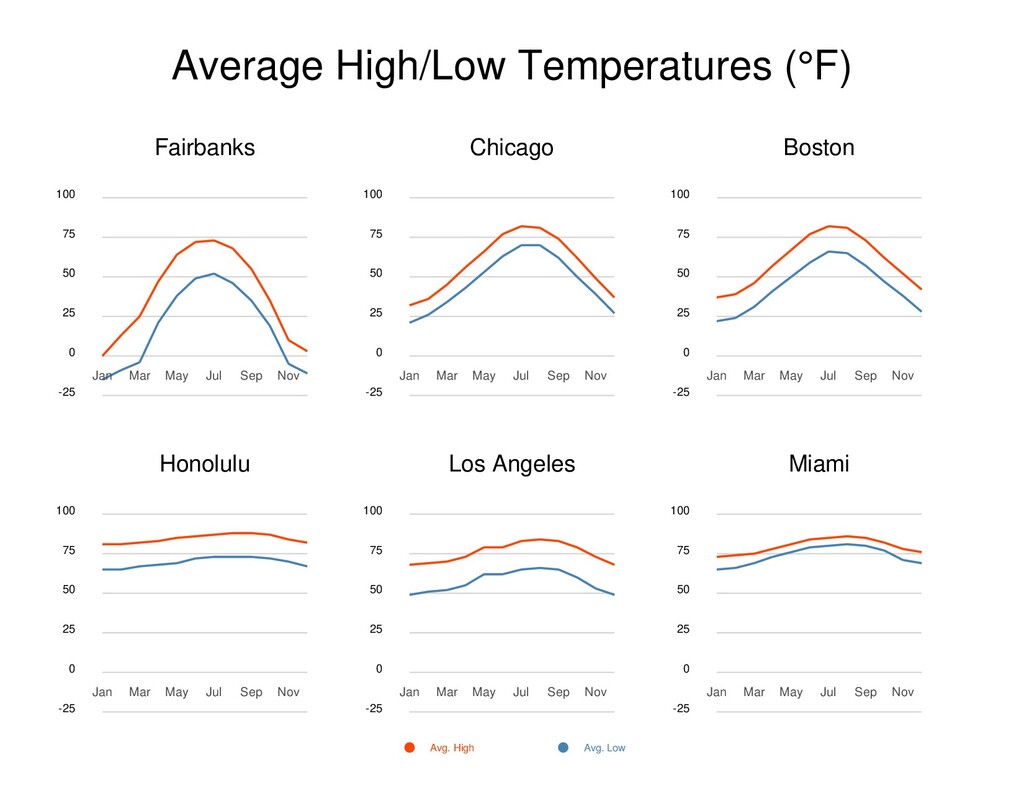
    0 25 50 75 100 Jan Mar May Jul Sep Nov Chicago -25 0 25 50 75 100 Jan Mar May Jul Sep Nov Boston -25 0 25 50 75 100 Jan Mar May Jul Sep Nov Honolulu -25 0 25 50 75 100 Jan Mar May Jul Sep Nov Los Angeles -25 0 25 50 75 100 Jan Mar May Jul Sep Nov Miami -25 0 25 50 75 100 Jan Mar May Jul Sep Nov