video prompt will be posted by 8AM on November 30th What’s coming up? When’s it due? This week’s lectures [no lab] Data analysis using Google Earth Engine December 4th by 5pm (hard deadline) It isn’t due at all Wednesday’s lecture: some examples of using Google Earth Engine ALL OUTSTANDING ASSIGNMENTS ARE DUE BY NOVEMBER 30TH Note that this week’s material will NOT be part of the final project! It’s just fun and useful.
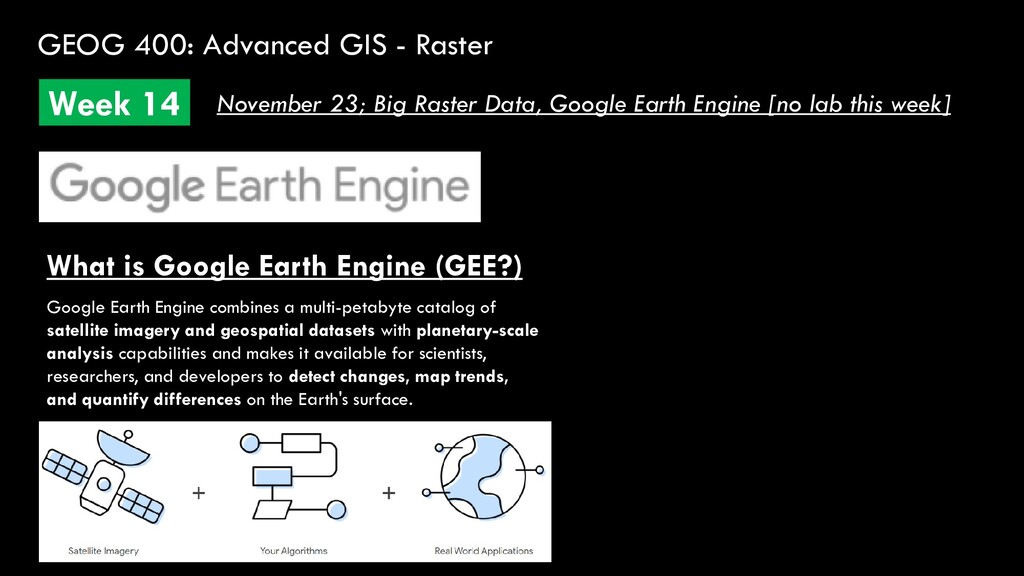
Big Raster Data, Google Earth Engine [no lab this week] What is Google Earth Engine (GEE?) Google Earth Engine combines a multi-petabyte catalog of satellite imagery and geospatial datasets with planetary-scale analysis capabilities and makes it available for scientists, researchers, and developers to detect changes, map trends, and quantify differences on the Earth's surface.
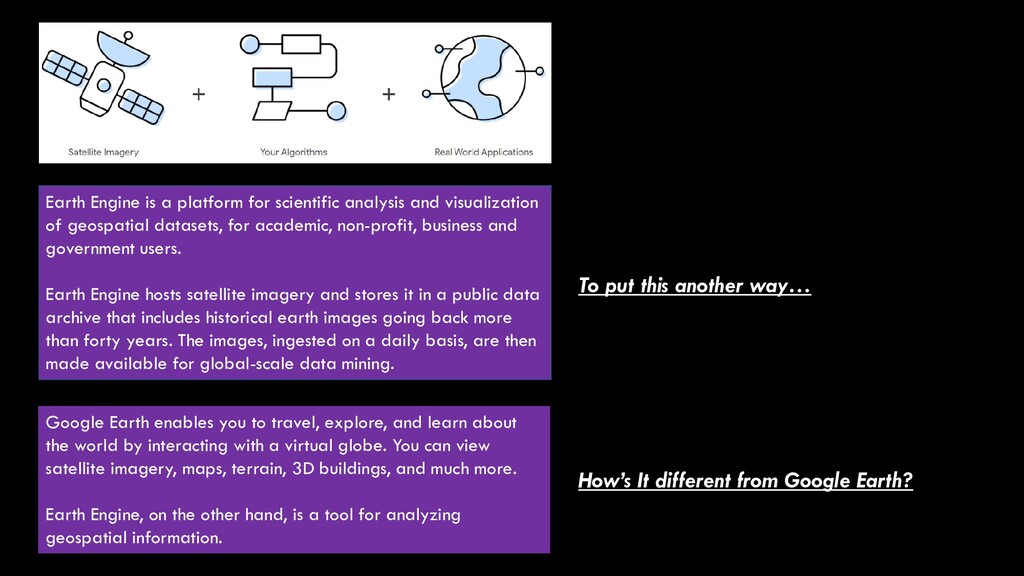
of geospatial datasets, for academic, non-profit, business and government users. Earth Engine hosts satellite imagery and stores it in a public data archive that includes historical earth images going back more than forty years. The images, ingested on a daily basis, are then made available for global-scale data mining. Google Earth enables you to travel, explore, and learn about the world by interacting with a virtual globe. You can view satellite imagery, maps, terrain, 3D buildings, and much more. Earth Engine, on the other hand, is a tool for analyzing geospatial information. To put this another way… How’s It different from Google Earth?
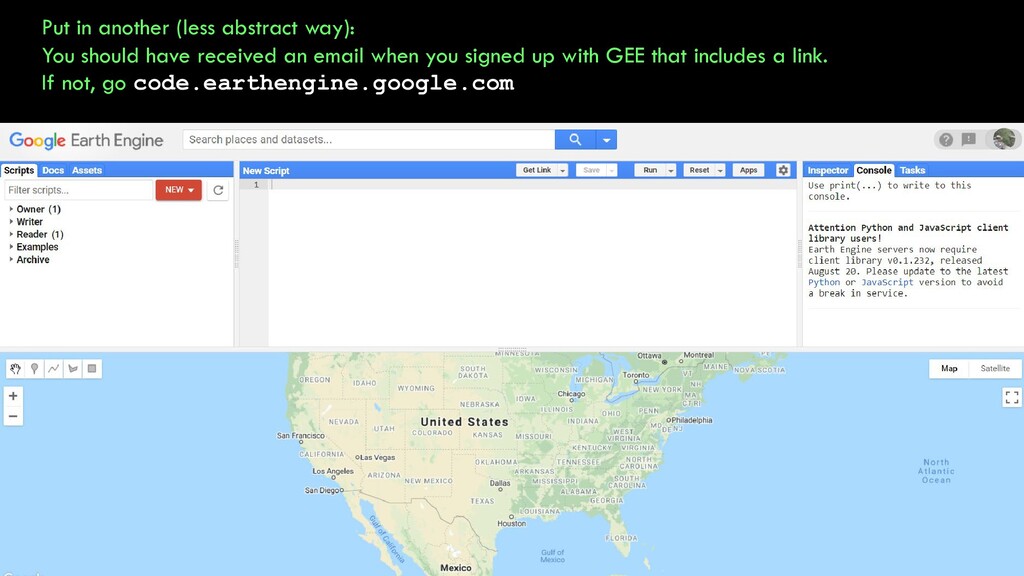
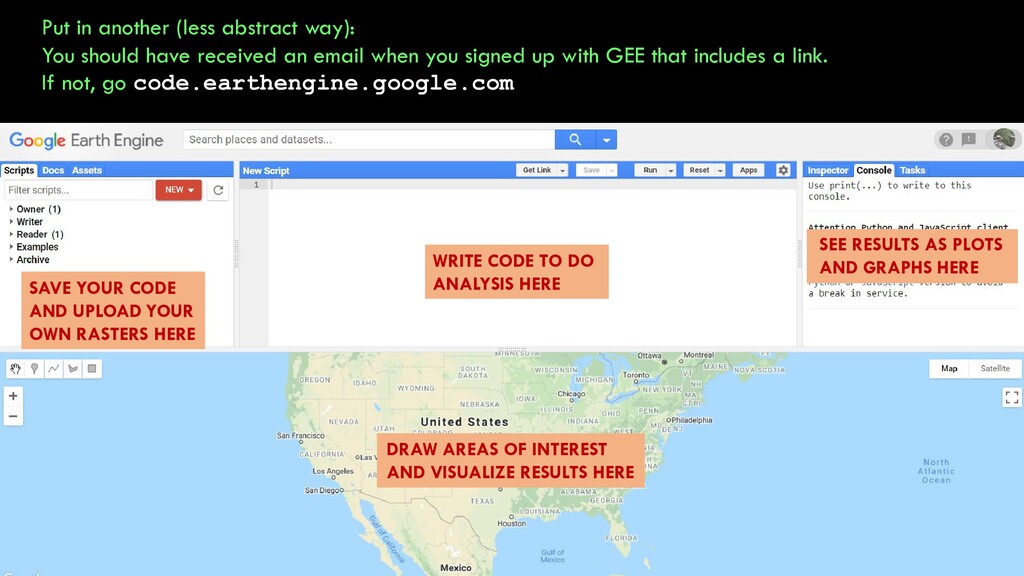
an email when you signed up with GEE that includes a link. If not, go code.earthengine.google.com DRAW AREAS OF INTEREST AND VISUALIZE RESULTS HERE WRITE CODE TO DO ANALYSIS HERE SAVE YOUR CODE AND UPLOAD YOUR OWN RASTERS HERE SEE RESULTS AS PLOTS AND GRAPHS HERE
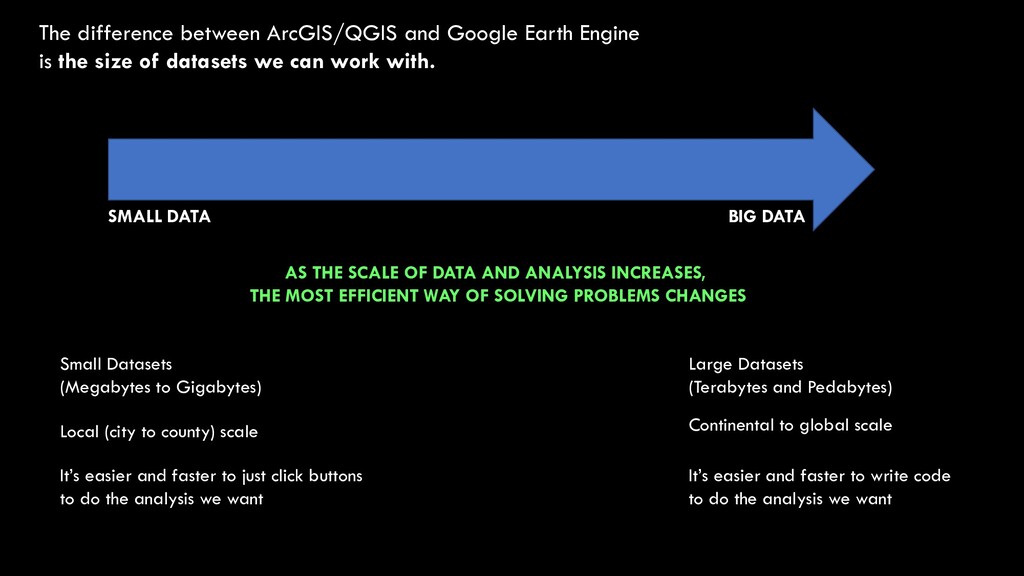
size of datasets we can work with. Small Datasets (Megabytes to Gigabytes) Large Datasets (Terabytes and Pedabytes) Local (city to county) scale Continental to global scale It’s easier and faster to just click buttons to do the analysis we want It’s easier and faster to write code to do the analysis we want SMALL DATA BIG DATA AS THE SCALE OF DATA AND ANALYSIS INCREASES, THE MOST EFFICIENT WAY OF SOLVING PROBLEMS CHANGES
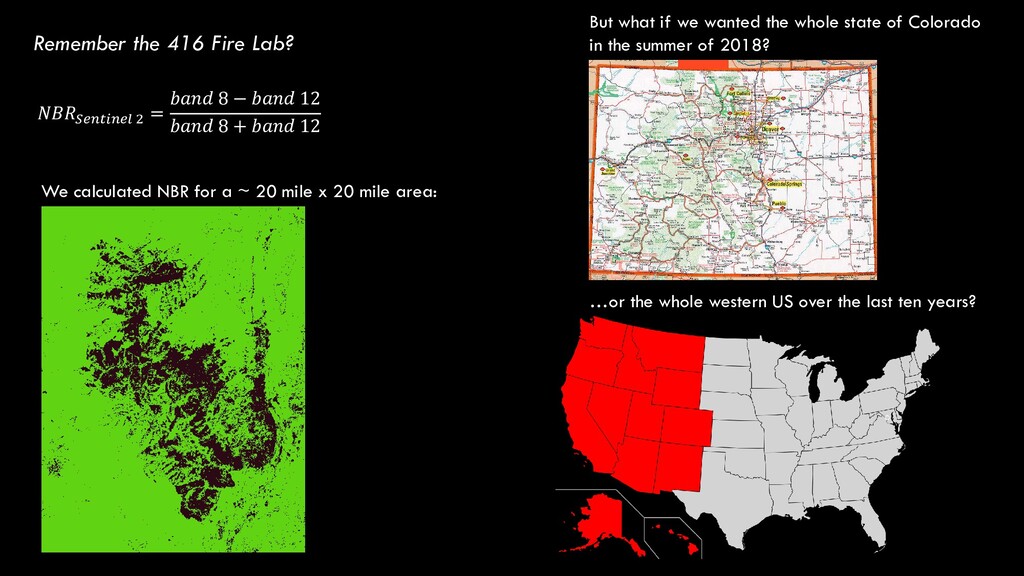
8 + 12 We calculated NBR for a ~ 20 mile x 20 mile area: But what if we wanted the whole state of Colorado in the summer of 2018? …or the whole western US over the last ten years?
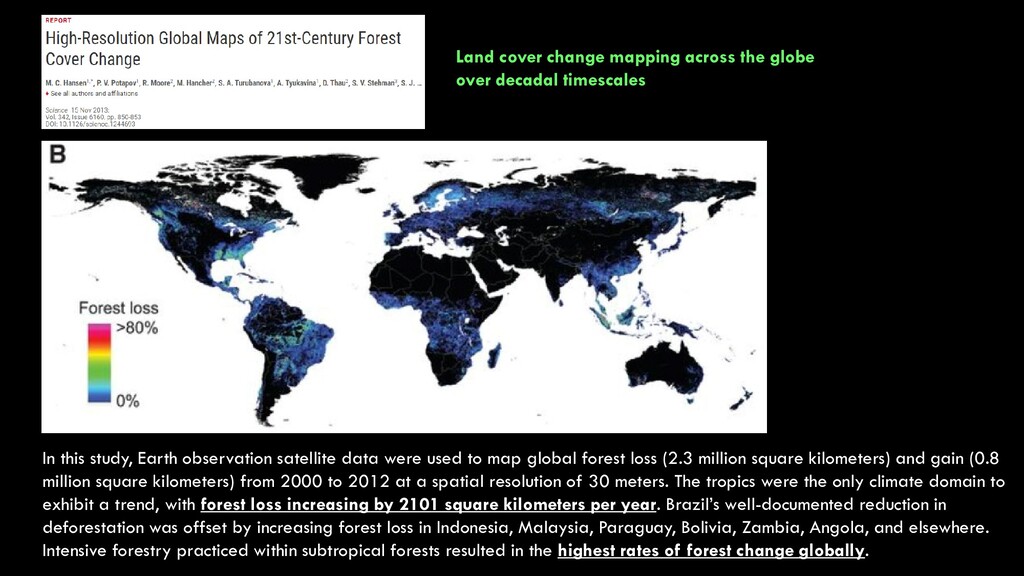
map global forest loss (2.3 million square kilometers) and gain (0.8 million square kilometers) from 2000 to 2012 at a spatial resolution of 30 meters. The tropics were the only climate domain to exhibit a trend, with forest loss increasing by 2101 square kilometers per year. Brazil’s well-documented reduction in deforestation was offset by increasing forest loss in Indonesia, Malaysia, Paraguay, Bolivia, Zambia, Angola, and elsewhere. Intensive forestry practiced within subtropical forests resulted in the highest rates of forest change globally. Land cover change mapping across the globe over decadal timescales
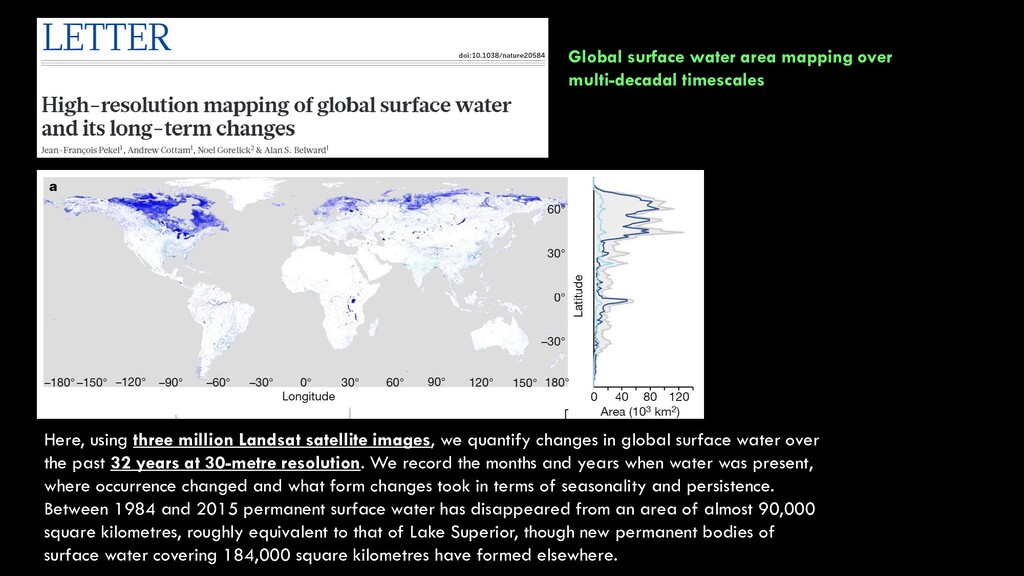
in global surface water over the past 32 years at 30-metre resolution. We record the months and years when water was present, where occurrence changed and what form changes took in terms of seasonality and persistence. Between 1984 and 2015 permanent surface water has disappeared from an area of almost 90,000 square kilometres, roughly equivalent to that of Lake Superior, though new permanent bodies of surface water covering 184,000 square kilometres have formed elsewhere. Global surface water area mapping over multi-decadal timescales
navigating Google Earth Engine - Follow along and make sure you can complete the same steps! For Wednesday’s lecture: - I’ll demonstrate some example big-scale data analysis steps - I’ll share the code I used to do these on Canvas so you can build on it for future projects