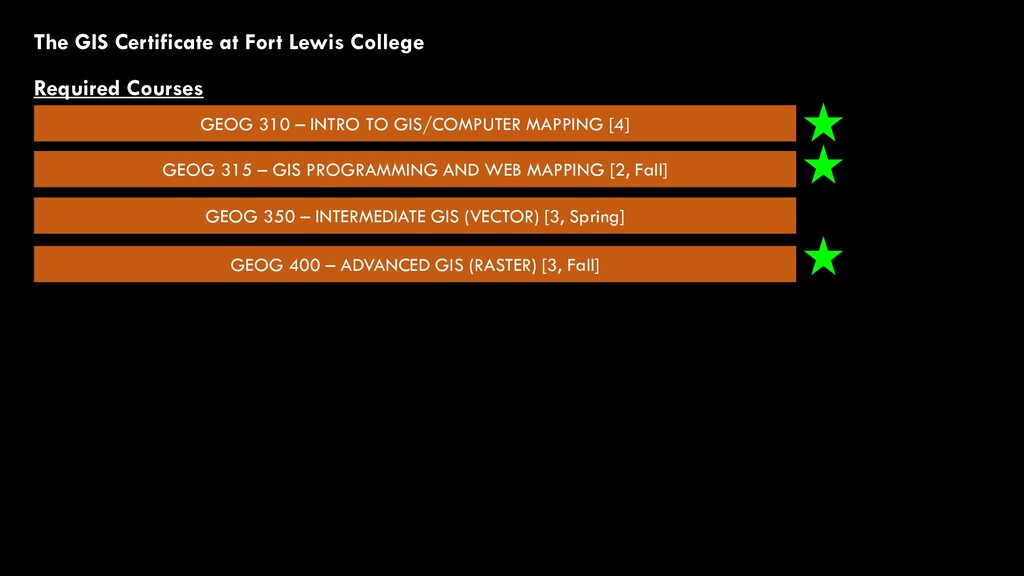
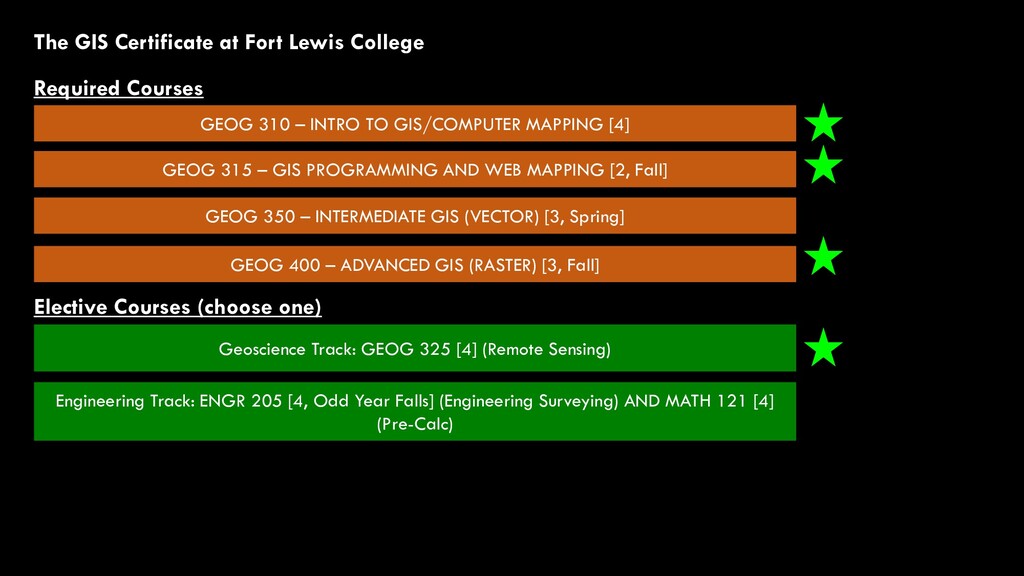
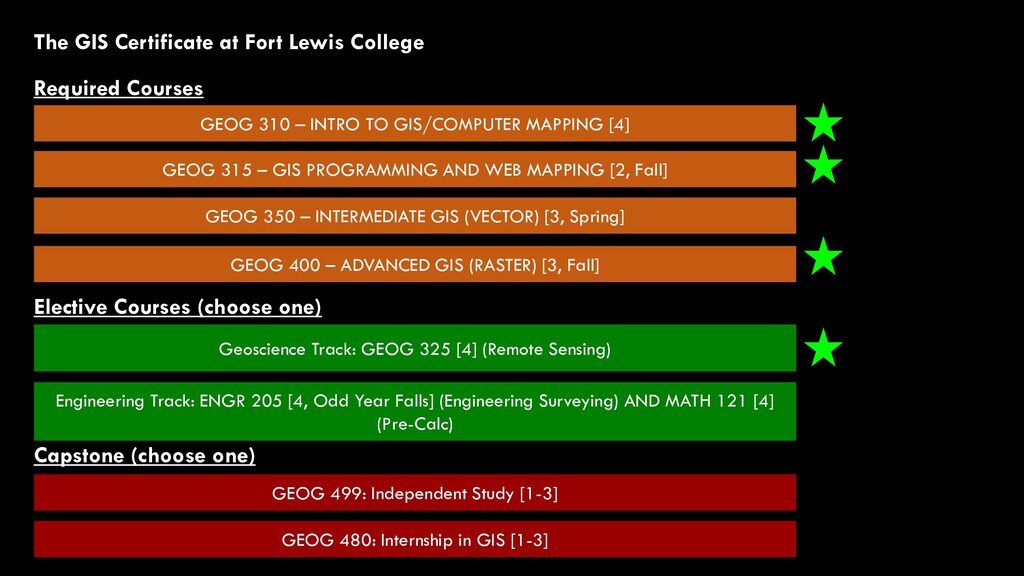
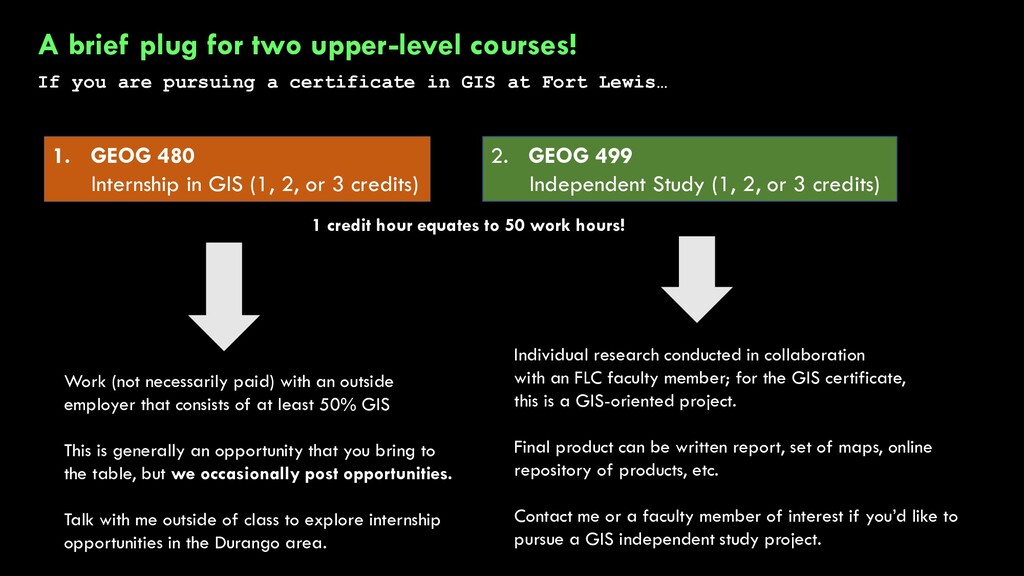
pursuing a certificate in GIS at Fort Lewis… 1. GEOG 480 Internship in GIS (1, 2, or 3 credits) 2. GEOG 499 Independent Study (1, 2, or 3 credits) 1 credit hour equates to 50 work hours! Work (not necessarily paid) with an outside employer that consists of at least 50% GIS This is generally an opportunity that you bring to the table, but we occasionally post opportunities. Talk with me outside of class to explore internship opportunities in the Durango area. Individual research conducted in collaboration with an FLC faculty member; for the GIS certificate, this is a GIS-oriented project. Final product can be written report, set of maps, online repository of products, etc. Contact me or a faculty member of interest if you’d like to pursue a GIS independent study project.
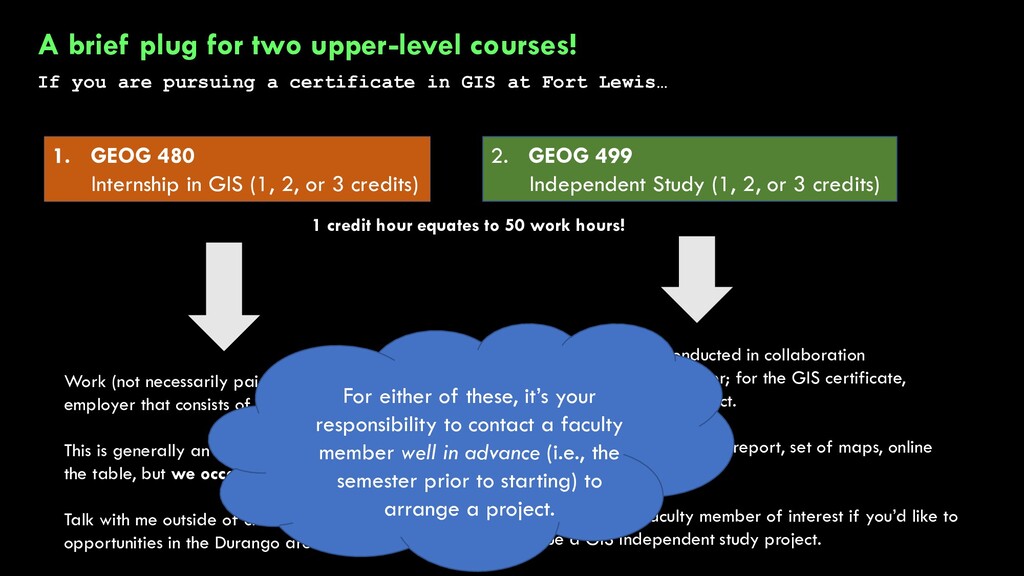
pursuing a certificate in GIS at Fort Lewis… 1. GEOG 480 Internship in GIS (1, 2, or 3 credits) 2. GEOG 499 Independent Study (1, 2, or 3 credits) 1 credit hour equates to 50 work hours! Work (not necessarily paid) with an outside employer that consists of at least 50% GIS This is generally an opportunity that you bring to the table, but we occasionally post opportunities. Talk with me outside of class to explore internship opportunities in the Durango area. Individual research conducted in collaboration with an FLC faculty member; for the GIS certificate, this is a GIS-oriented project. Final product can be written report, set of maps, online repository of products, etc. Contact me or a faculty member of interest if you’d like to pursue a GIS independent study project. For either of these, it’s your responsibility to contact a faculty member well in advance (i.e., the semester prior to starting) to arrange a project.
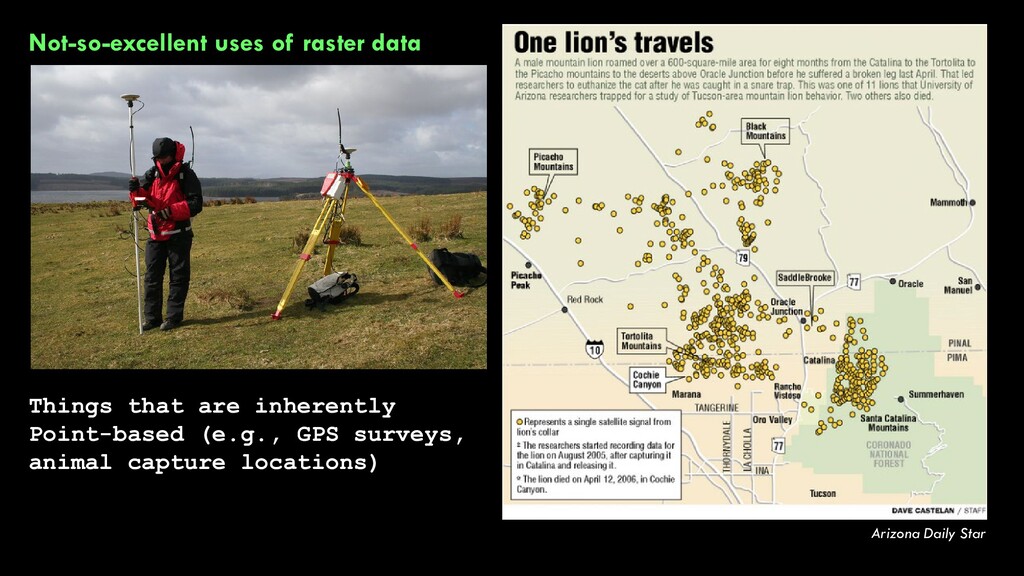
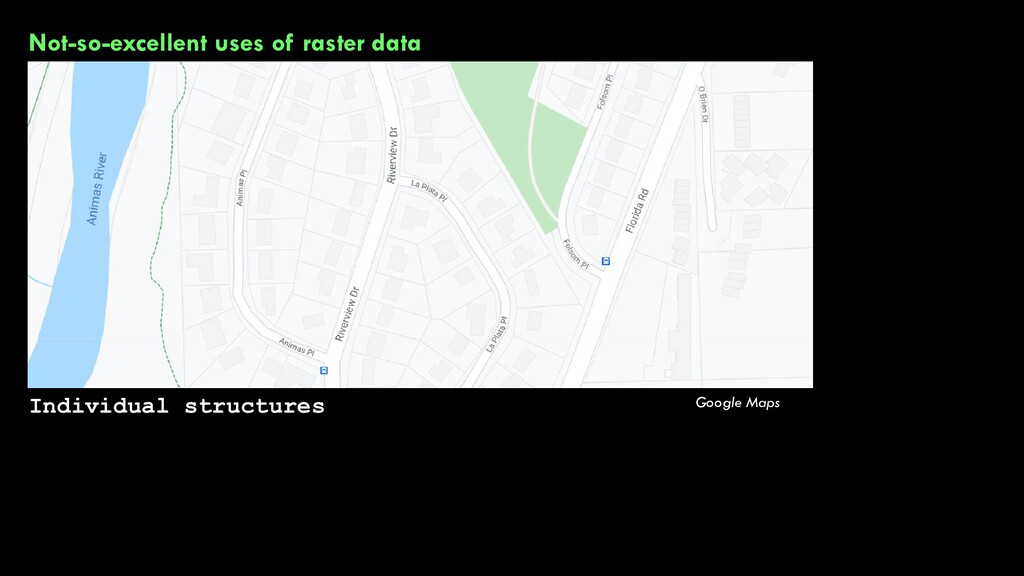
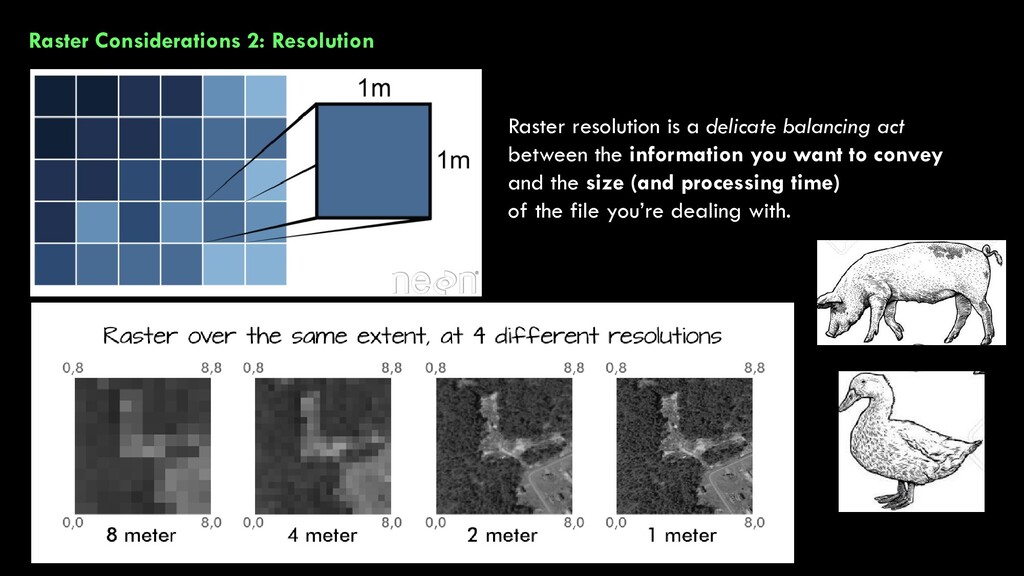
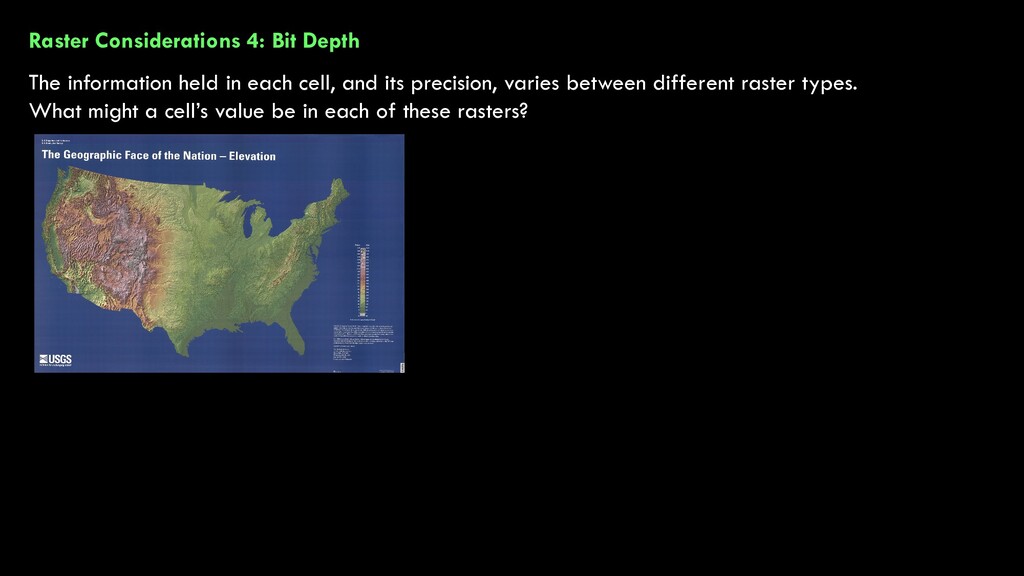
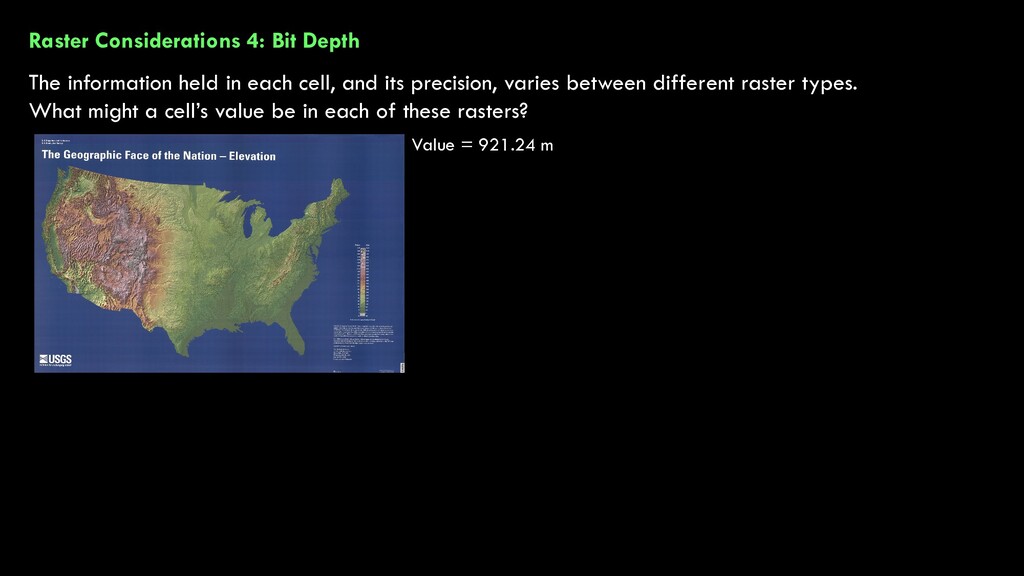
A quick review of GIS data models A short discussion about vector data A much longer introduction to raster data Things to think about when dealing with rasters: • Format • Resolution • Data Type • Bit Depth
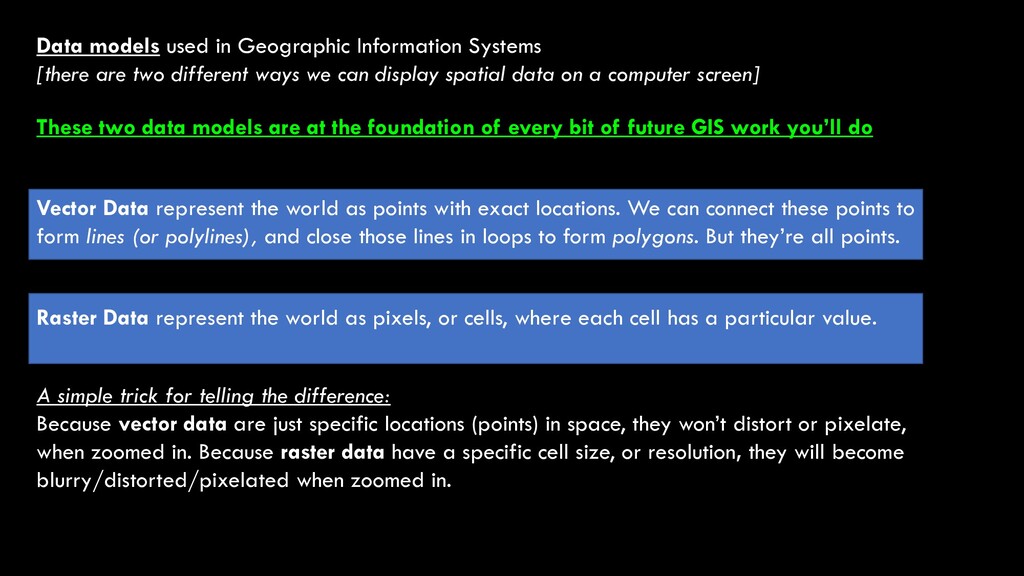
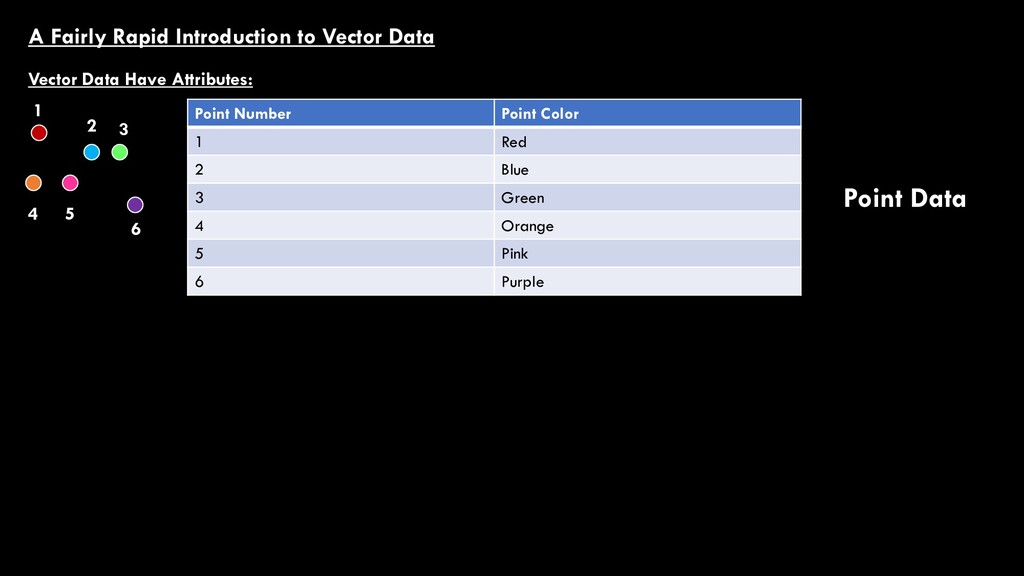
different ways we can display spatial data on a computer screen] These two data models are at the foundation of every bit of future GIS work you’ll do Vector Data represent the world as points with exact locations. We can connect these points to form lines (or polylines), and close those lines in loops to form polygons. But they’re all points. Raster Data represent the world as pixels, or cells, where each cell has a particular value. A simple trick for telling the difference: Because vector data are just specific locations (points) in space, they won’t distort or pixelate, when zoomed in. Because raster data have a specific cell size, or resolution, they will become blurry/distorted/pixelated when zoomed in.
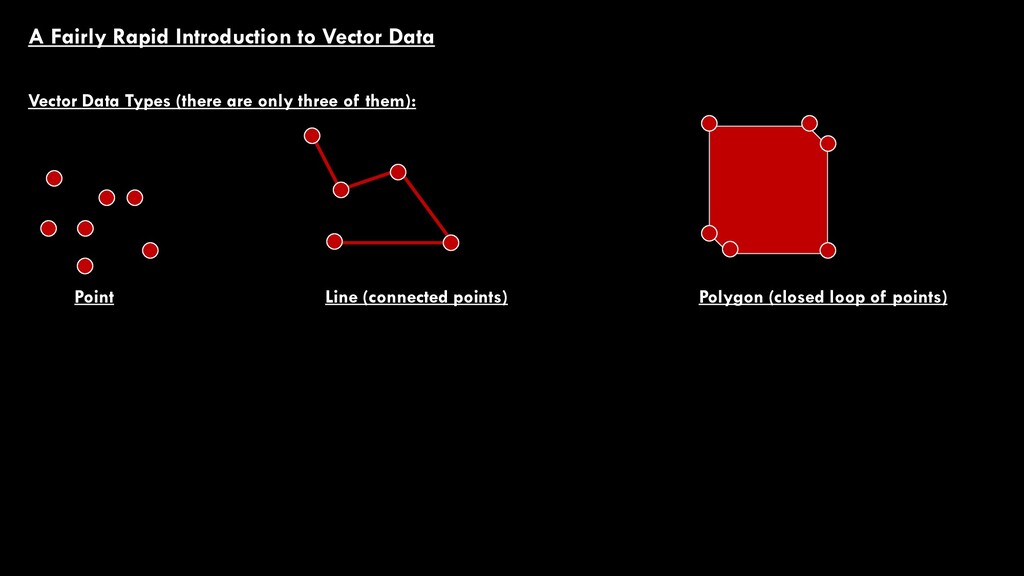
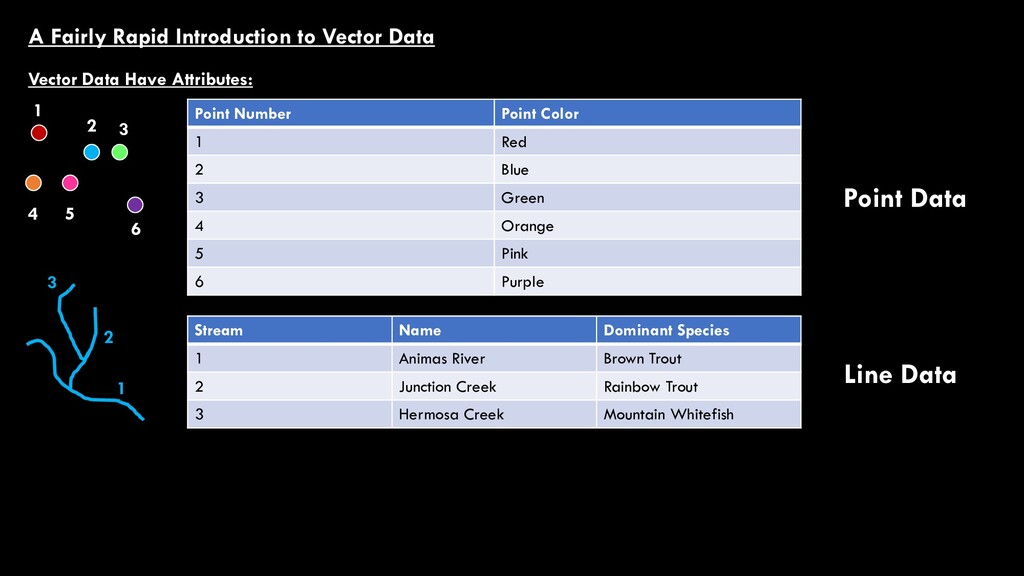
1 Red 2 Blue 3 Green 4 Orange 5 Pink 6 Purple Vector Data Have Attributes: Stream Name Dominant Species 1 Animas River Brown Trout 2 Junction Creek Rainbow Trout 3 Hermosa Creek Mountain Whitefish 1 2 3 Point Data Line Data A Fairly Rapid Introduction to Vector Data
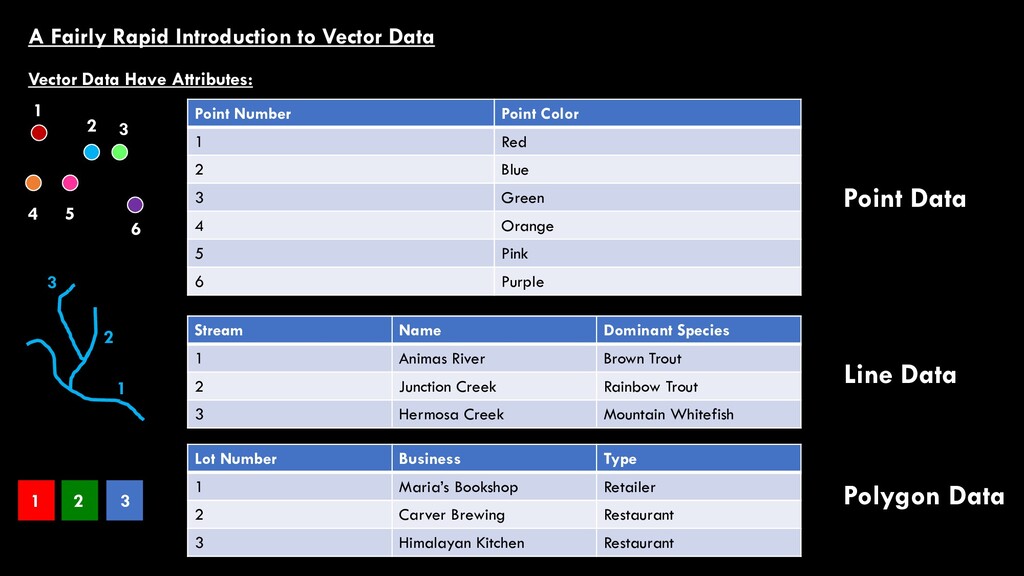
1 Red 2 Blue 3 Green 4 Orange 5 Pink 6 Purple Vector Data Have Attributes: Stream Name Dominant Species 1 Animas River Brown Trout 2 Junction Creek Rainbow Trout 3 Hermosa Creek Mountain Whitefish 1 2 3 Lot Number Business Type 1 Maria’s Bookshop Retailer 2 Carver Brewing Restaurant 3 Himalayan Kitchen Restaurant 1 2 3 Point Data Line Data Polygon Data A Fairly Rapid Introduction to Vector Data
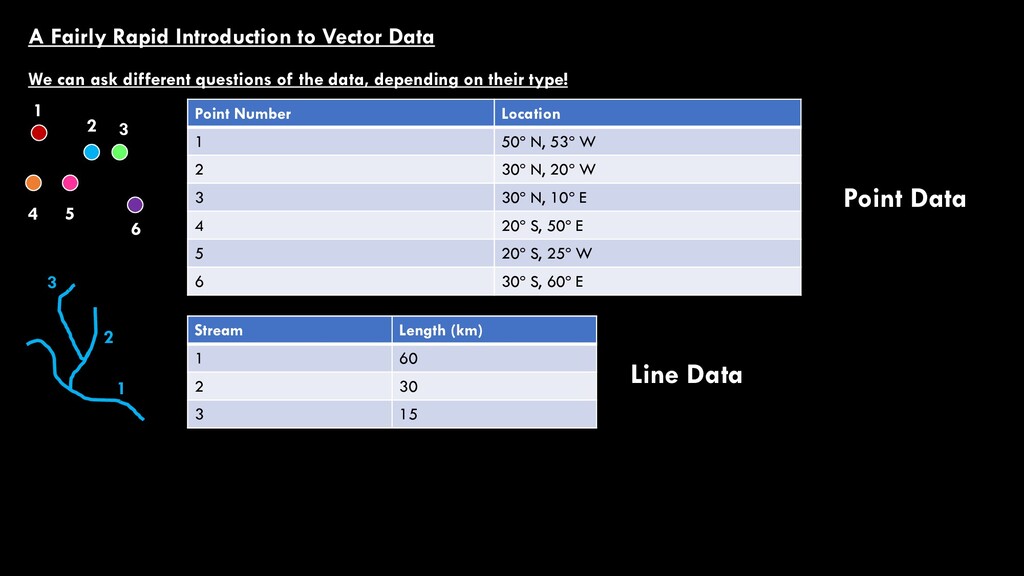
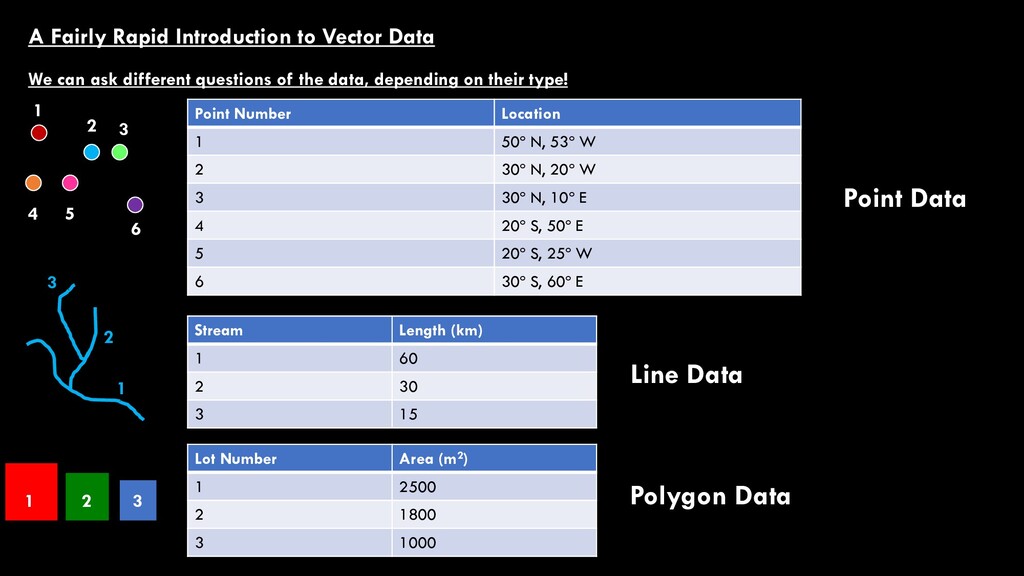
50º N, 53º W 2 30º N, 20º W 3 30º N, 10º E 4 20º S, 50º E 5 20º S, 25º W 6 30º S, 60º E Stream Length (km) 1 60 2 30 3 15 1 2 3 Point Data Line Data We can ask different questions of the data, depending on their type! A Fairly Rapid Introduction to Vector Data
50º N, 53º W 2 30º N, 20º W 3 30º N, 10º E 4 20º S, 50º E 5 20º S, 25º W 6 30º S, 60º E Stream Length (km) 1 60 2 30 3 15 1 2 3 Lot Number Area (m2) 1 2500 2 1800 3 1000 1 2 3 Point Data Line Data Polygon Data We can ask different questions of the data, depending on their type! A Fairly Rapid Introduction to Vector Data
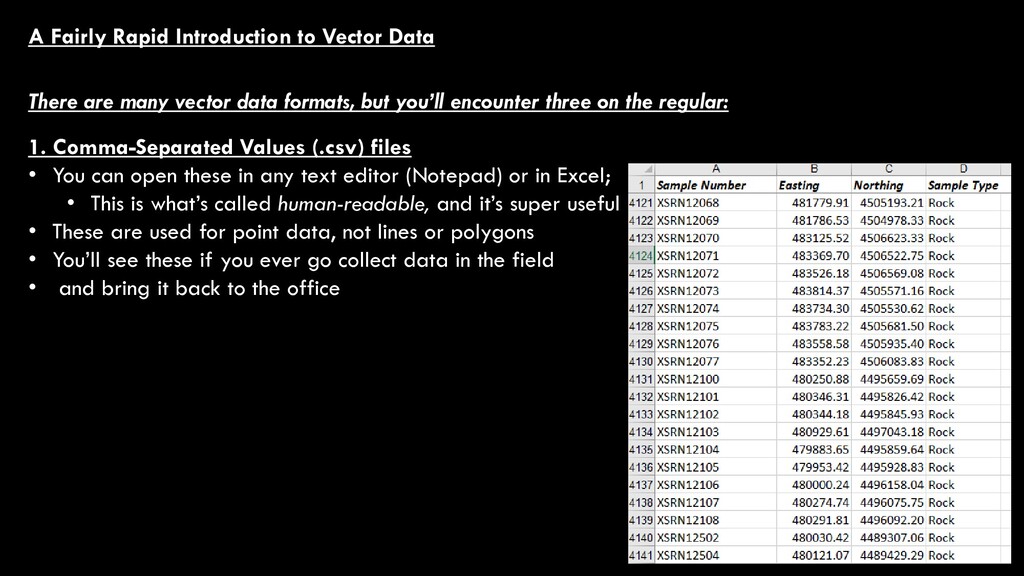
vector data formats, but you’ll encounter three on the regular: 1. Comma-Separated Values (.csv) files • You can open these in any text editor (Notepad) or in Excel; • This is what’s called human-readable, and it’s super useful • These are used for point data, not lines or polygons • You’ll see these if you ever go collect data in the field • and bring it back to the office
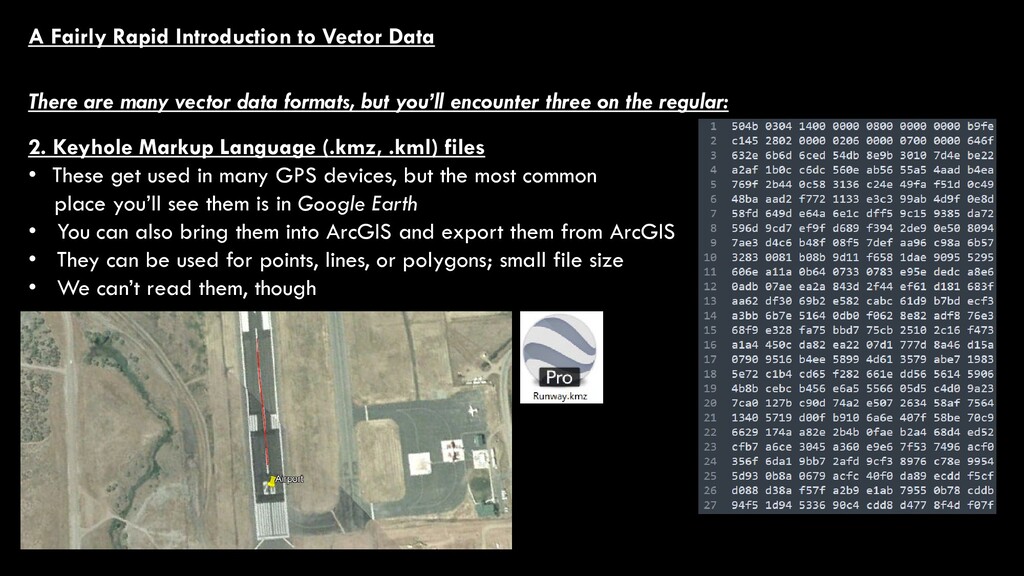
vector data formats, but you’ll encounter three on the regular: 2. Keyhole Markup Language (.kmz, .kml) files • These get used in many GPS devices, but the most common place you’ll see them is in Google Earth • You can also bring them into ArcGIS and export them from ArcGIS • They can be used for points, lines, or polygons; small file size • We can’t read them, though
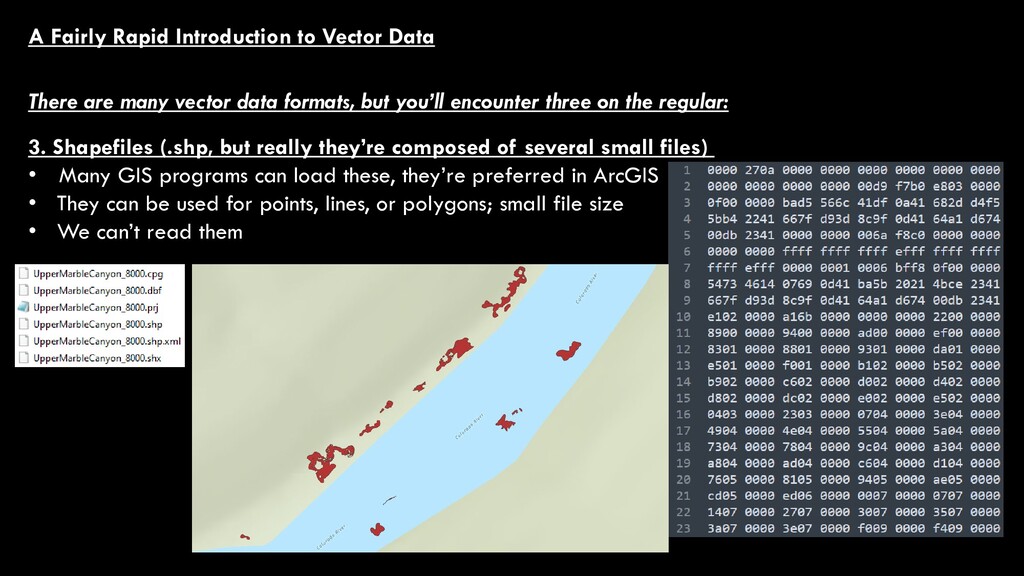
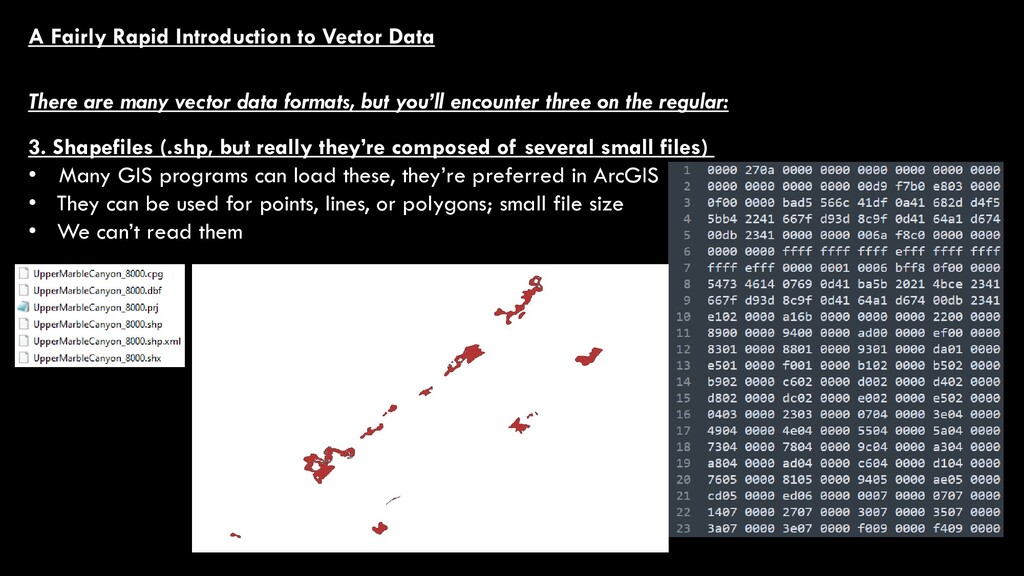
vector data formats, but you’ll encounter three on the regular: 3. Shapefiles (.shp, but really they’re composed of several small files) • Many GIS programs can load these, they’re preferred in ArcGIS • They can be used for points, lines, or polygons; small file size • We can’t read them
vector data formats, but you’ll encounter three on the regular: 3. Shapefiles (.shp, but really they’re composed of several small files) • Many GIS programs can load these, they’re preferred in ArcGIS • They can be used for points, lines, or polygons; small file size • We can’t read them
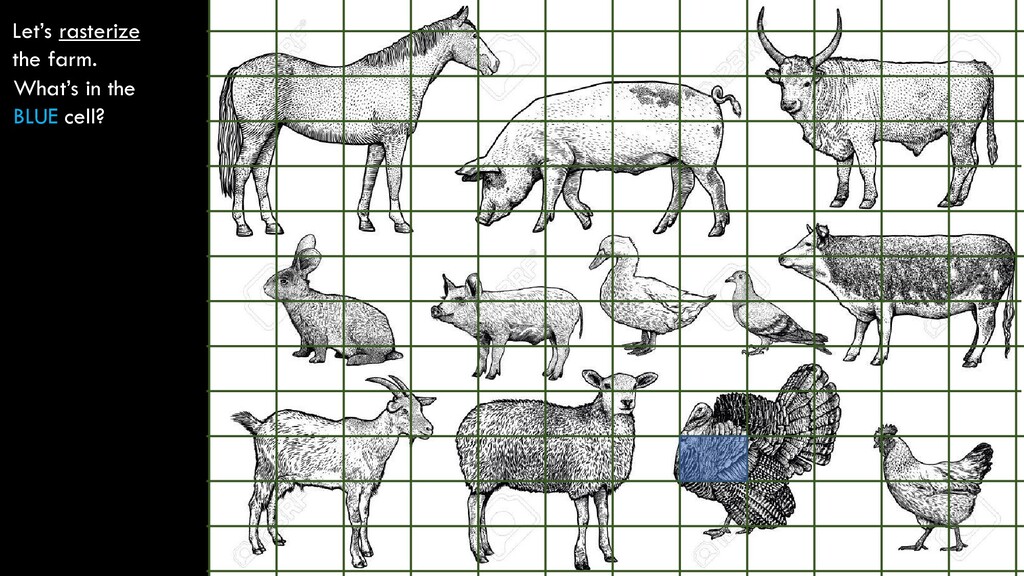
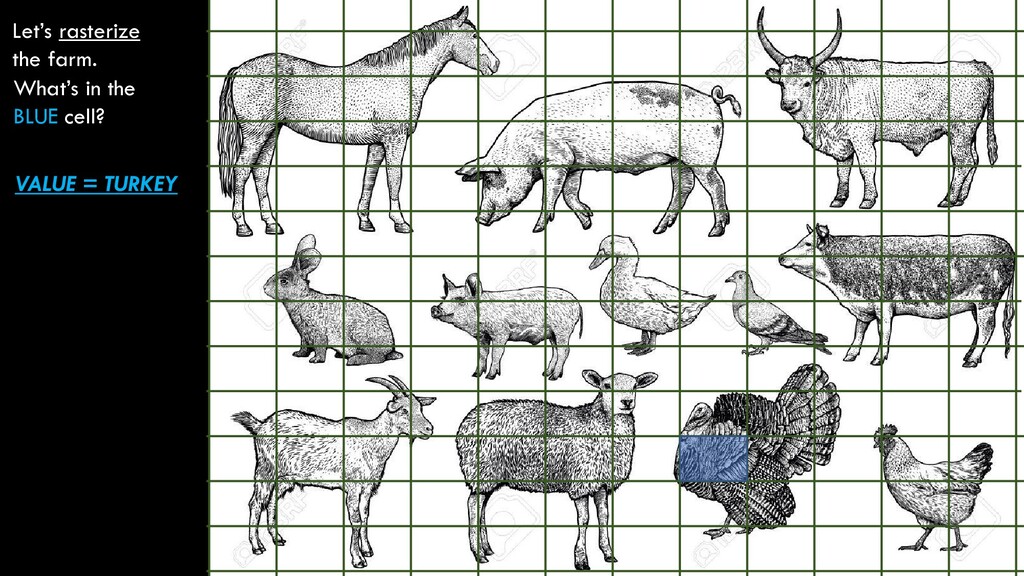
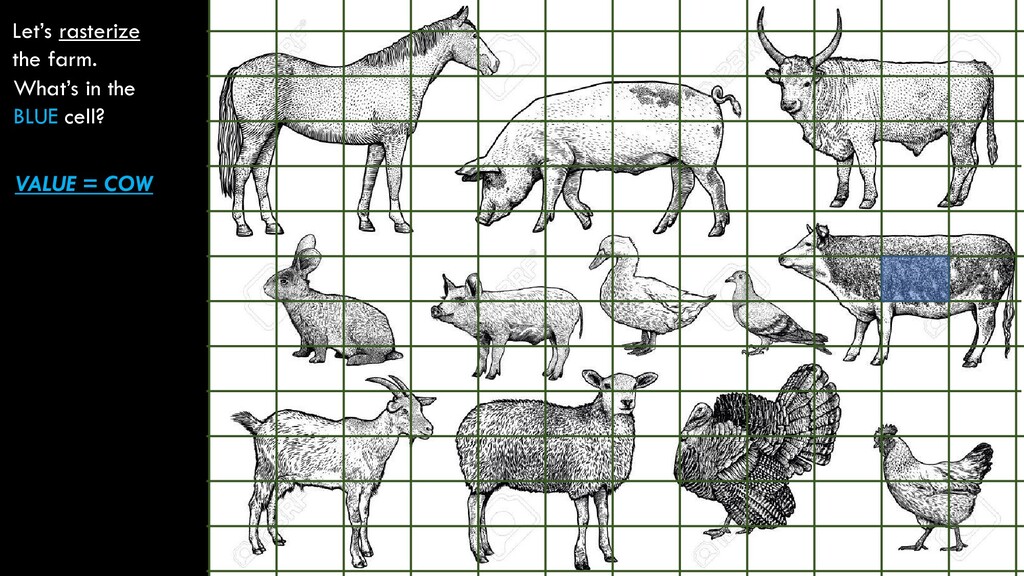
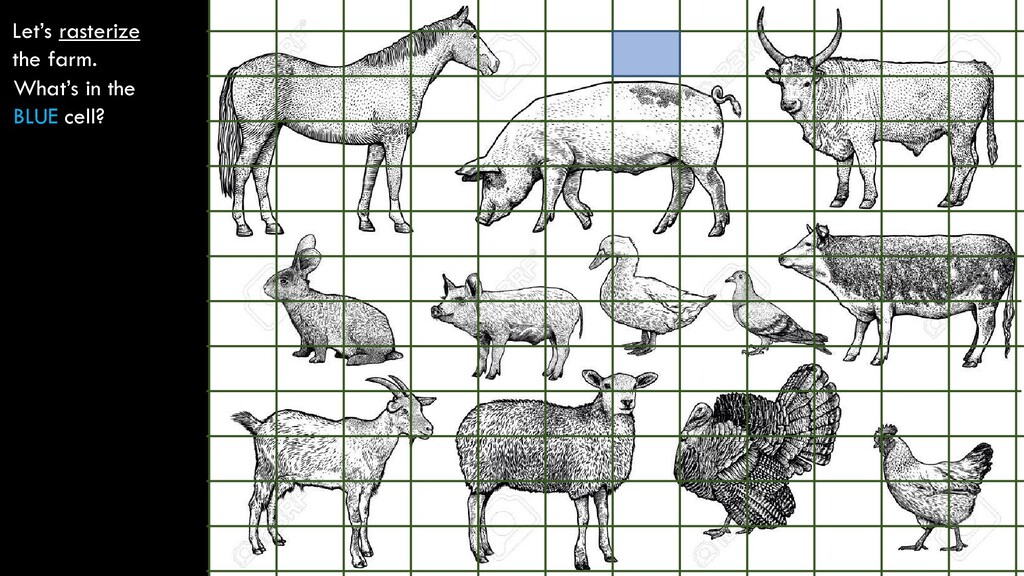
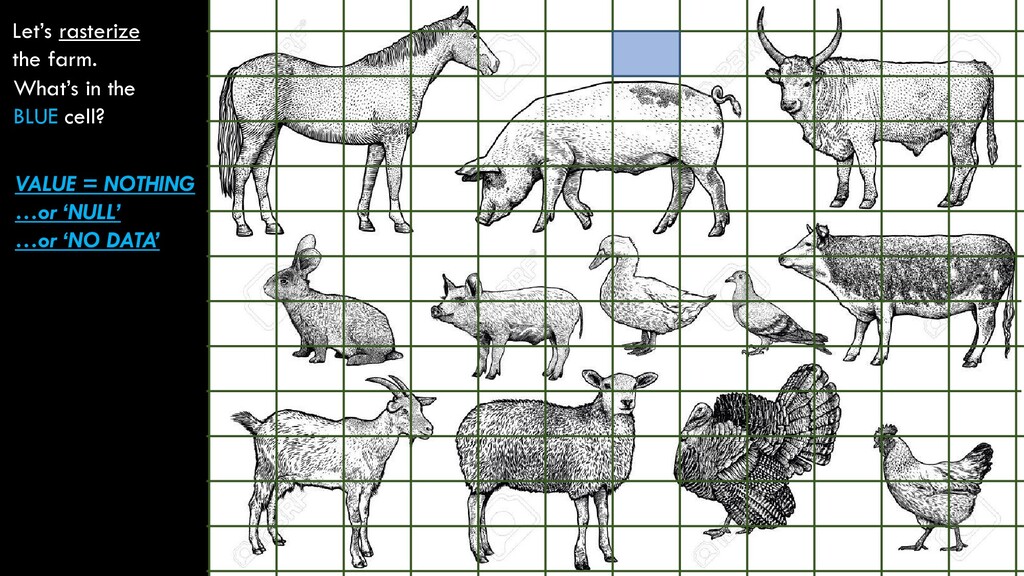
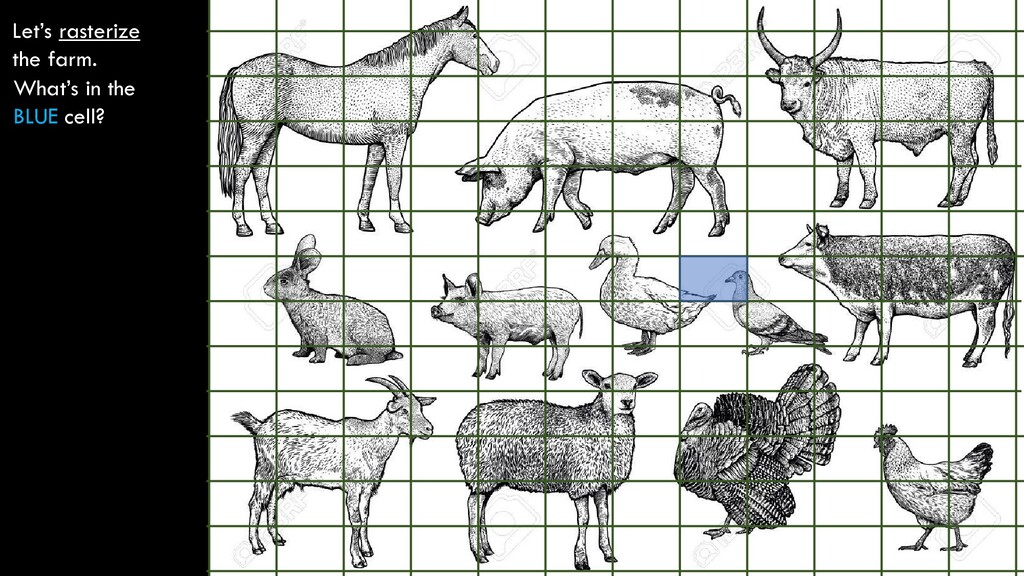
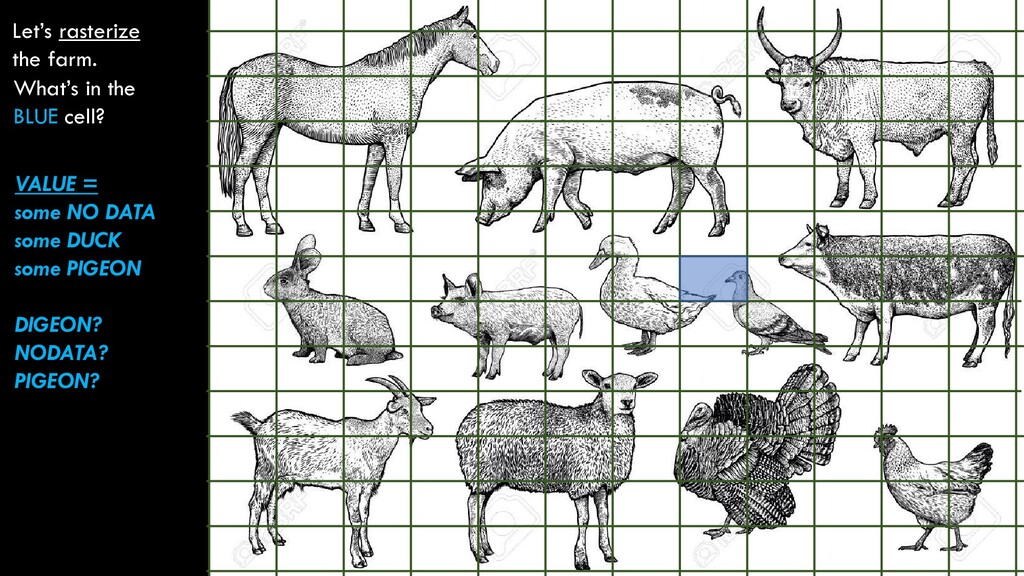
regularly spaced grid of cells, or pixels. -Me Raster data models define space as discrete cells, in which each cell has a value associated with it that represents certain characteristics of that area. - Bolstad, GIS Fundamentals
regularly spaced grid of cells, or pixels. -Me Raster data models define space as discrete cells, in which each cell has a value associated with it that represents certain characteristics of that area. - Bolstad, GIS Fundamentals
regularly spaced grid of cells, or pixels. -Me Raster data models define space as discrete cells, in which each cell has a value associated with it that represents certain characteristics of that area. - Bolstad, GIS Fundamentals
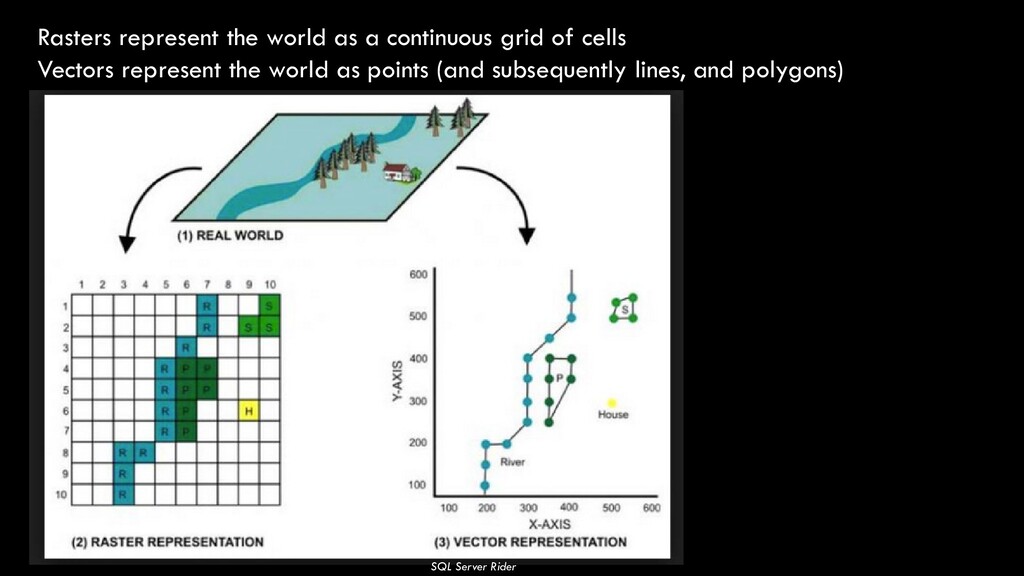
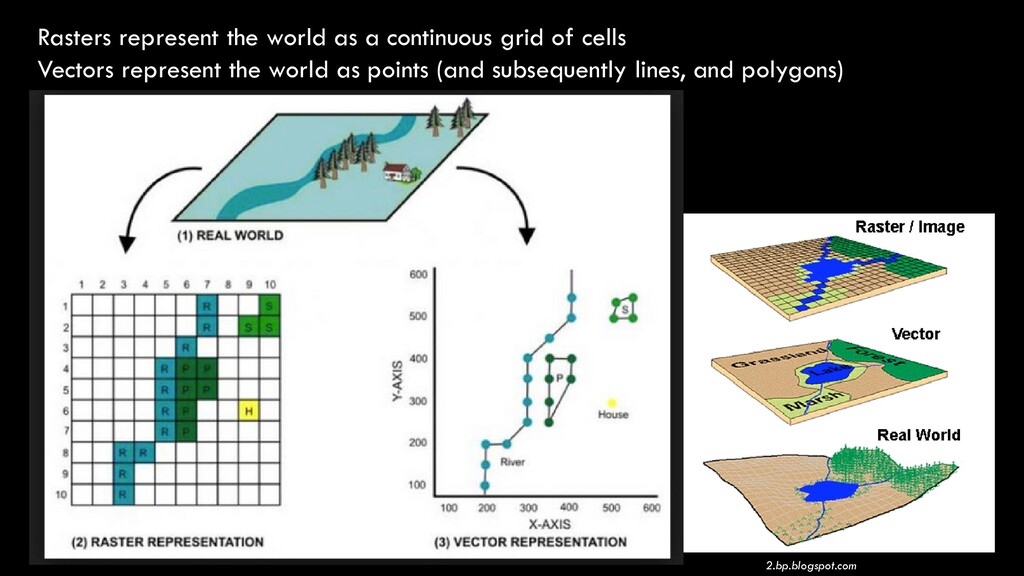
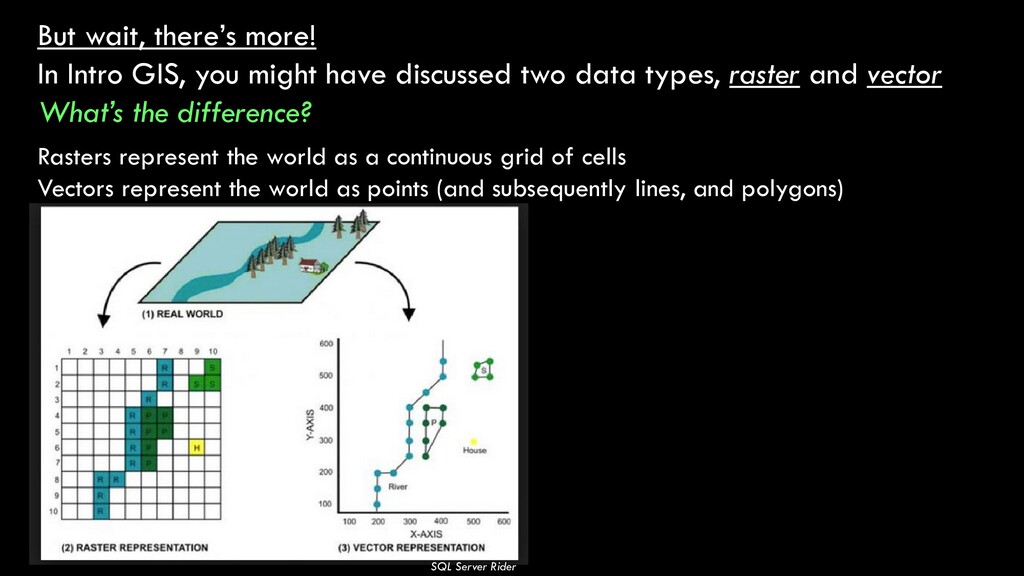
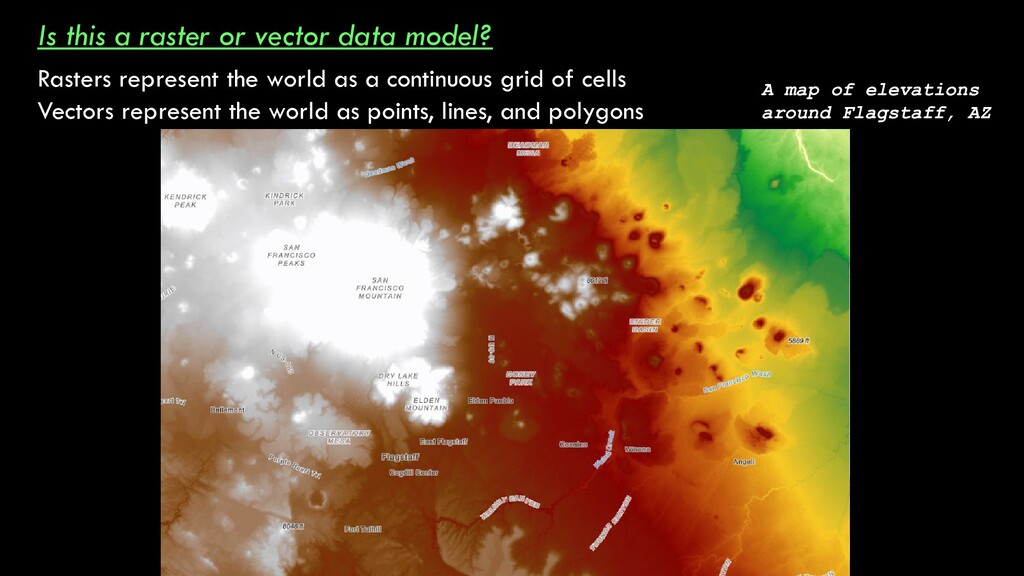
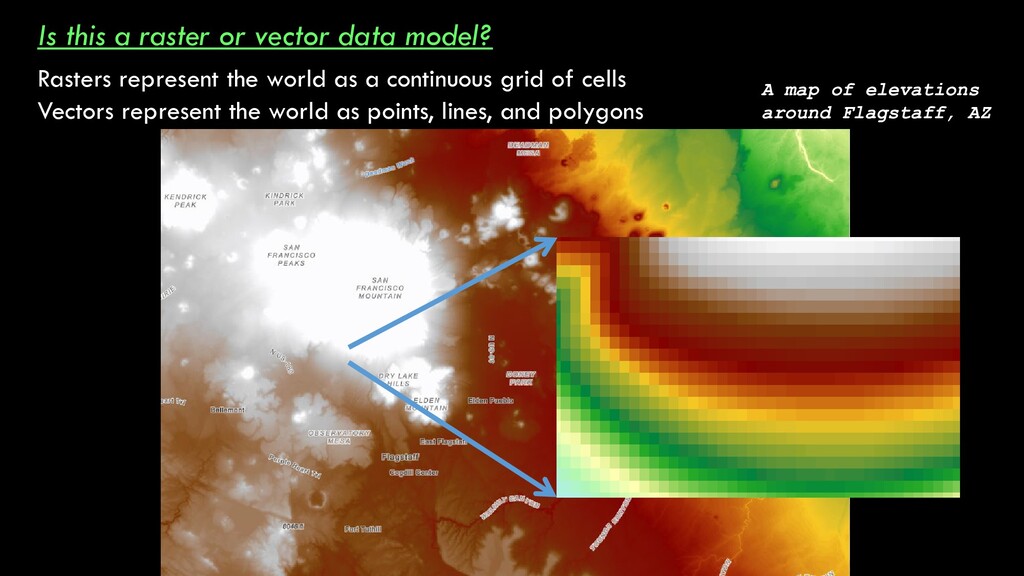
discussed two data types, raster and vector What’s the difference? Rasters represent the world as a continuous grid of cells Vectors represent the world as points (and subsequently lines, and polygons) SQL Server Rider
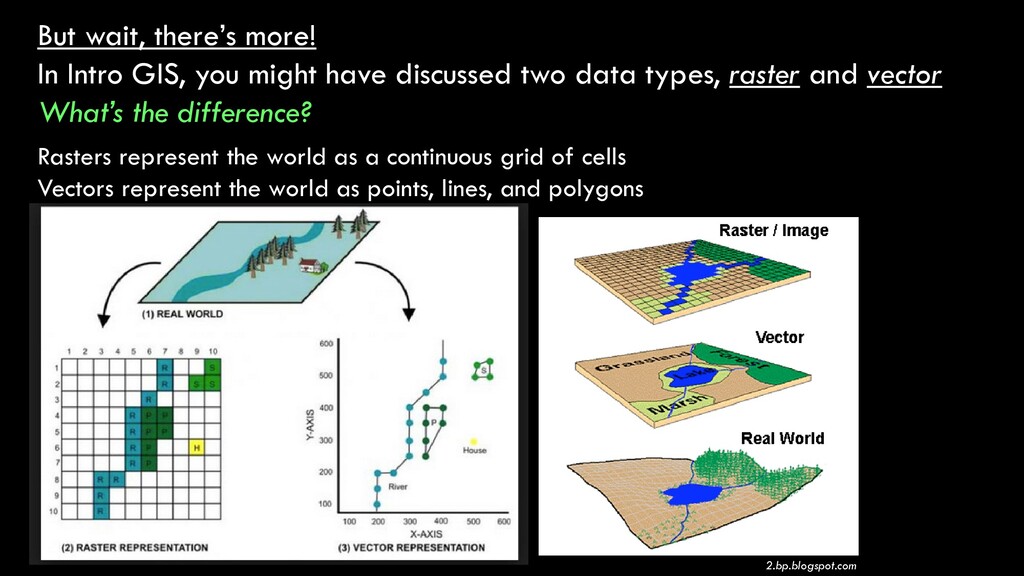
discussed two data types, raster and vector What’s the difference? Rasters represent the world as a continuous grid of cells Vectors represent the world as points, lines, and polygons 2.bp.blogspot.com
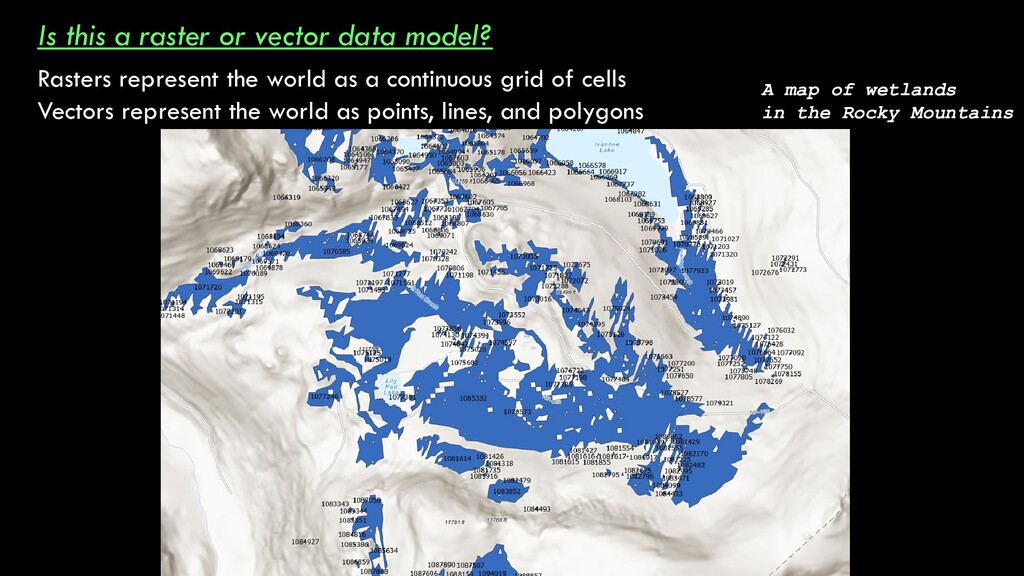
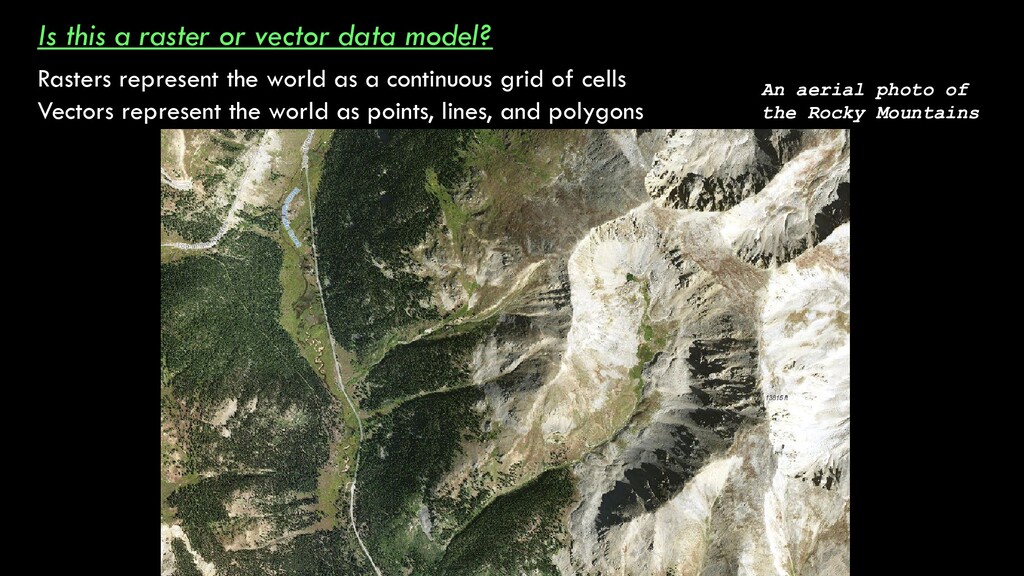
the world as a continuous grid of cells Vectors represent the world as points, lines, and polygons You’ll get really good at doing this quickly, but the most intuitive way? Just zoom in. Vectors are discrete points or connected points, so they’ll always be sharp Rasters are pixels of a given size, so they’ll get “pixelated” or blurry up close. Shutterstock Adobe
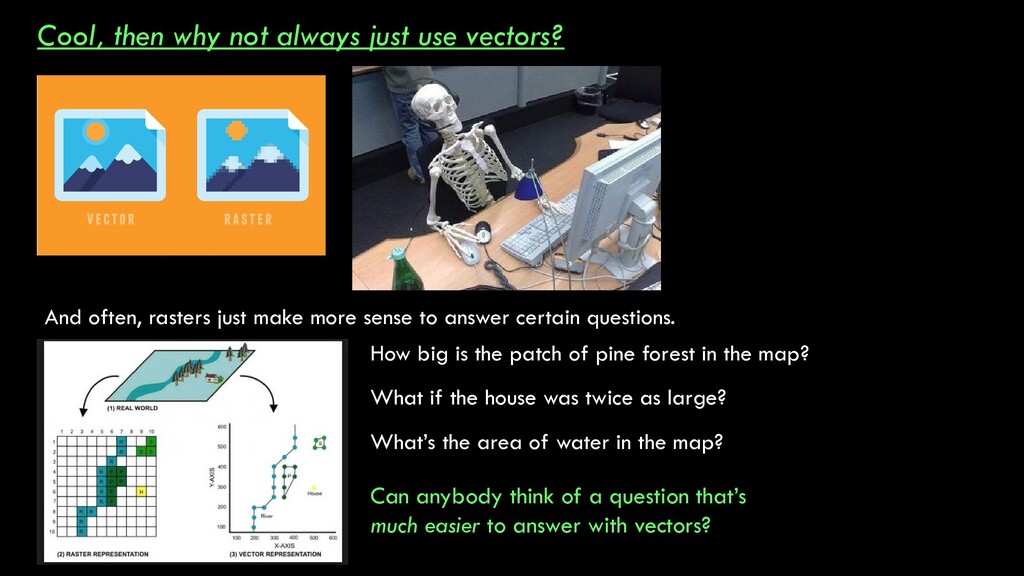
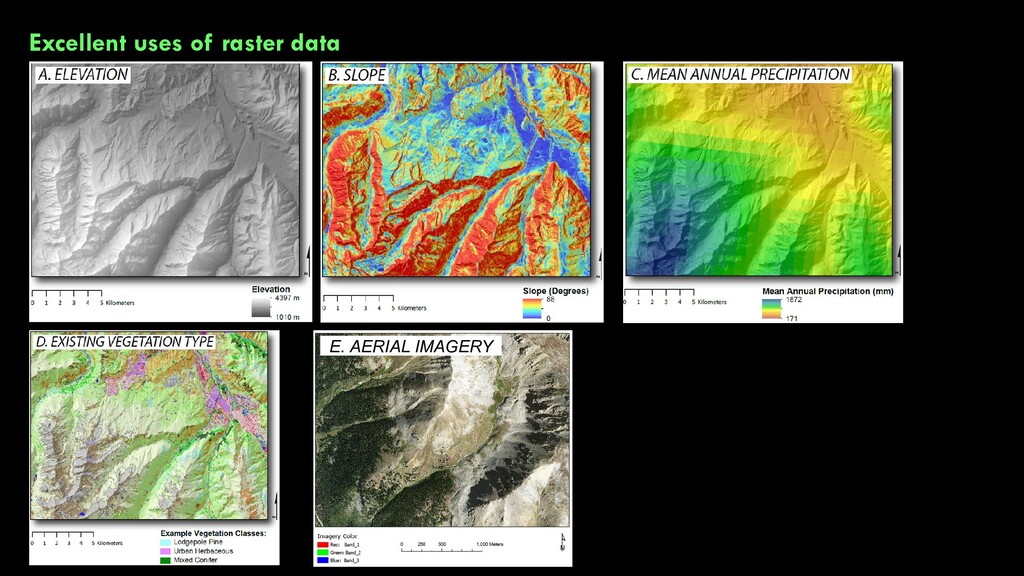
rasters just make more sense to answer certain questions. How big is the patch of pine forest in the map? What if the house was twice as large? What’s the area of water in the map? Can anybody think of a question that’s much easier to answer with vectors?
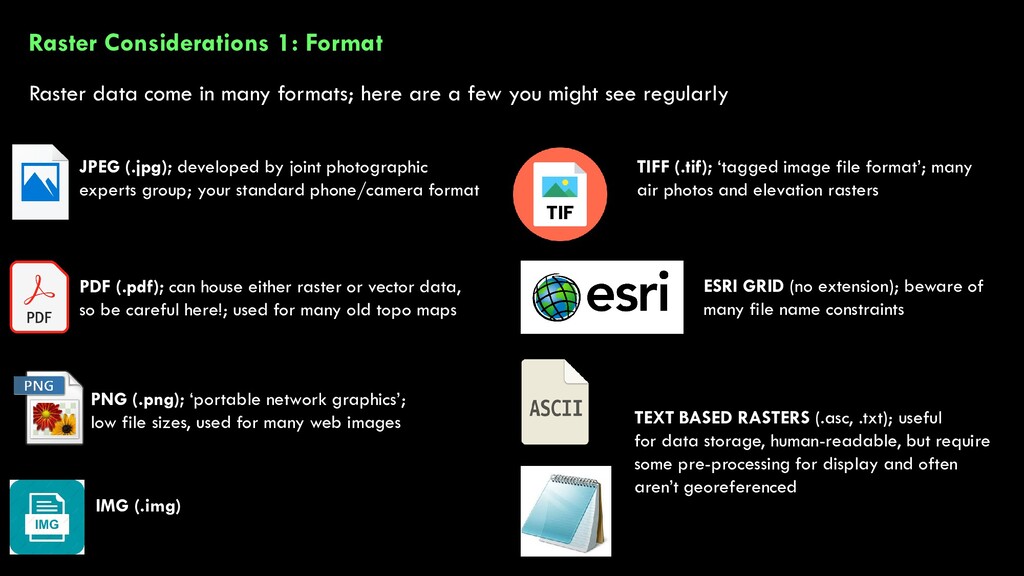
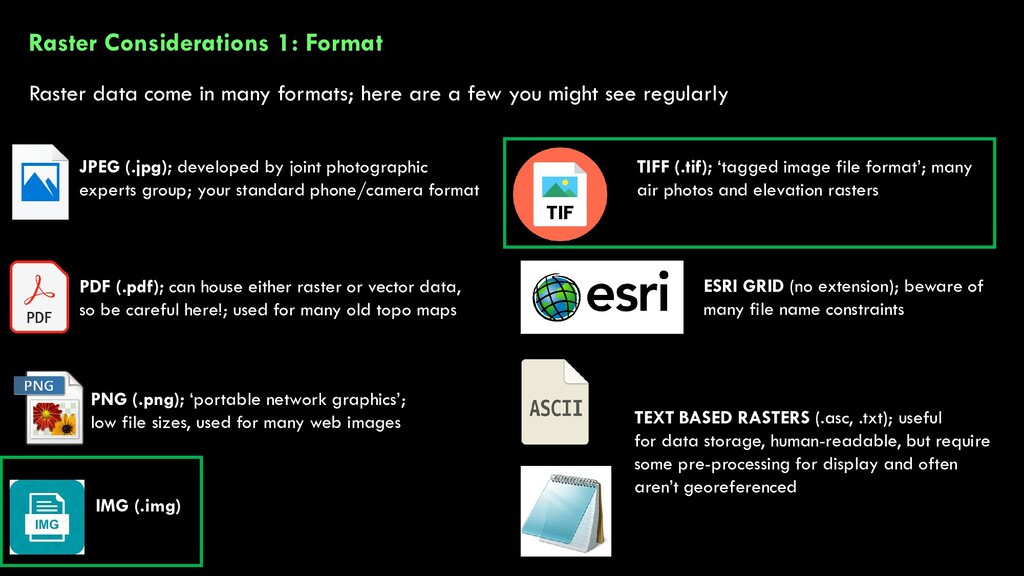
here are a few you might see regularly JPEG (.jpg); developed by joint photographic experts group; your standard phone/camera format PDF (.pdf); can house either raster or vector data, so be careful here!; used for many old topo maps PNG (.png); ‘portable network graphics’; low file sizes, used for many web images IMG (.img) TIFF (.tif); ‘tagged image file format’; many air photos and elevation rasters ESRI GRID (no extension); beware of many file name constraints TEXT BASED RASTERS (.asc, .txt); useful for data storage, human-readable, but require some pre-processing for display and often aren’t georeferenced
here are a few you might see regularly JPEG (.jpg); developed by joint photographic experts group; your standard phone/camera format PDF (.pdf); can house either raster or vector data, so be careful here!; used for many old topo maps PNG (.png); ‘portable network graphics’; low file sizes, used for many web images IMG (.img) TIFF (.tif); ‘tagged image file format’; many air photos and elevation rasters ESRI GRID (no extension); beware of many file name constraints TEXT BASED RASTERS (.asc, .txt); useful for data storage, human-readable, but require some pre-processing for display and often aren’t georeferenced
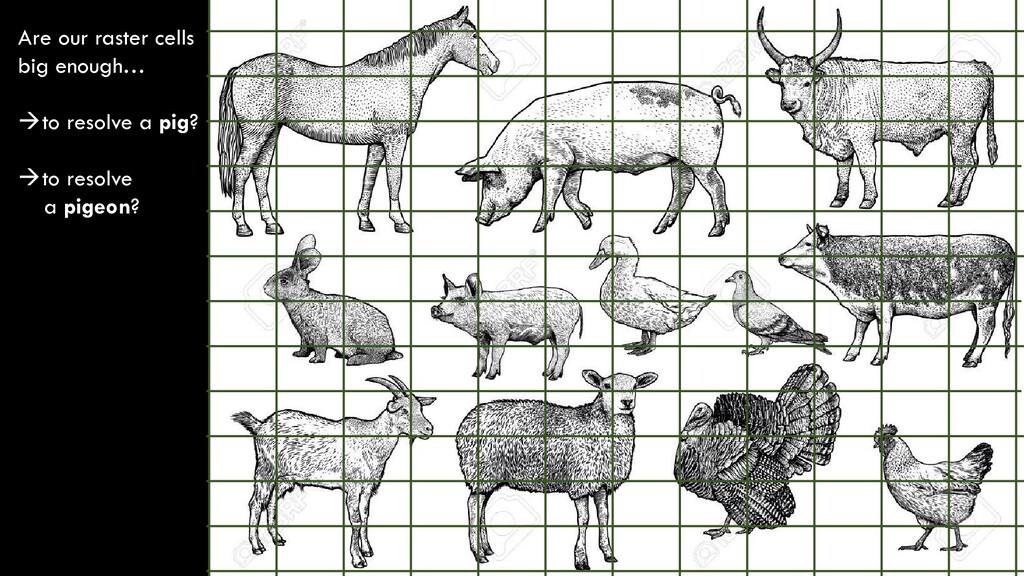
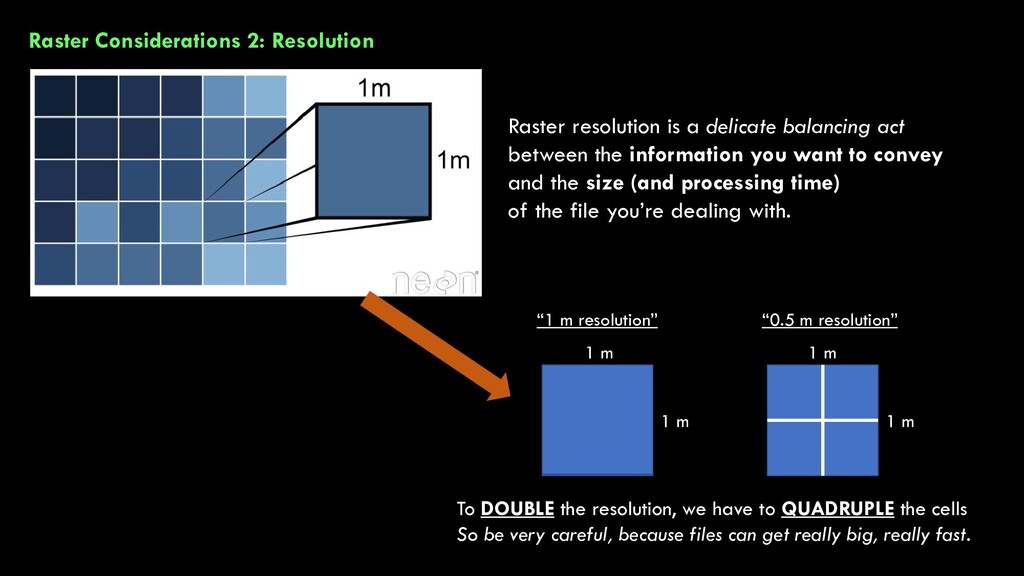
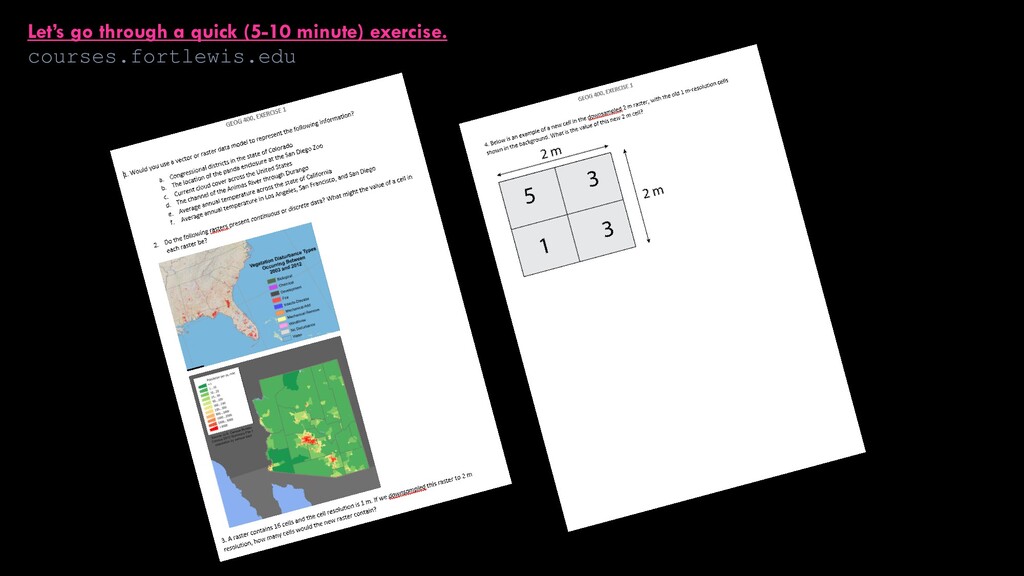
act between the information you want to convey and the size (and processing time) of the file you’re dealing with. “1 m resolution” “0.5 m resolution” 1 m 1 m 1 m 1 m To DOUBLE the resolution, we have to QUADRUPLE the cells So be very careful, because files can get really big, really fast.
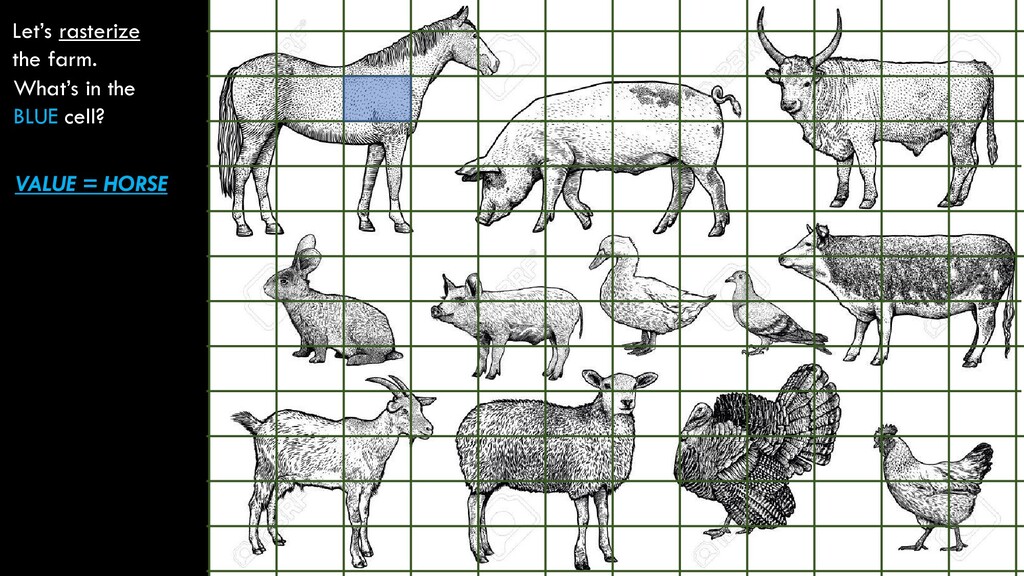
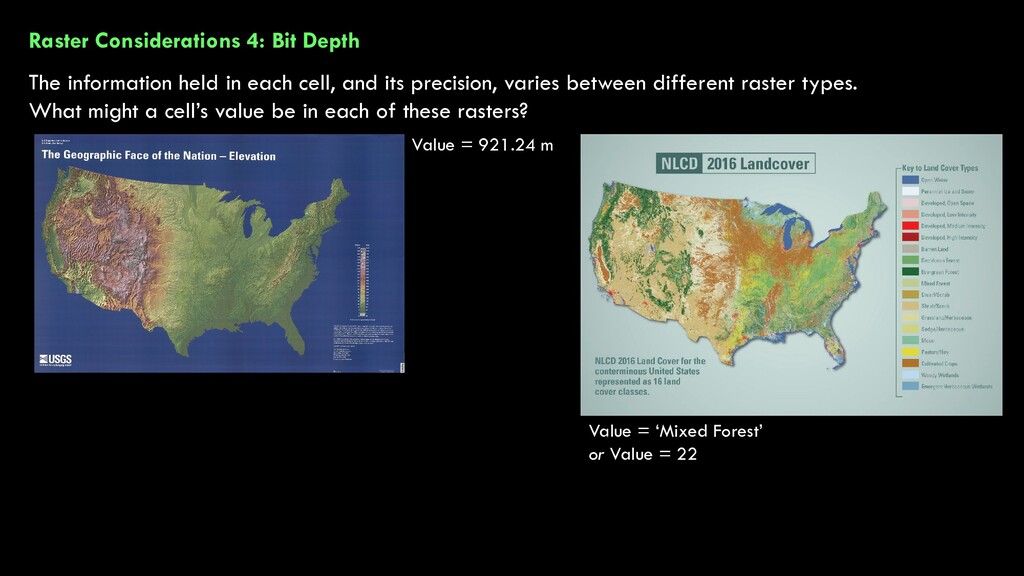
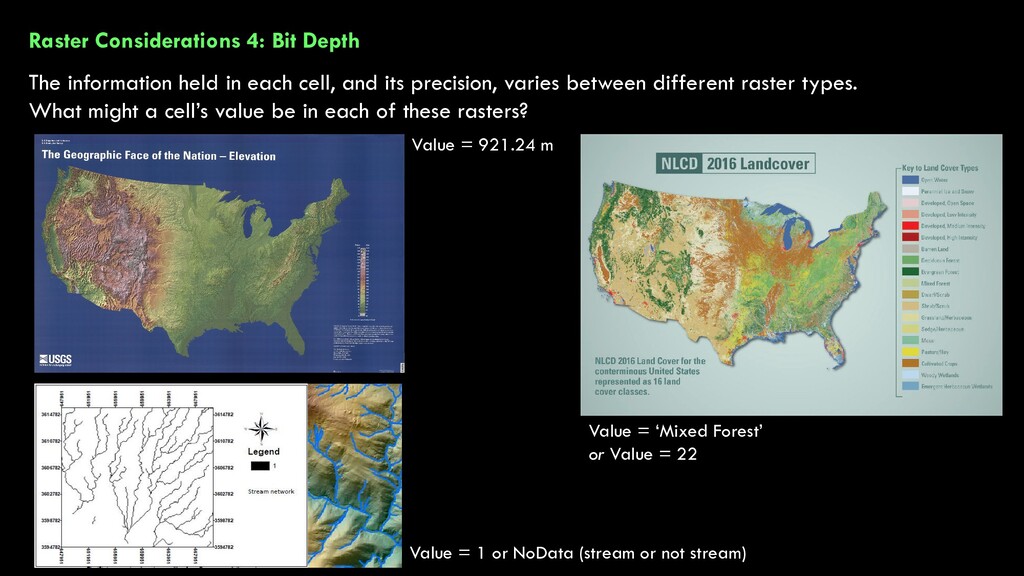
cell, and its precision, varies between different raster types. What might a cell’s value be in each of these rasters? Value = 921.24 m Value = ‘Mixed Forest’ or Value = 22
cell, and its precision, varies between different raster types. What might a cell’s value be in each of these rasters? Value = 921.24 m Value = ‘Mixed Forest’ or Value = 22
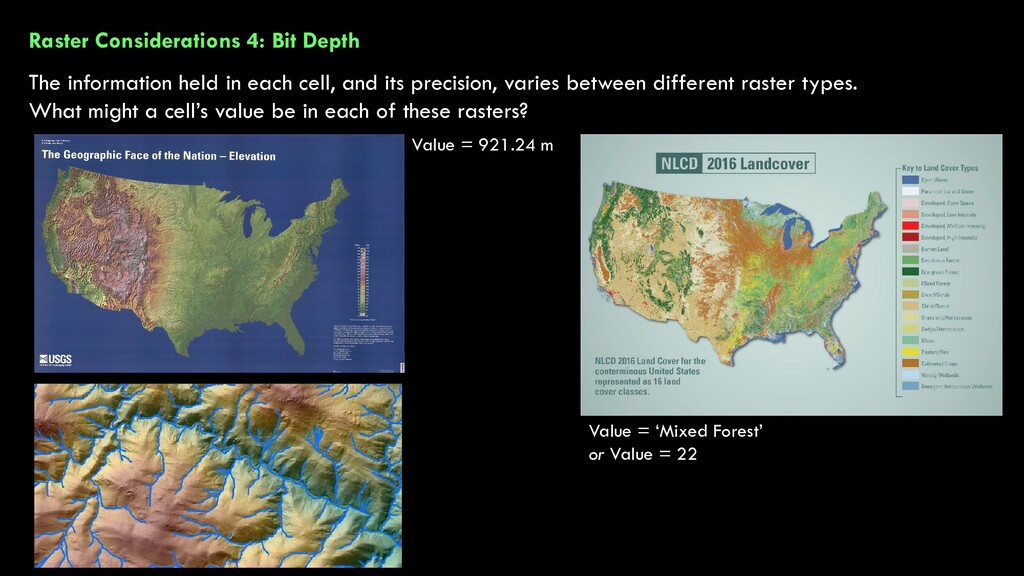
cell, and its precision, varies between different raster types. What might a cell’s value be in each of these rasters? Value = 921.24 m Value = ‘Mixed Forest’ or Value = 22 Value = 1 or NoData (stream or not stream)
![What’s a Vector? [the etymological definition]](https://files.speakerdeck.com/presentations/8c2355c890a246fbad3345ed1ff8dd6a/slide_9.jpg)
![What’s a Raster? [the etymological definition]](https://files.speakerdeck.com/presentations/8c2355c890a246fbad3345ed1ff8dd6a/slide_22.jpg)
![What’s a Raster? [our practical definition] A raster is a](https://files.speakerdeck.com/presentations/8c2355c890a246fbad3345ed1ff8dd6a/slide_23.jpg)
![What’s a Raster? [our practical definition] A raster is a](https://files.speakerdeck.com/presentations/8c2355c890a246fbad3345ed1ff8dd6a/slide_24.jpg)
![What’s a Raster? [our practical definition] A raster is a](https://files.speakerdeck.com/presentations/8c2355c890a246fbad3345ed1ff8dd6a/slide_38.jpg)