final project 2. What’s a web map? 3. In groups, check out two web maps and provide feedback 4. Review what you’ve learned 5. In groups, check out two other web maps and provide feedback 6. Review what you’ve learned 7. Talk about how we generate web maps from code
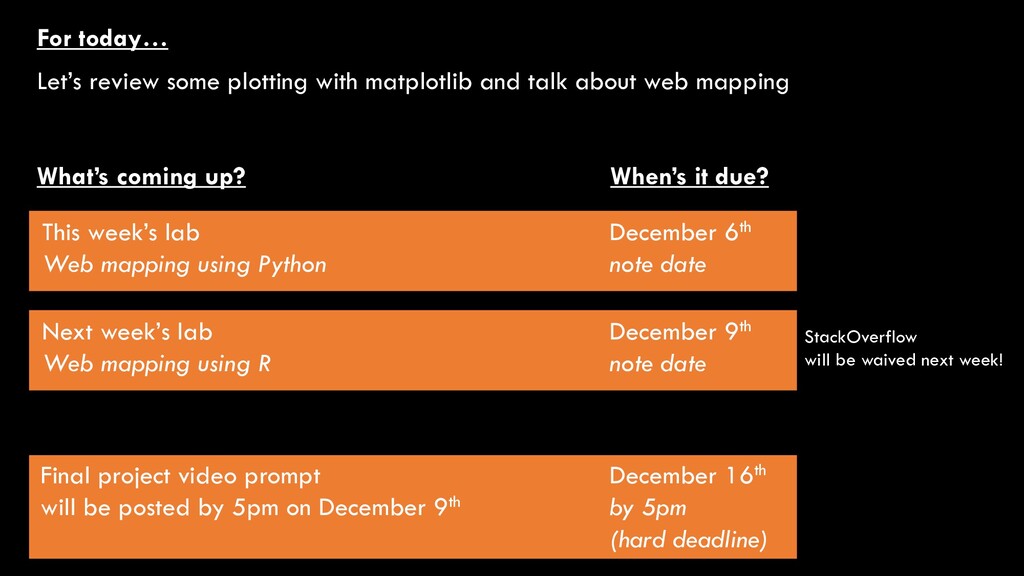
about web mapping Final project video prompt will be posted by 5pm on December 9th What’s coming up? When’s it due? This week’s lab Web mapping using Python December 6th note date December 16th by 5pm (hard deadline) Next week’s lab Web mapping using R December 9th note date StackOverflow will be waived next week!
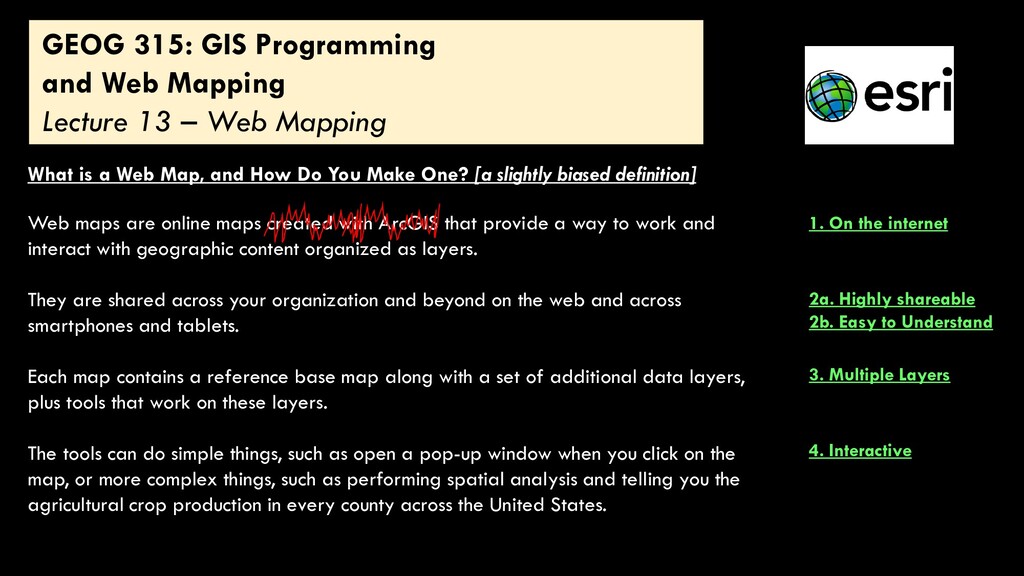
Web Mapping What is a Web Map, and How Do You Make One? [a slightly biased definition] Web maps are online maps created with ArcGIS that provide a way to work and interact with geographic content organized as layers. They are shared across your organization and beyond on the web and across smartphones and tablets. Each map contains a reference base map along with a set of additional data layers, plus tools that work on these layers. The tools can do simple things, such as open a pop-up window when you click on the map, or more complex things, such as performing spatial analysis and telling you the agricultural crop production in every county across the United States. 2a. Highly shareable 2b. Easy to Understand 3. Multiple Layers 4. Interactive 1. On the internet
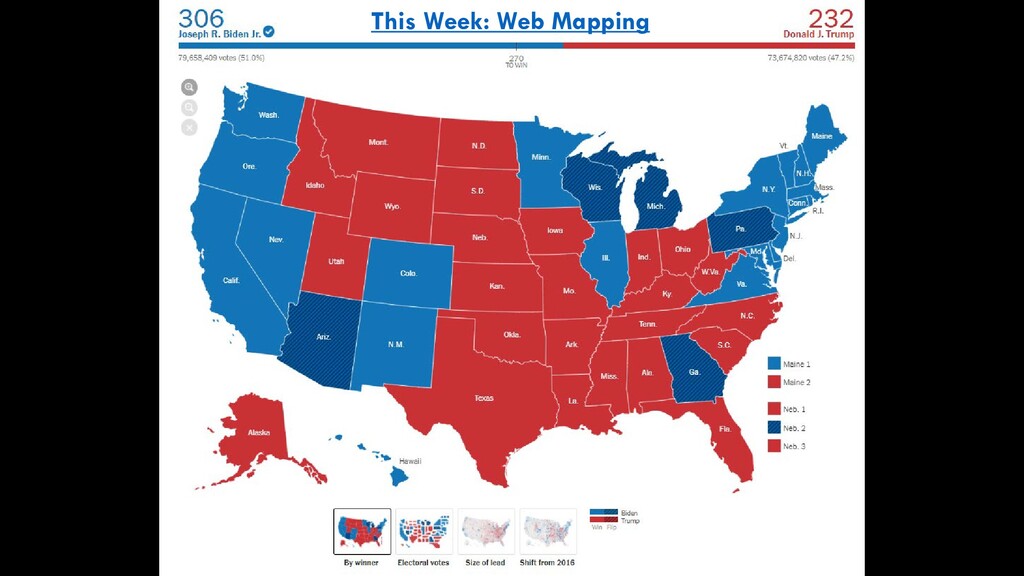
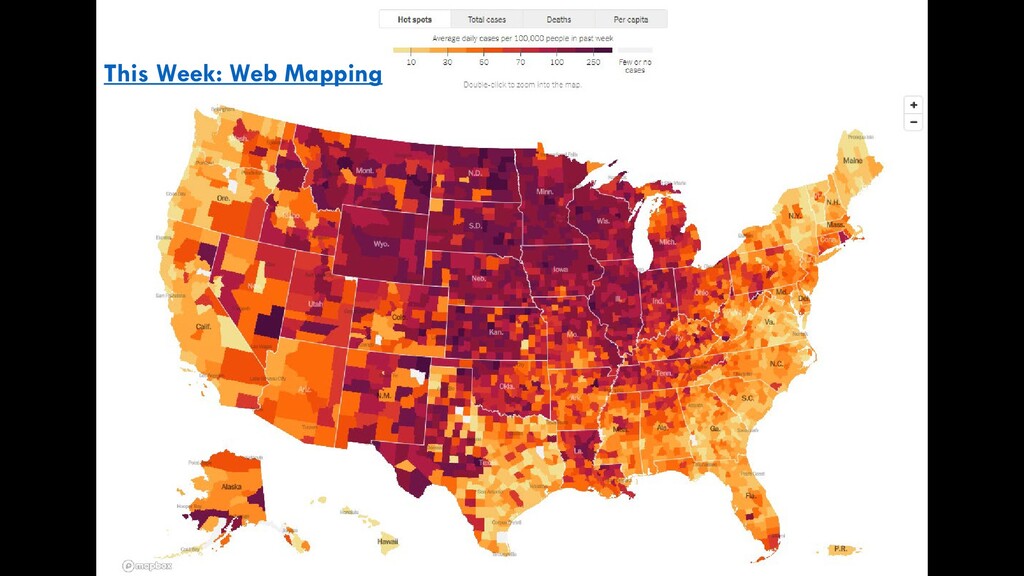
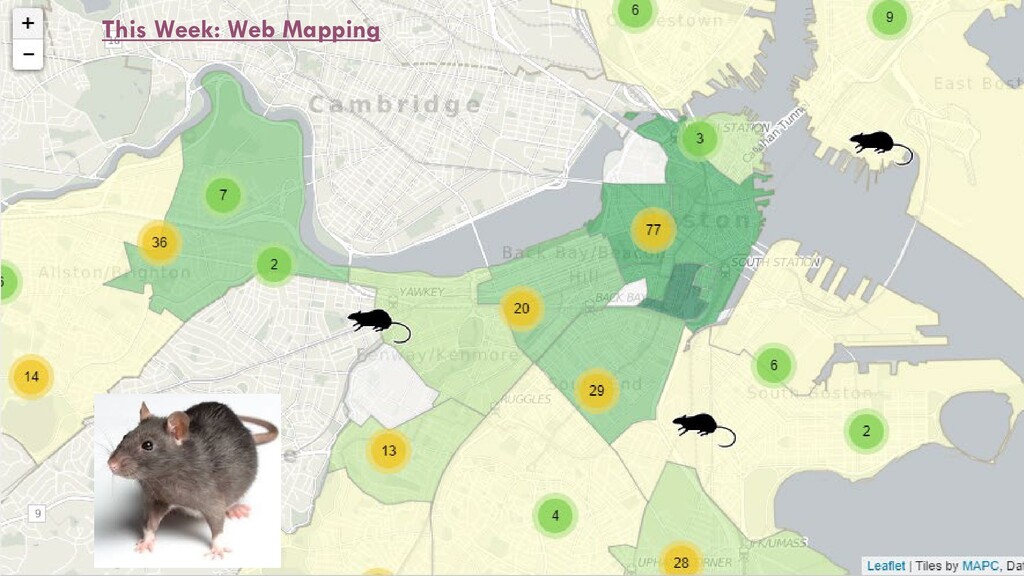
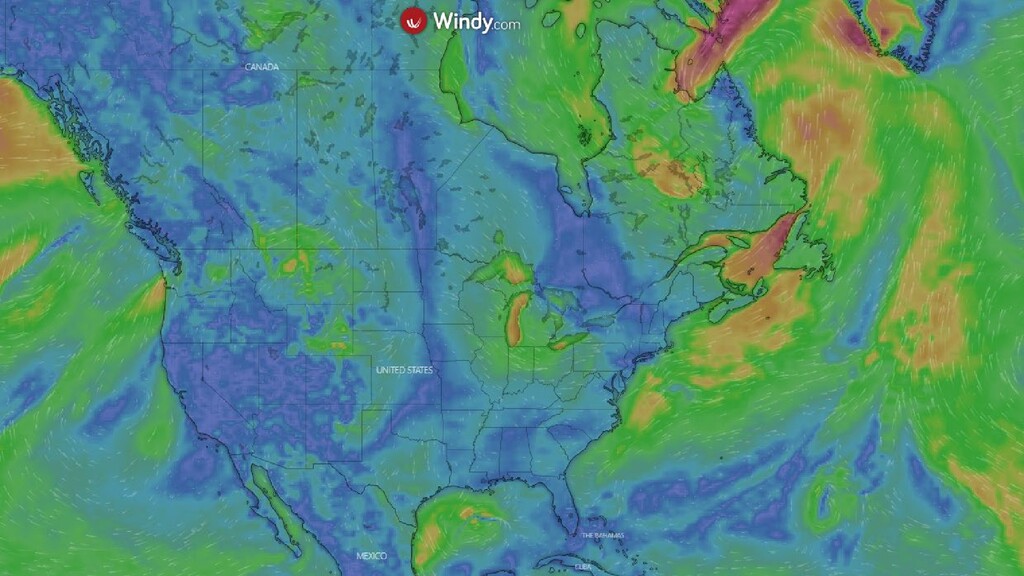
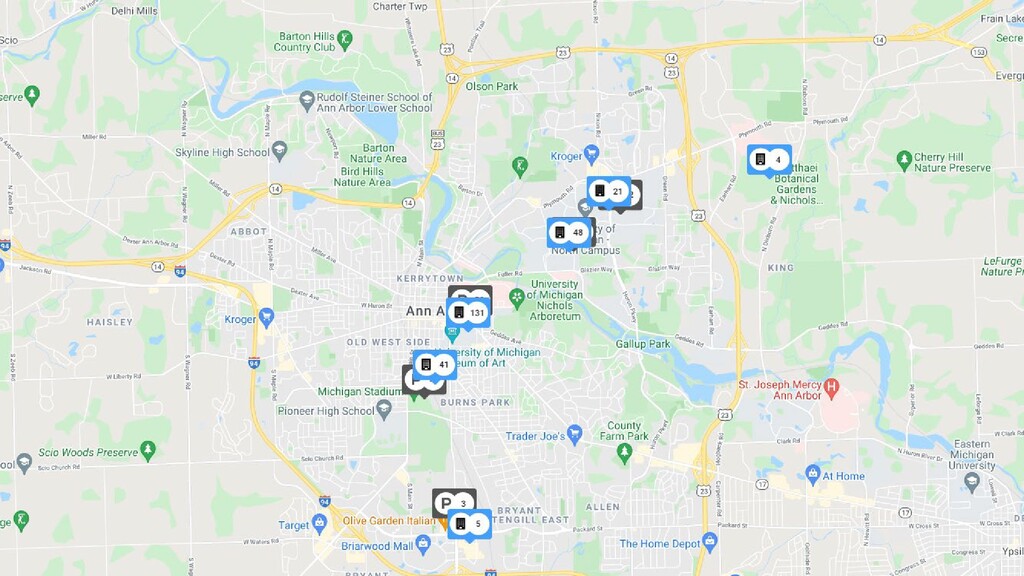
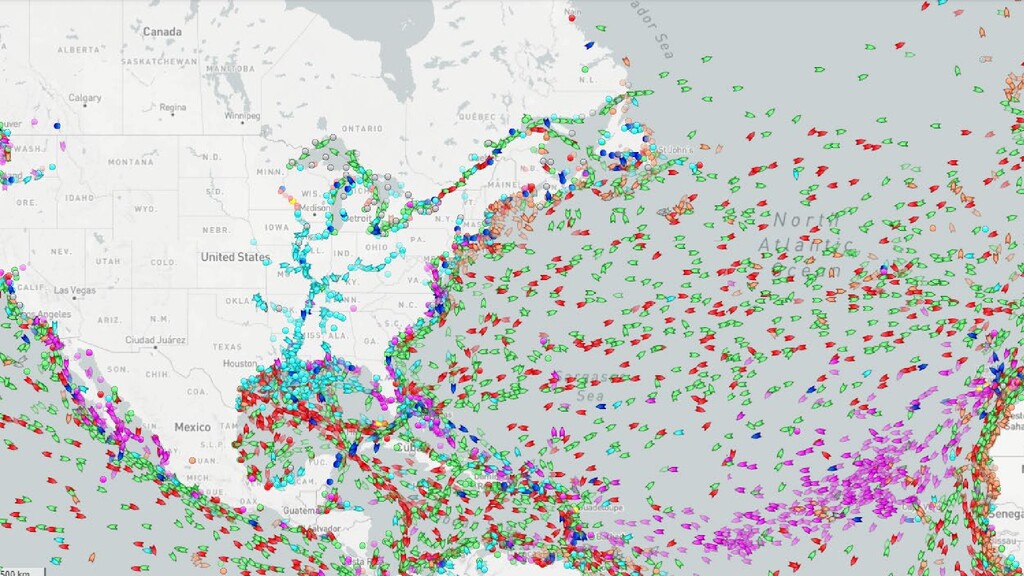
following two web maps: Map 1: bit.ly/2Zz9T0w Map 2: bit.ly/3reUPjU Within your group, discuss the following: - does the map meet the basic criteria for a web map? (highly shareable, easy to understand, multi-layered, interactive) - is the map easy to navigate? Too complicated? - is it immediately obvious what’s being shown? - would you change anything about the cartography? - …and anything else you might want to comment on!
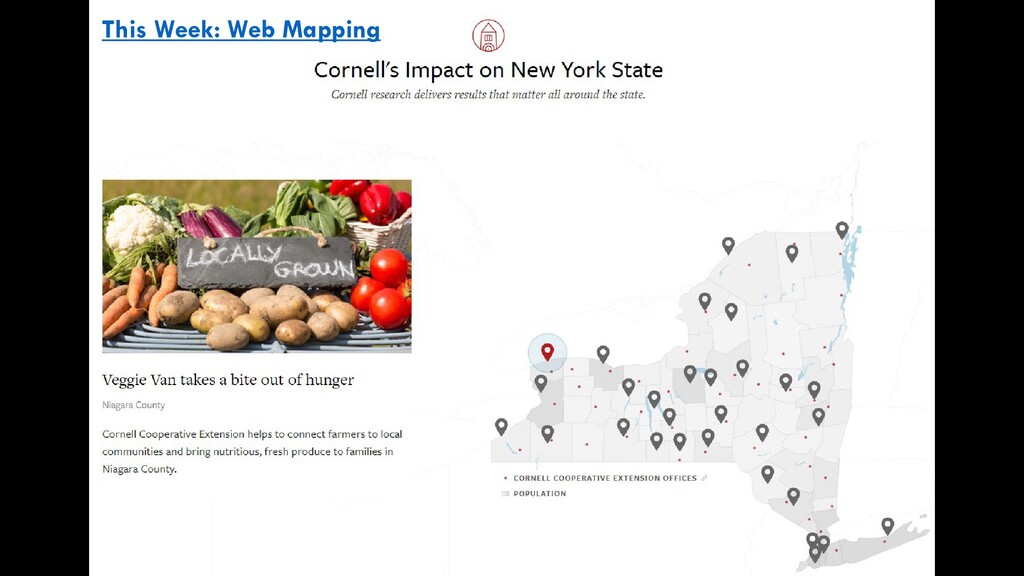
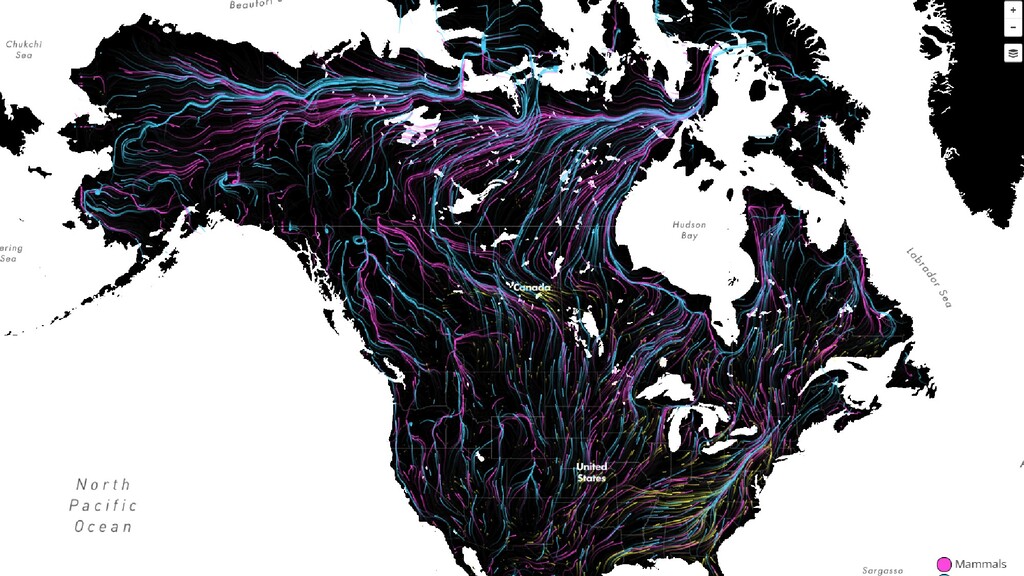
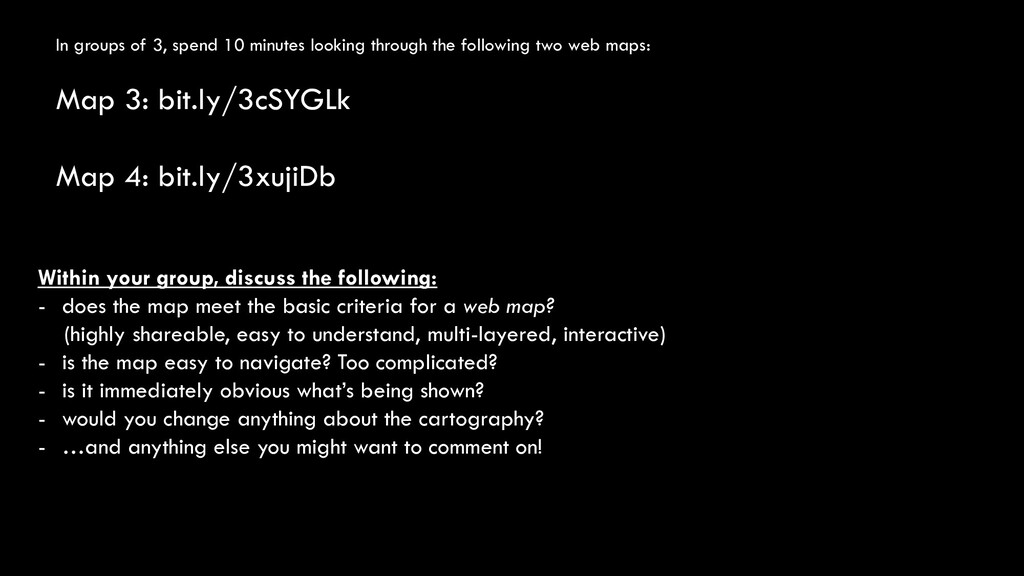
following two web maps: Map 3: bit.ly/3cSYGLk Map 4: bit.ly/3xujiDb Within your group, discuss the following: - does the map meet the basic criteria for a web map? (highly shareable, easy to understand, multi-layered, interactive) - is the map easy to navigate? Too complicated? - is it immediately obvious what’s being shown? - would you change anything about the cartography? - …and anything else you might want to comment on!
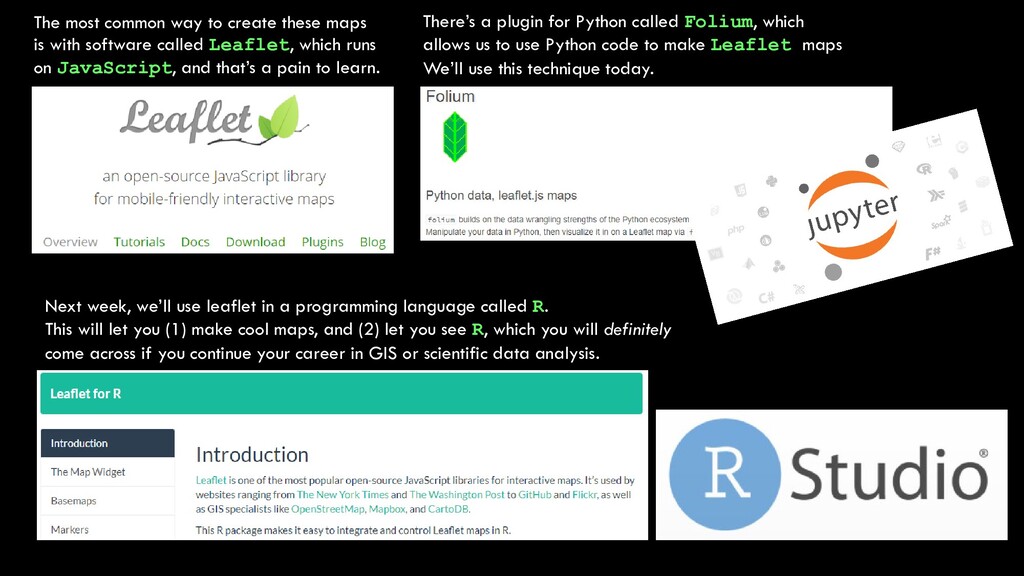
software called Leaflet, which runs on JavaScript, and that’s a pain to learn. There’s a plugin for Python called Folium, which allows us to use Python code to make Leaflet maps We’ll use this technique today. Next week, we’ll use leaflet in a programming language called R. This will let you (1) make cool maps, and (2) let you see R, which you will definitely come across if you continue your career in GIS or scientific data analysis.
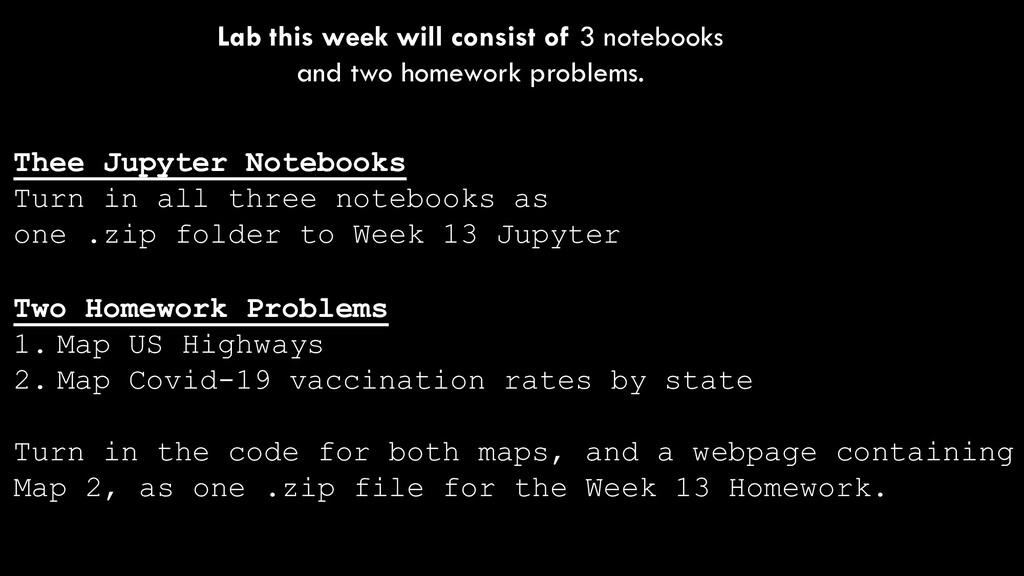
homework problems. Two Homework Problems 1. Map US Highways 2. Map Covid-19 vaccination rates by state Turn in the code for both maps, and a webpage containing Map 2, as one .zip file for the Week 13 Homework. Thee Jupyter Notebooks Turn in all three notebooks as one .zip folder to Week 13 Jupyter