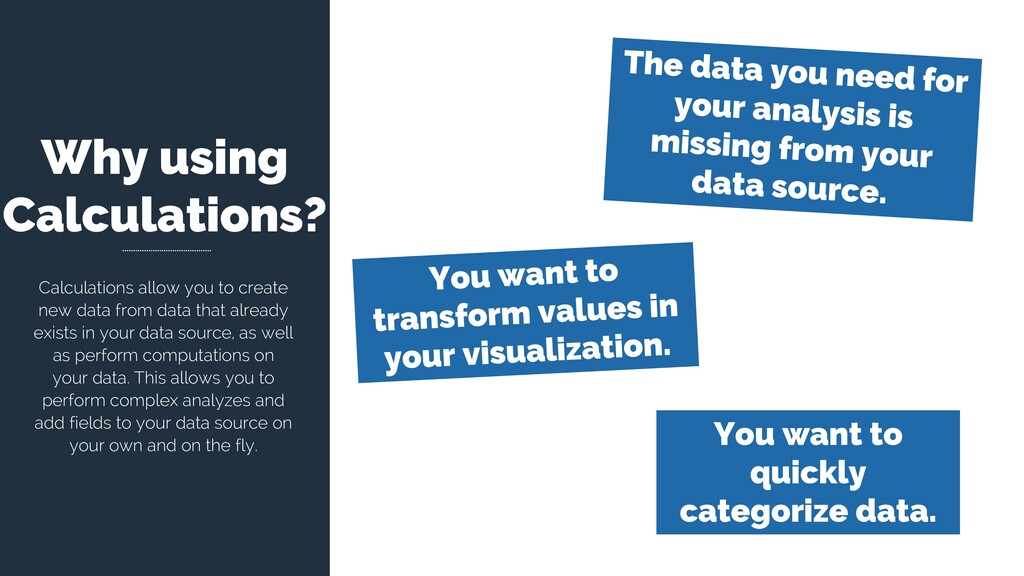
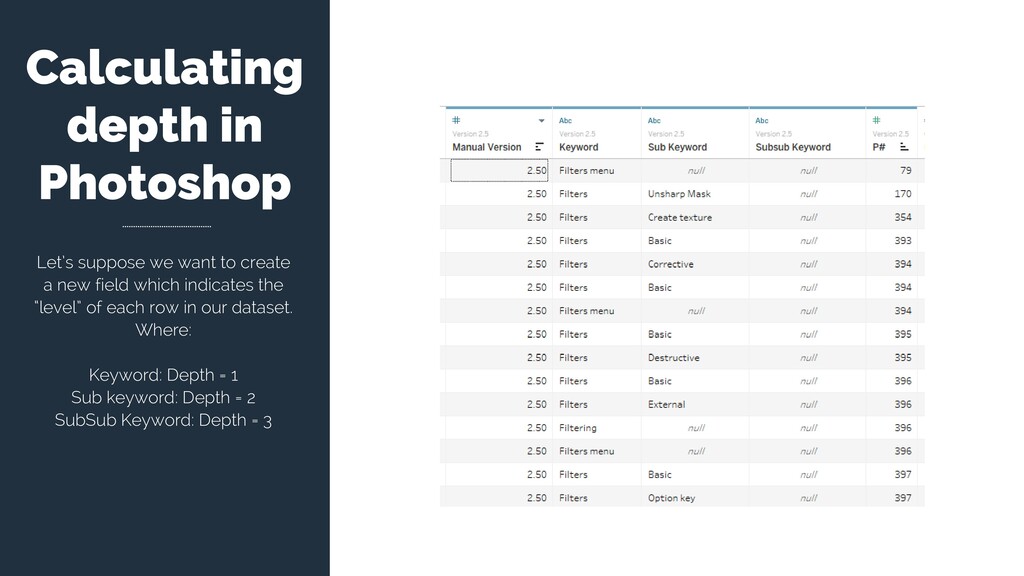
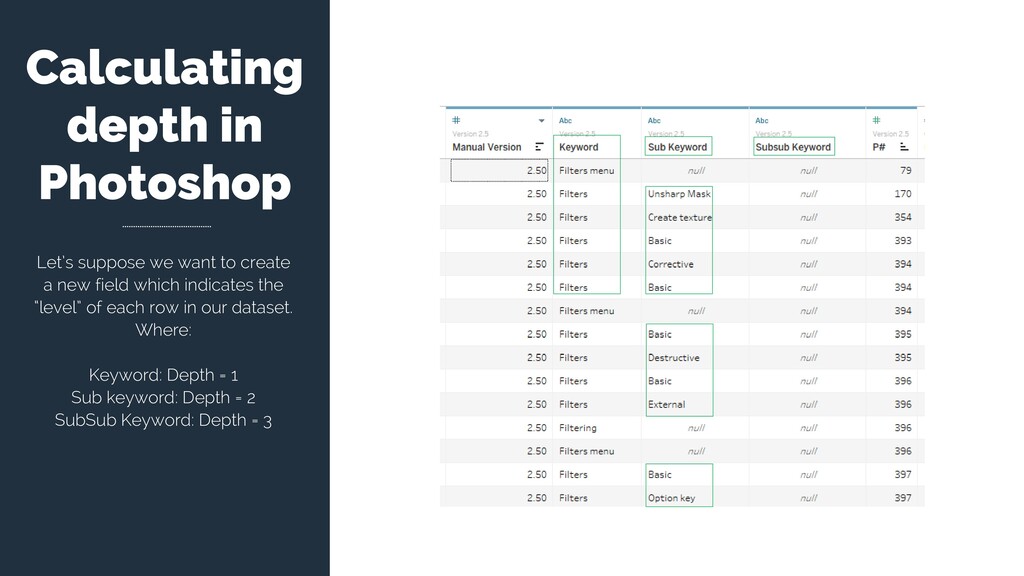
from data that already exists in your data source, as well as perform computations on your data. This allows you to perform complex analyzes and add fields to your data source on your own and on the fly. You want to quickly categorize data.
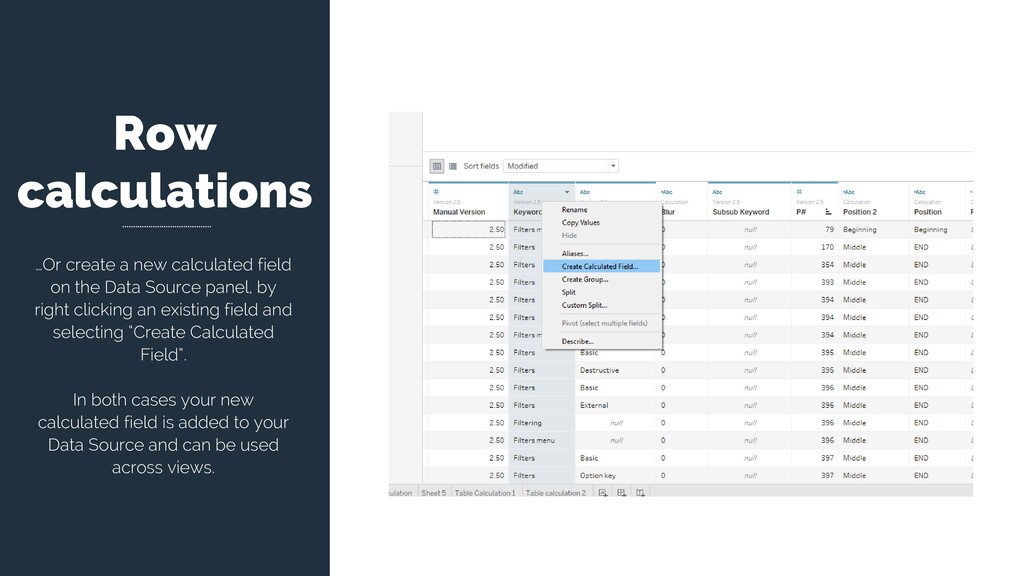
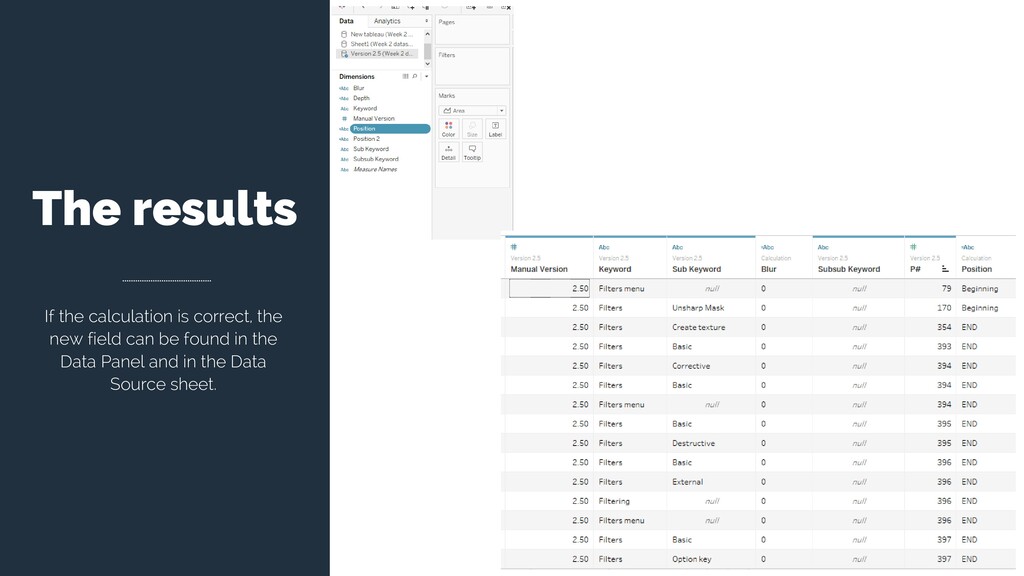
Data Source panel, by right clicking an existing field and selecting “Create Calculated Field”. In both cases your new calculated field is added to your Data Source and can be used across views.
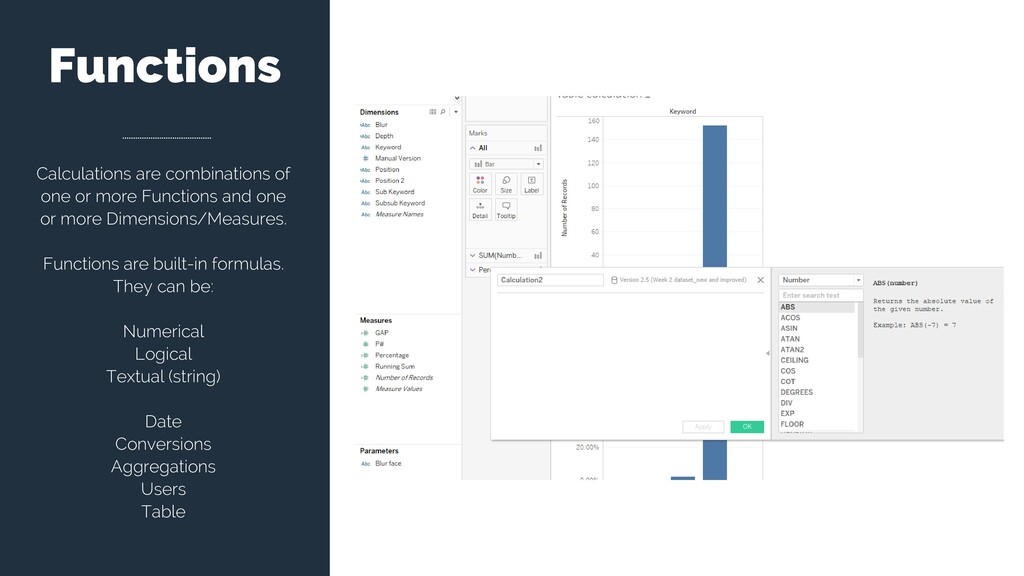
one or more Dimensions/Measures. Functions are built-in formulas. They can be: Numerical Logical Textual (string) Date Conversions Aggregations Users Table
classify our “keywords” into 2 categories. Each category identifies the position of the keyword in the Book The 2 categories are: Beginning: If the keywords appears before page 200 End: if it appears after page 200
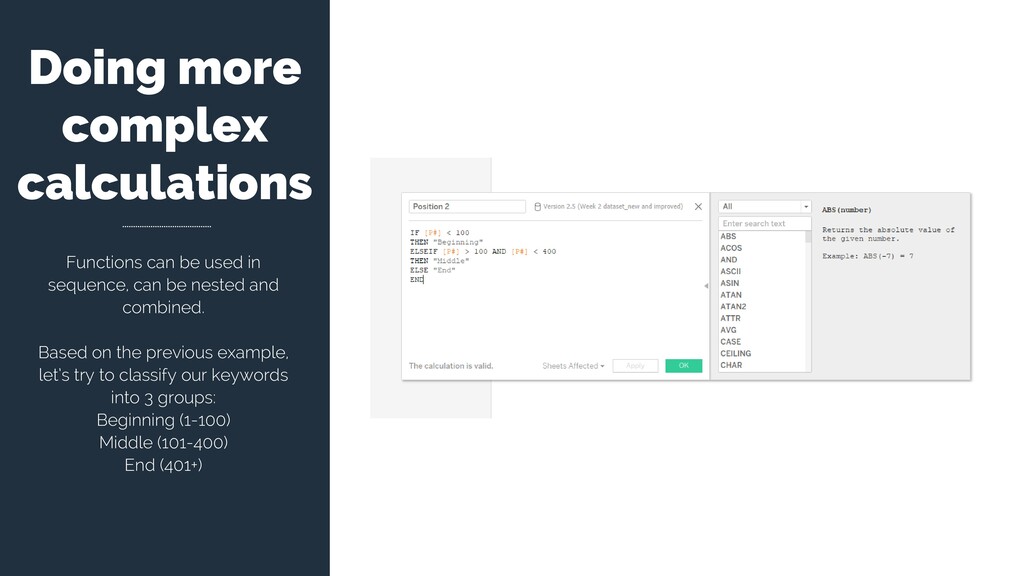
can be nested and combined. Based on the previous example, let’s try to classify our keywords into 3 groups: Beginning (1-100) Middle (101-400) End (401+)
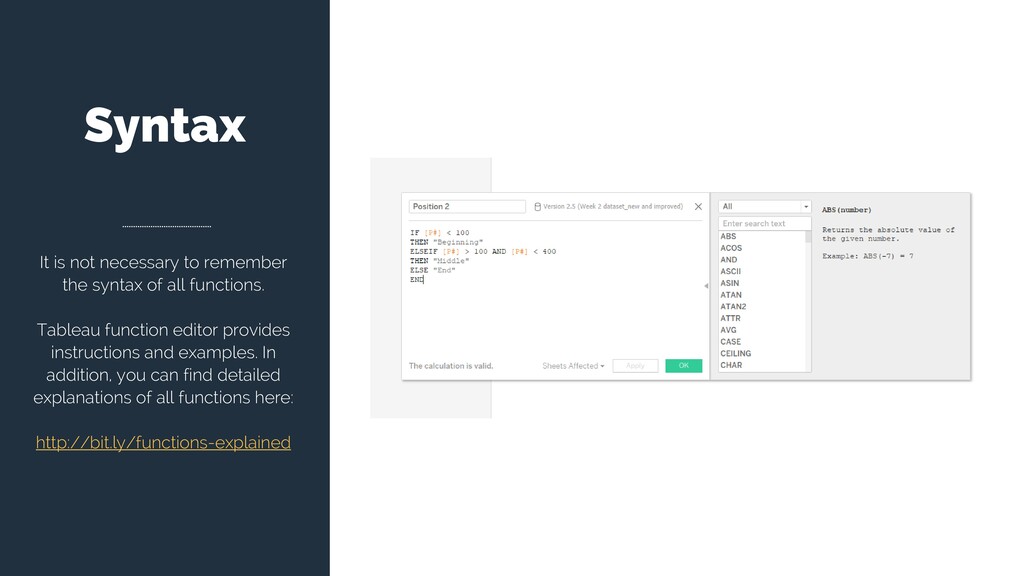
all functions. Tableau function editor provides instructions and examples. In addition, you can find detailed explanations of all functions here: http://bit.ly/functions-explained
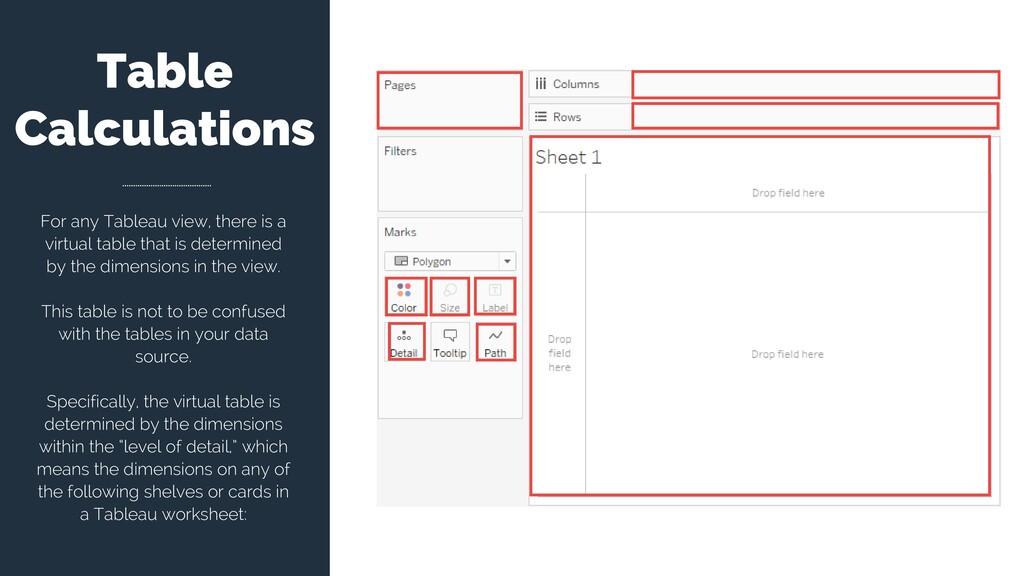
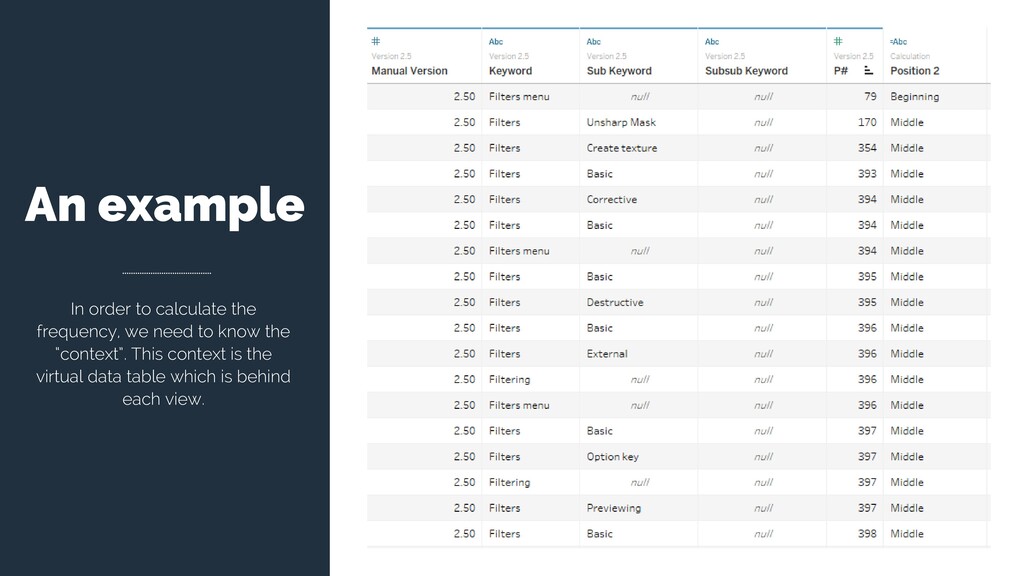
table that is determined by the dimensions in the view. This table is not to be confused with the tables in your data source. Specifically, the virtual table is determined by the dimensions within the “level of detail,” which means the dimensions on any of the following shelves or cards in a Tableau worksheet:
which cannot be executed with the information available in one row alone. It’s a calculation which depends on all the elements which compose our virtual table (i.e. the data table behind a specific view)
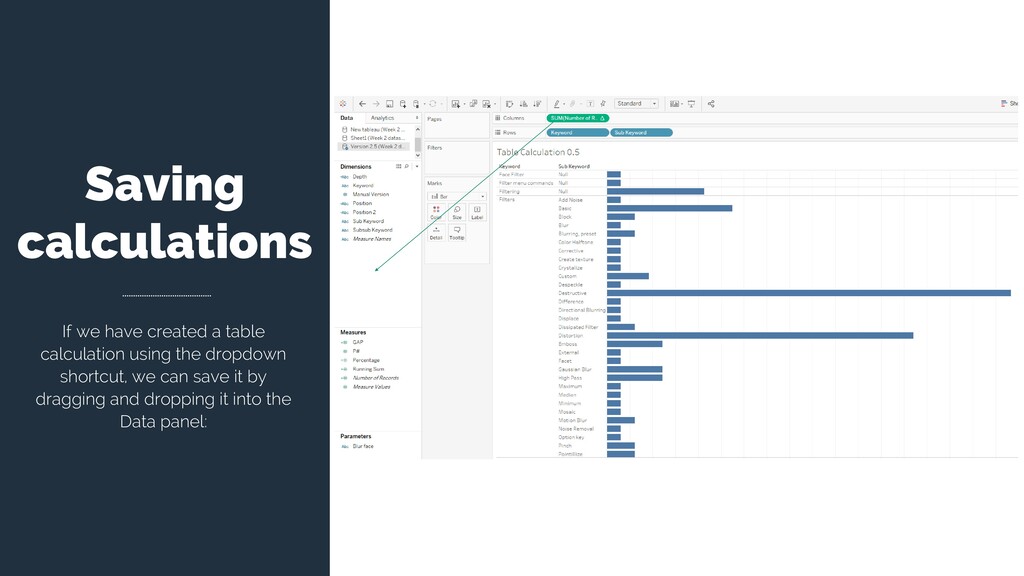
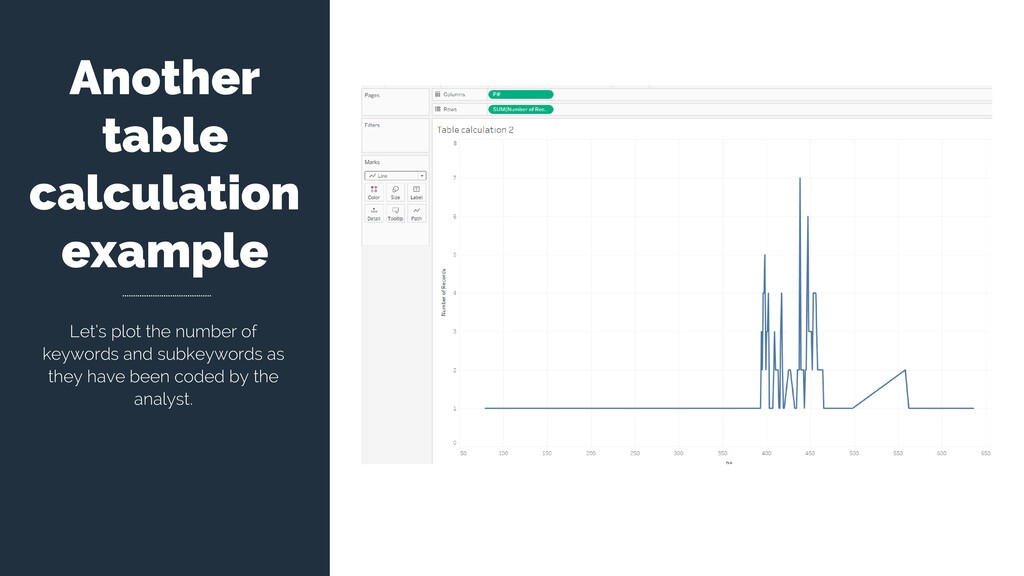
not just where (in which page) and how many times the terms have been coded. Let’s suppose we want to plot the distribution of terms throughout the book.
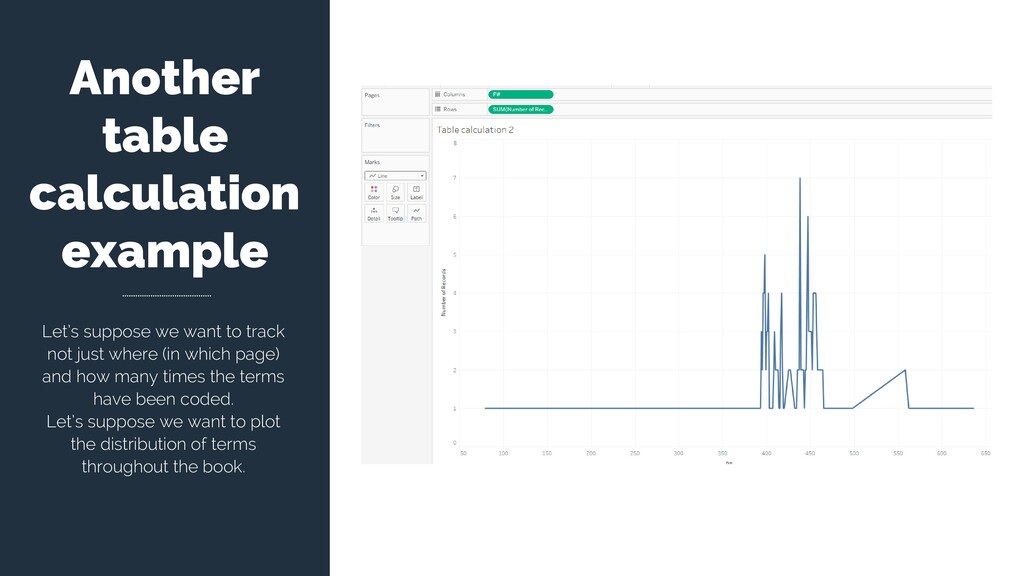
not just where (in which page) and how many times the terms have been coded. Let’s suppose we want to plot the distribution of terms throughout the book.
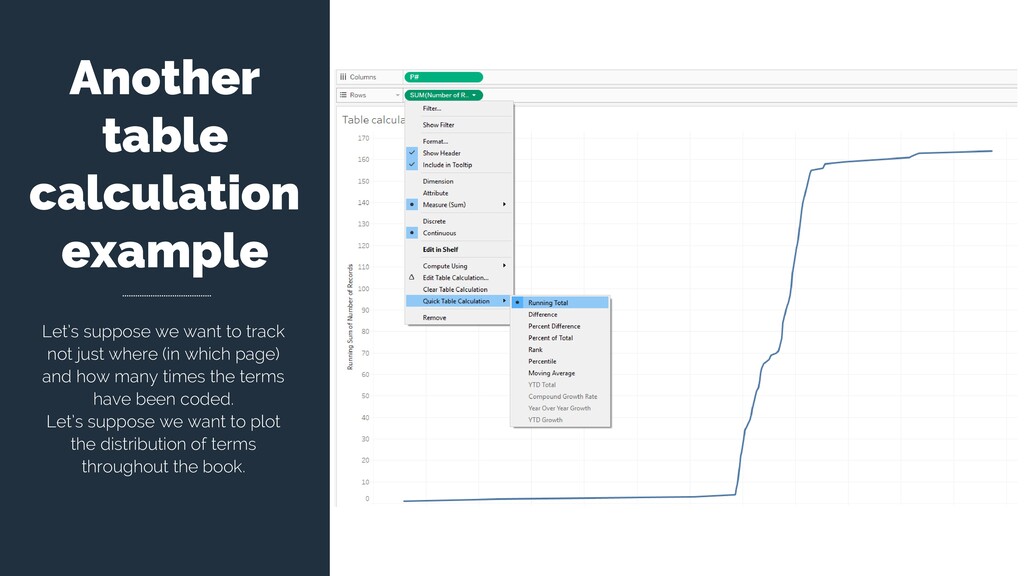
not just where (in which page) and how many times the terms have been coded. Let’s suppose we want to plot the distribution of terms throughout the book.
![For questions or help, write me at: [email protected] THANK YOU](https://files.speakerdeck.com/presentations/15b575e85e204c908bc04a218597a39b/slide_30.jpg)