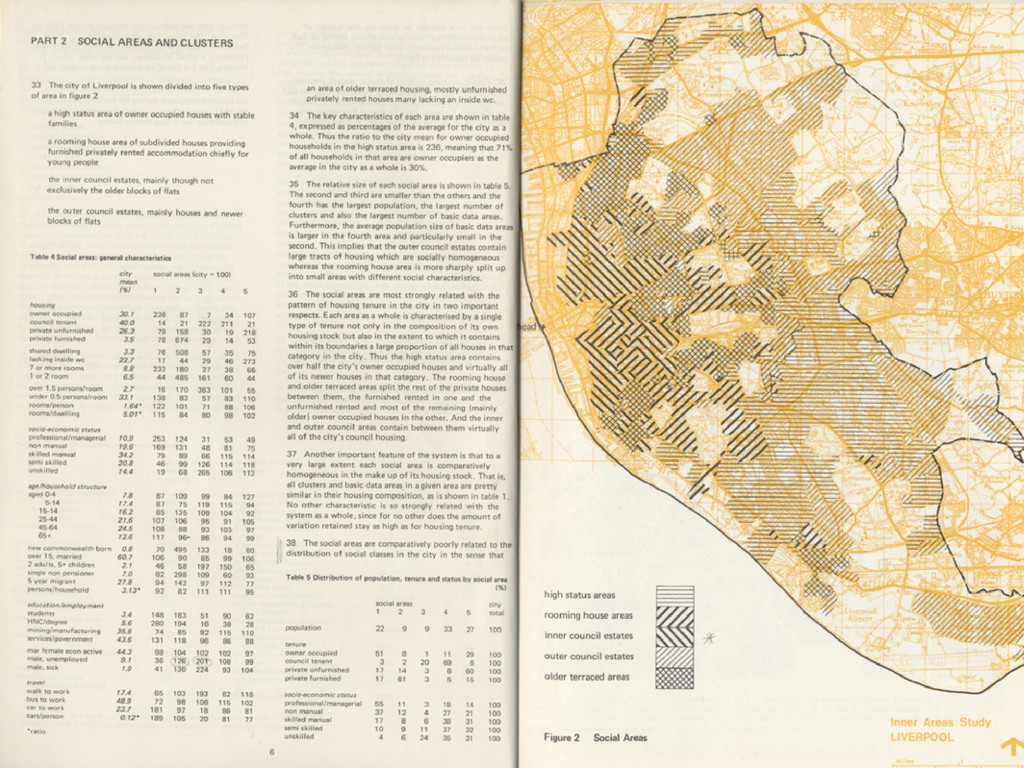
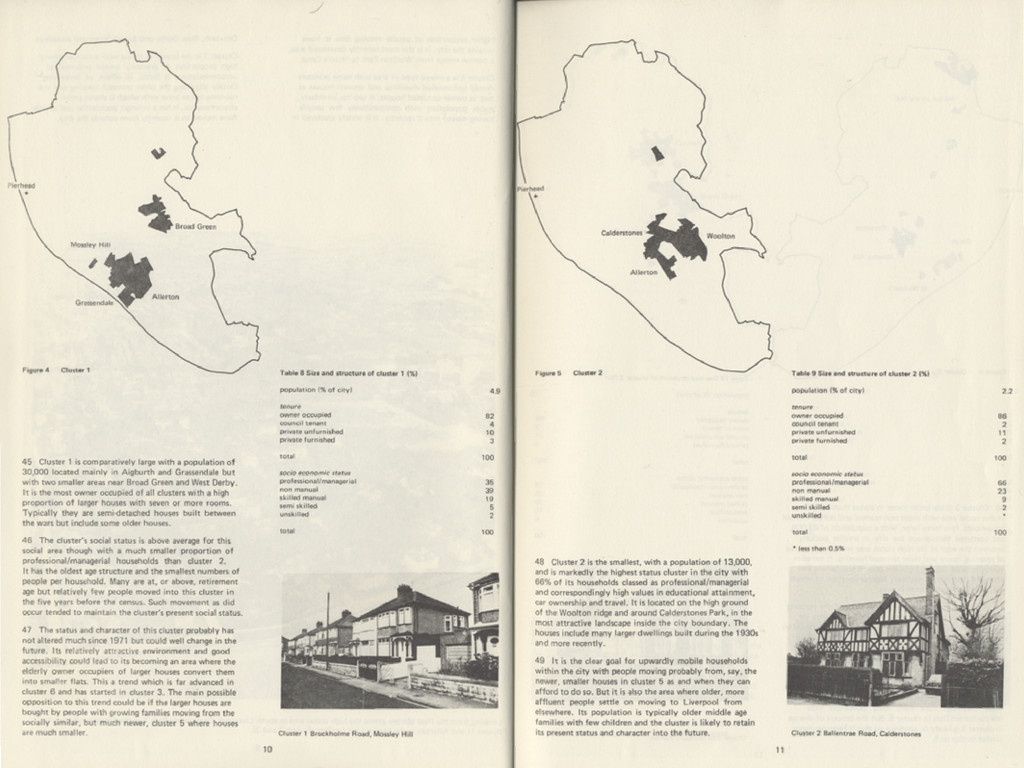
pattern from the detail, without loosing too much of the original information, and which will admit more detailed examination of parts of the pattern which become relevant to a particular issue or local area as and when required” Webber (1978, 275).
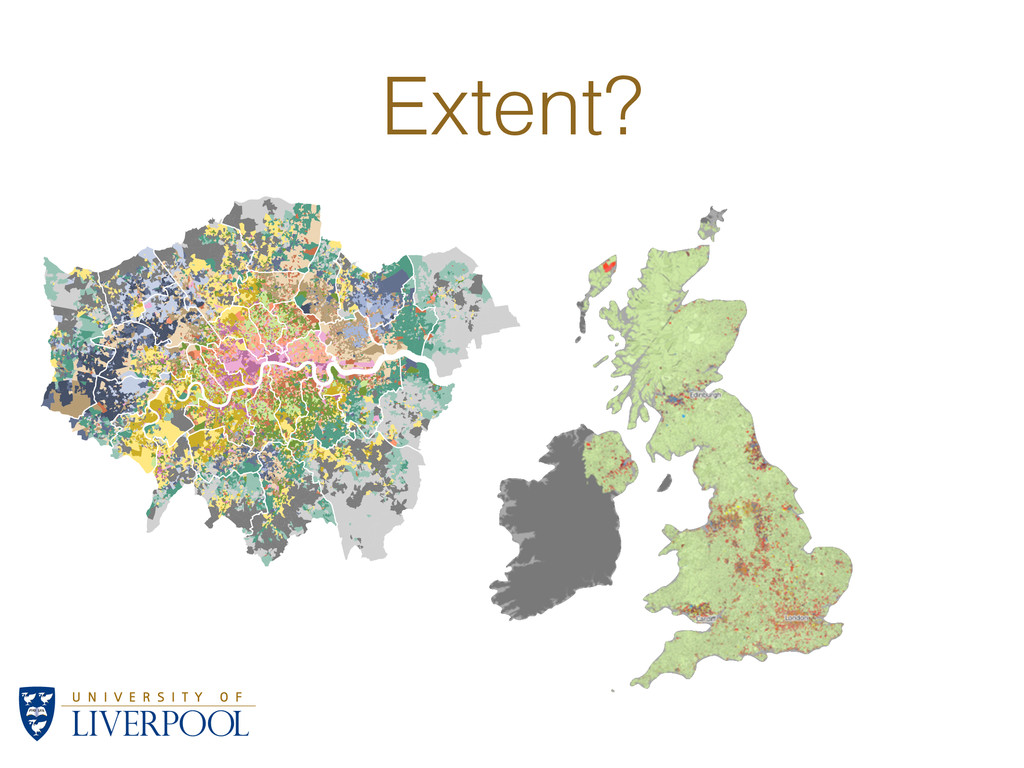
Bangladeshi enclaves B3: Students and minority mix C1: Asian owner occupiers C2: Transport service workers C3: East End Asians C4: Elderly Asians D1: Educational advantage D2: City central E1: City and student fringe E2: Graduation occupation F1: City enclaves F2: Affluent suburbs G1: Affordable transitions G2: Public sector and service employees H1: Detached retirement H2: Not quite Home−Counties Extent?
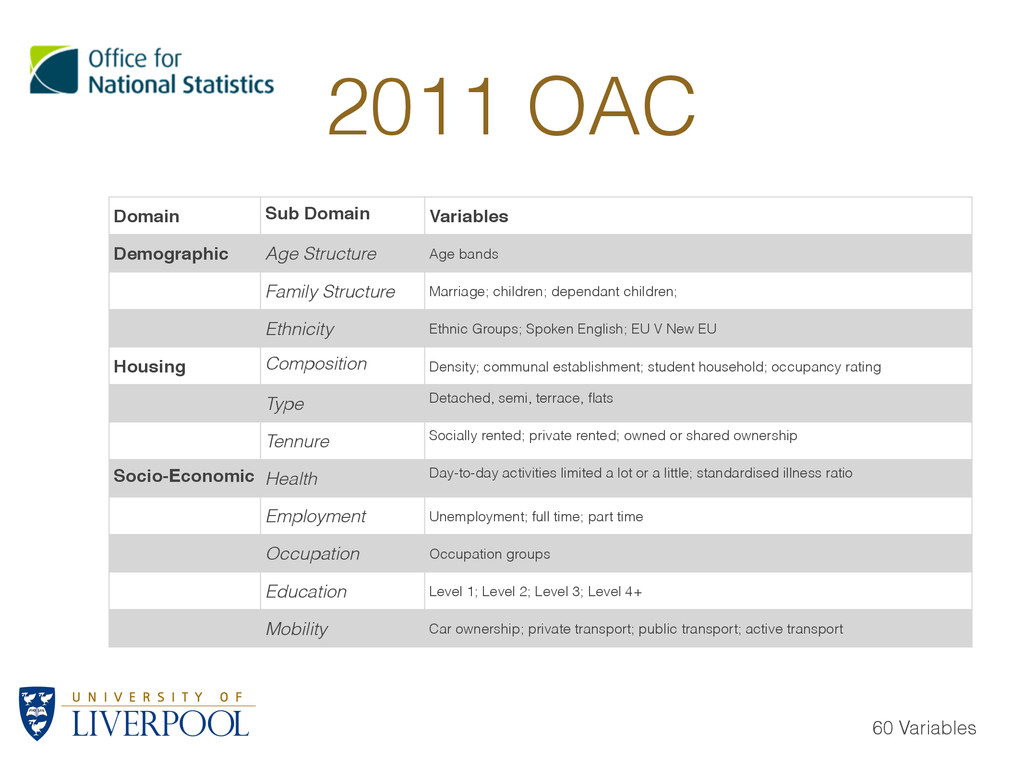
bands Family Structure Marriage; children; dependant children; Ethnicity Ethnic Groups; Spoken English; EU V New EU Housing Composition Density; communal establishment; student household; occupancy rating Type Detached, semi, terrace, flats Tennure Socially rented; private rented; owned or shared ownership Socio-Economic! Health Day-to-day activities limited a lot or a little; standardised illness ratio Employment Unemployment; full time; part time Occupation Occupation groups Education Level 1; Level 2; Level 3; Level 4+ Mobility Car ownership; private transport; public transport; active transport 60 Variables
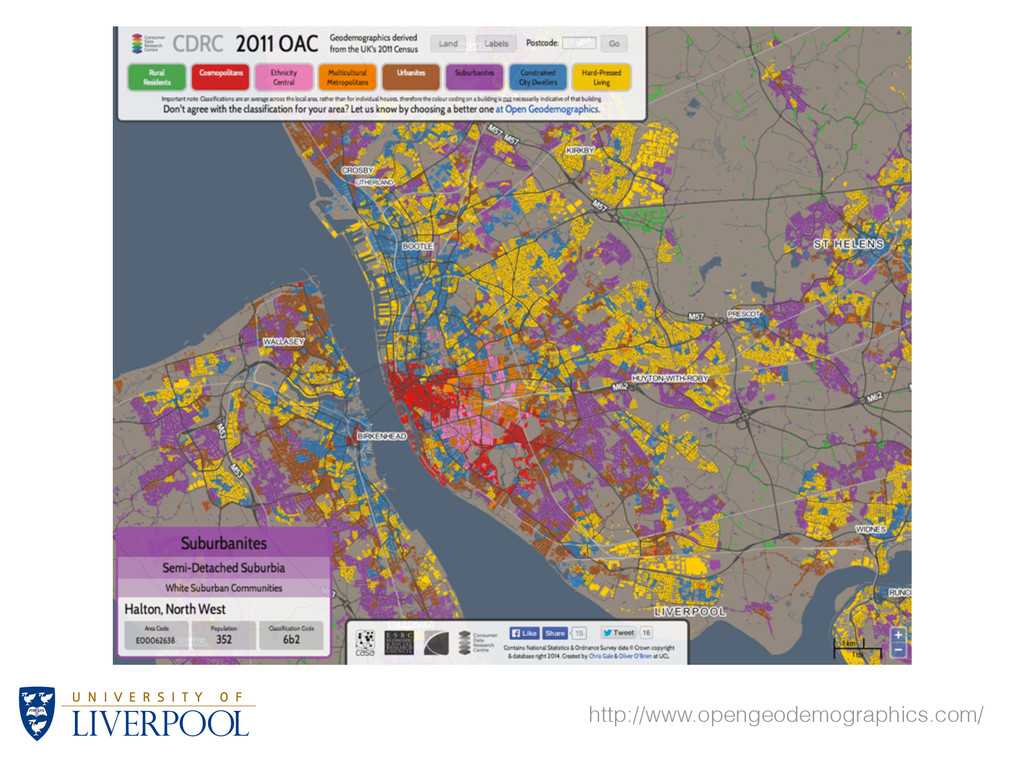
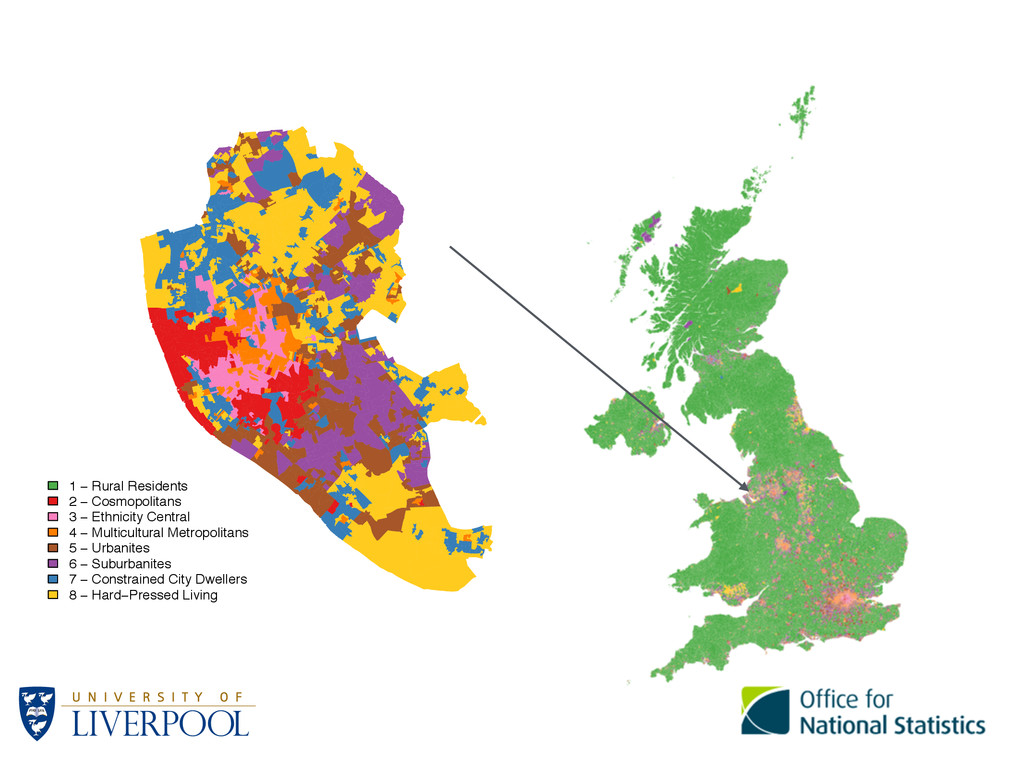
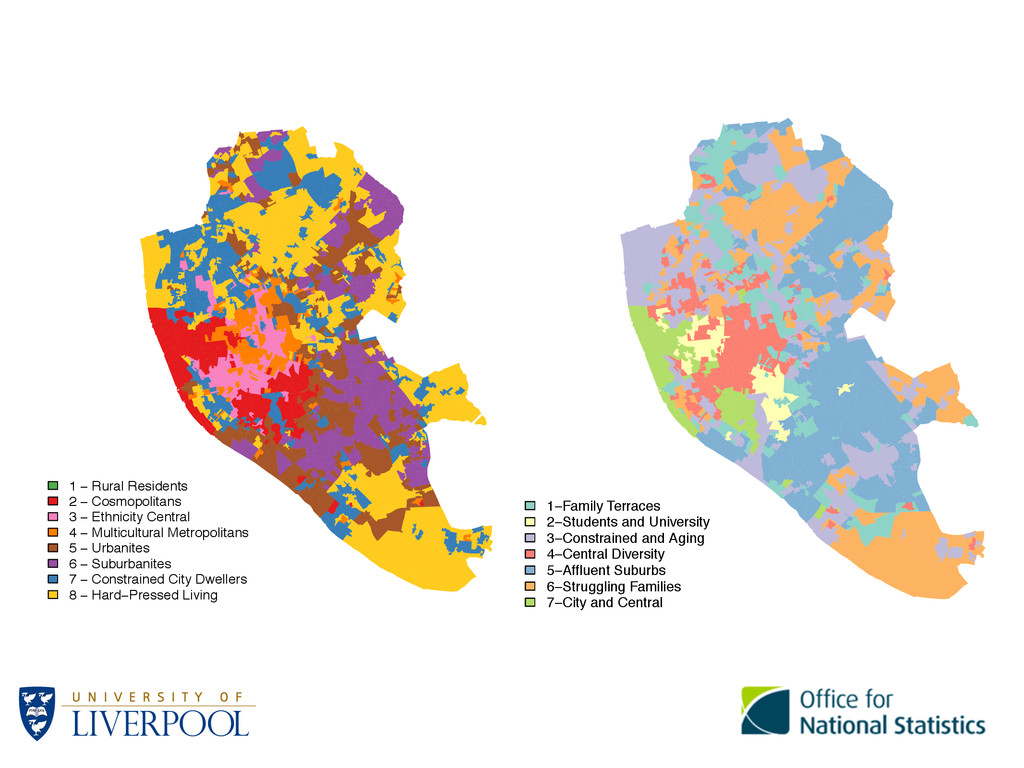
Central 4 − Multicultural Metropolitans 5 − Urbanites 6 − Suburbanites 7 − Constrained City Dwellers 8 − Hard−Pressed Living 1−Family Terraces 2−Students and University 3−Constrained and Aging 4−Central Diversity 5−Affluent Suburbs 6−Struggling Families 7−City and Central
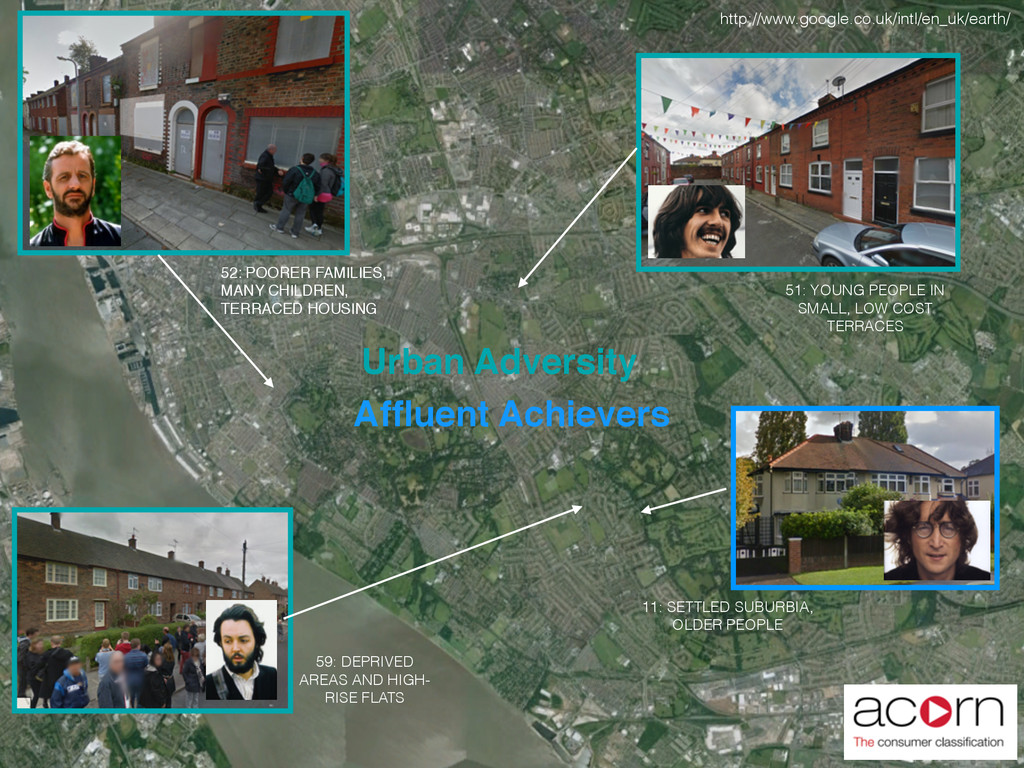
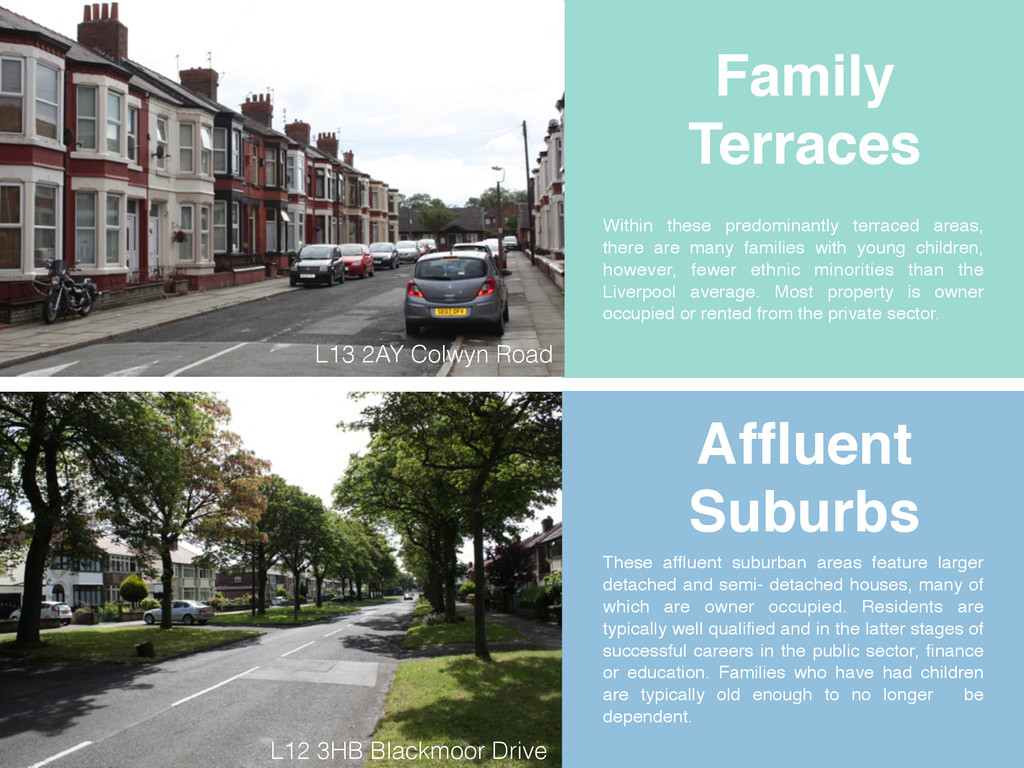
families with young children, however, fewer ethnic minorities than the Liverpool average. Most property is owner occupied or rented from the private sector. L13 2AY Colwyn Road Affluent ! Suburbs These affluent suburban areas feature larger detached and semi- detached houses, many of which are owner occupied. Residents are typically well qualified and in the latter stages of successful careers in the public sector, finance or education. Families who have had children are typically old enough to no longer be dependent. L12 3HB Blackmoor Drive
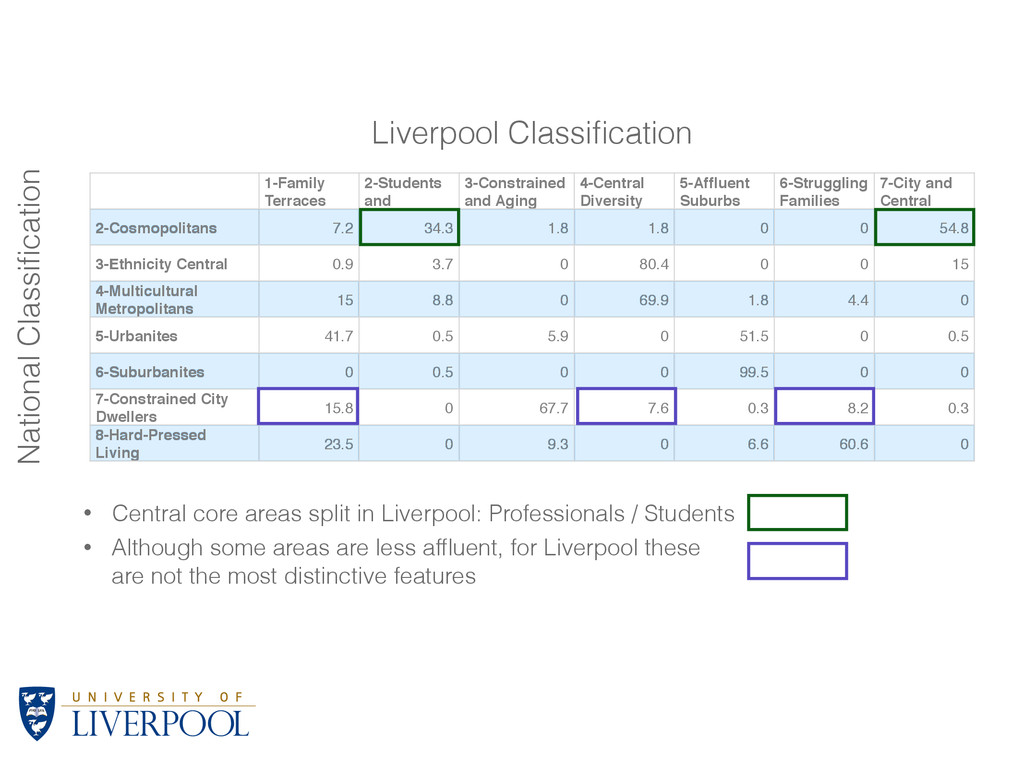
Suburbs 6-Struggling Families 7-City and Central 2-Cosmopolitans 7.2 34.3 1.8 1.8 0 0 54.8 3-Ethnicity Central 0.9 3.7 0 80.4 0 0 15 4-Multicultural Metropolitans 15 8.8 0 69.9 1.8 4.4 0 5-Urbanites 41.7 0.5 5.9 0 51.5 0 0.5 6-Suburbanites 0 0.5 0 0 99.5 0 0 7-Constrained City Dwellers 15.8 0 67.7 7.6 0.3 8.2 0.3 8-Hard-Pressed Living 23.5 0 9.3 0 6.6 60.6 0 Liverpool Classification National Classification • Central core areas split in Liverpool: Professionals / Students • Although some areas are less affluent, for Liverpool these are not the most distinctive features
technique for coding people and the places in which they live • There are numerous classifications • Divergent methods, price, aims, performance • No true geodemographic geography • All representations • Caveat Emptor • User testing and comparison