Upgrade to Pro — share decks privately, control downloads, hide ads and more …

Geography a Thriving or Declining Discipline

alexsingleton
February 26, 2012

Geography a Thriving or Declining Discipline

Presentation at AAG 2012, New York, USA

alexsingleton

February 26, 2012
Tweet

More Decks by alexsingleton

Other Decks in Education

Transcript

  1. Dr Alex D Singleton School of Environmental Sciences Geography: A

    Thriving or Declining Discipline? Based on a forthcoming paper in Geographical Journal: “The Geodemographics of Access and Participation in Geography” The research presented in this paper is funded by an RGS-IBG Ray Y Gildea Jr
  2. Decline in GCSE Geography Year % N 2005 27.5 161,834

    2006 26.8 160,596 2007 26.1 158,820 2008 25.0 152,077 2009 24.8 146,405 ~9.5% fall
  3. Example: GCSE Grade Profiles 2009 GCSE Grade A* % 0.0000

    7.5000 15.0000 22.5000 30.0000 Wealthy Executives Educated Urbanites Settled Suburbia Blue-Collar Roots Inner City Adversity E Entries A* Wealthy Achievers Hard Pressed
  4. HE Progression Rate with 95% Confidence Intervals (%) 0 18

    35 53 70 1 2 3 4 5 6 7 8 9 10 11 12 13 14 15 16 17 18 19 20 21 22 23 24 25 26 27 28 29 30 31 32 33 34 35 36 37 38 39 40 41 42 43 44 45 46 47 48 49 50 51 52 53 54 55 56 Wealthy Achievers Urban Prosperity Comfortably Off Moderate Means Hard Pressed Inner City Adversity Asian Communities Home owning Asian family areas Low income, singles, small rented flats Low income, singles, small rented flats
  5. Statistics • Index Scores – Target / Base * 100

    • Confidence Intervals (Byar’s Approximation) – Lower 95% limit • (observed /expected ) * 100 * ((1- (1/(9 * observed )) - (1.96 / (3* sqrt(observed )))) ^ 3 – Upper 95% limit • ((observed +1)/expected ) * 100 * ((1- (1/(9*(observed +1))) + (1.96/(3* sqrt((observed +1)))))^3
  6. KS5 + FE (16-18) 0 10 20 30 40 50

    60 70 80 90 100 110 120 130 140 150 160 Wealthy Executives (1) Affluent Greys (1) Flourishing Families (1) Prosperous Professionals (2) Educated Urbanites (2) Aspiring Singles (2) Starting Out (3) Secure Families (3) Settled Suburbia (3) Prudent Pensioners (3) Asian Communities (4) Post-Industrial Families (4) Blue-Collar Roots (4) Struggling Families (5) Burdened Singles (5) High-Rise Hardship (5) Inner City Adversity (5) Index Score (100 = National Average) KS5 FE
  7. 100% Drop 0 100 200 300 400 500 600 Wealthy

    Executives (1) Affluent Greys (1) Flourishing Families (1) Prosperous Professionals (2) Educated Urbanites (2) Aspiring Singles (2) Starting Out (3) Secure Families (3) Settled Suburbia (3) Prudent Pensioners (3) Asian Communities (4) Post-Industrial Families (4) Blue-Collar Roots (4) Struggling Families (5) Burdened Singles (5) High-Rise Hardship (5) Inner City Adversity (5) Index Score (100 = National Average)
  8. Asian Communities These are poor urban areas where poorly paid

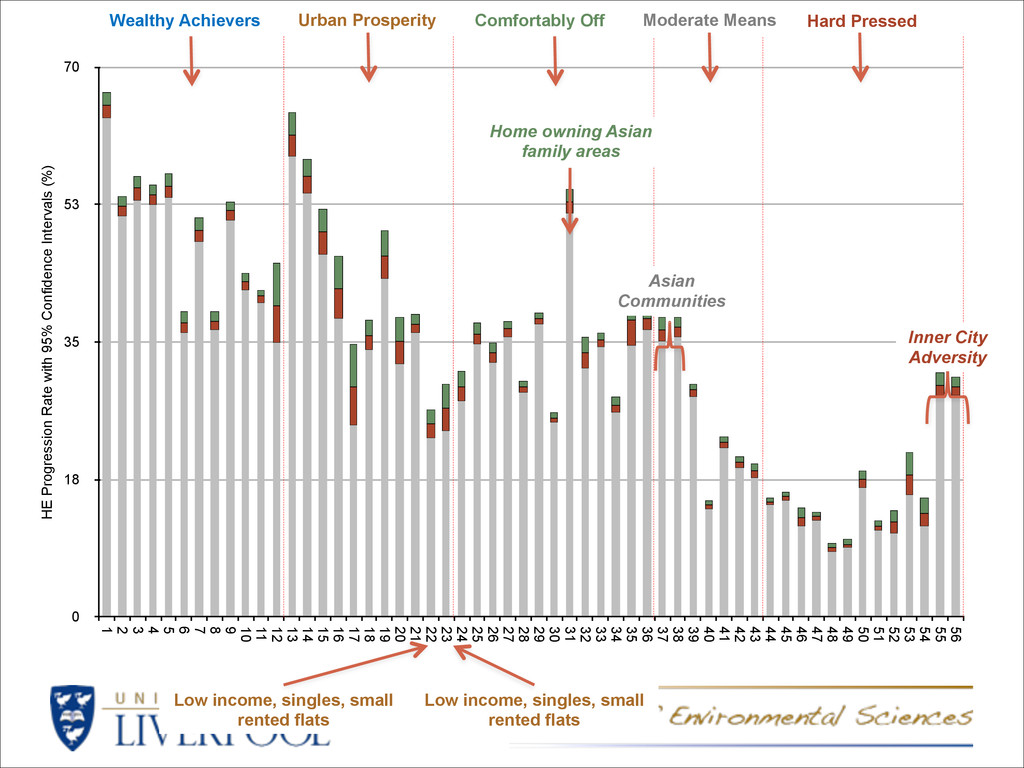
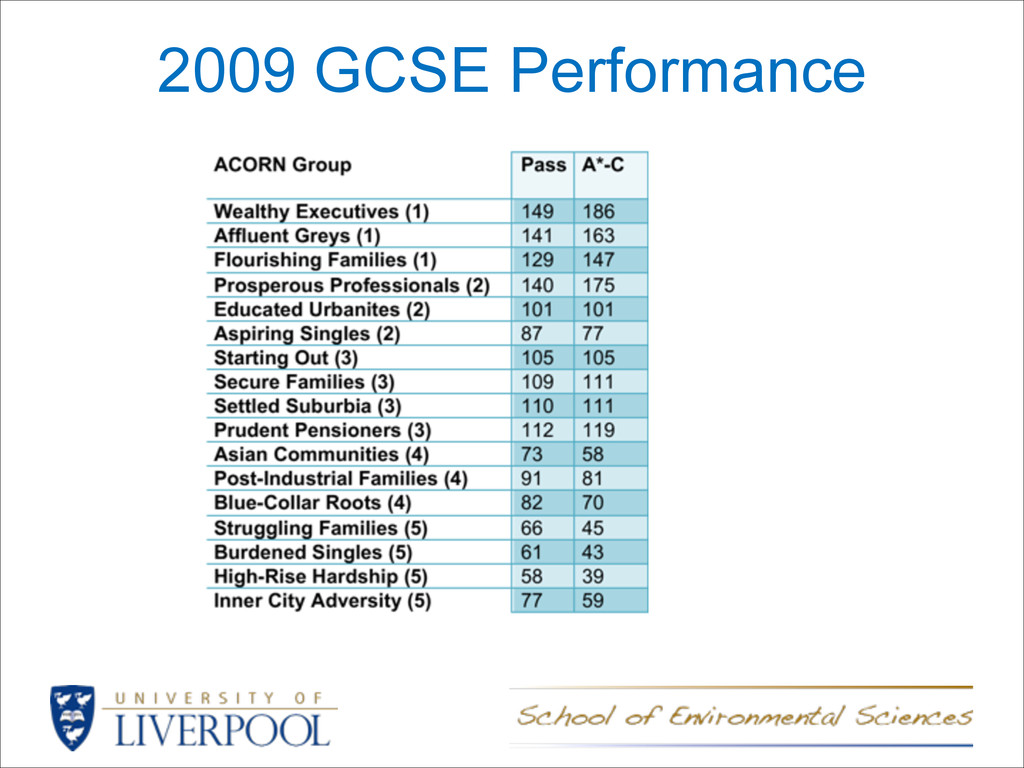
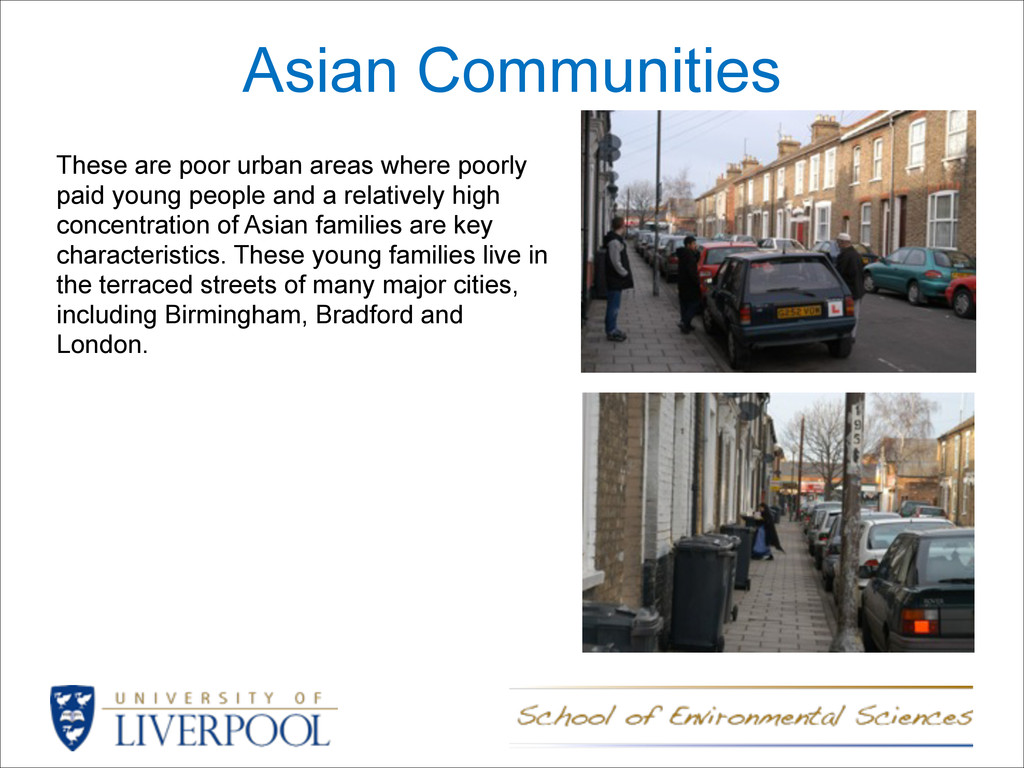
    young people and a relatively high concentration of Asian families are key characteristics. These young families live in the terraced streets of many major cities, including Birmingham, Bradford and London.
  9. 100% Drop 0 100 200 300 400 500 600 Bangladeshi

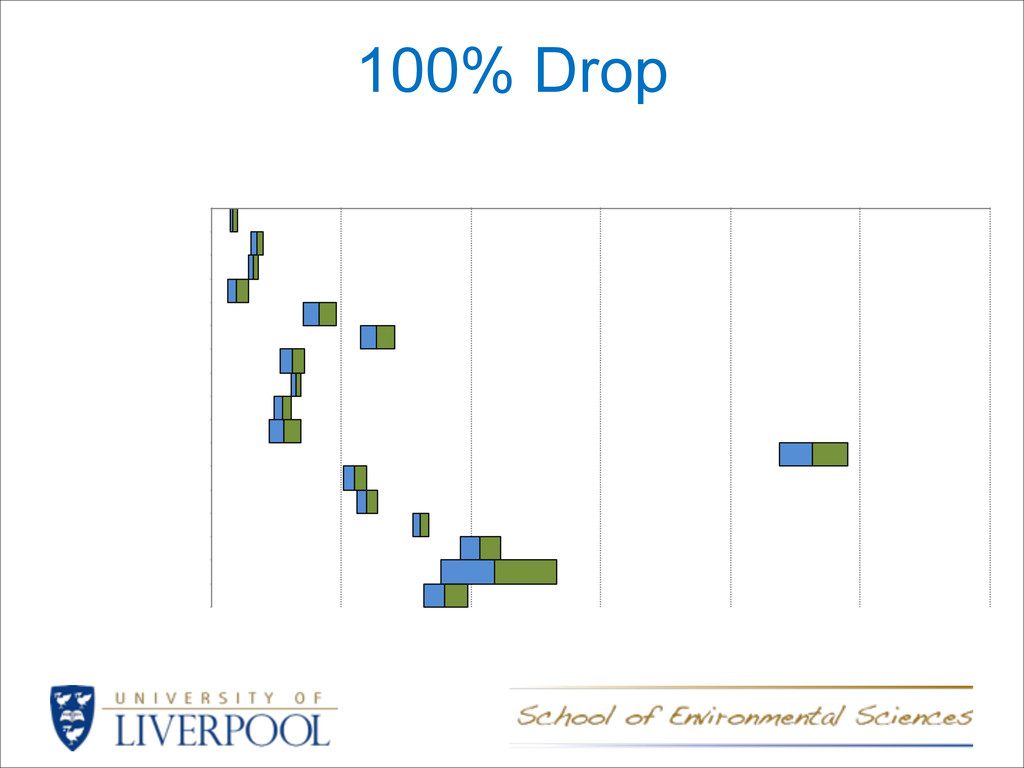
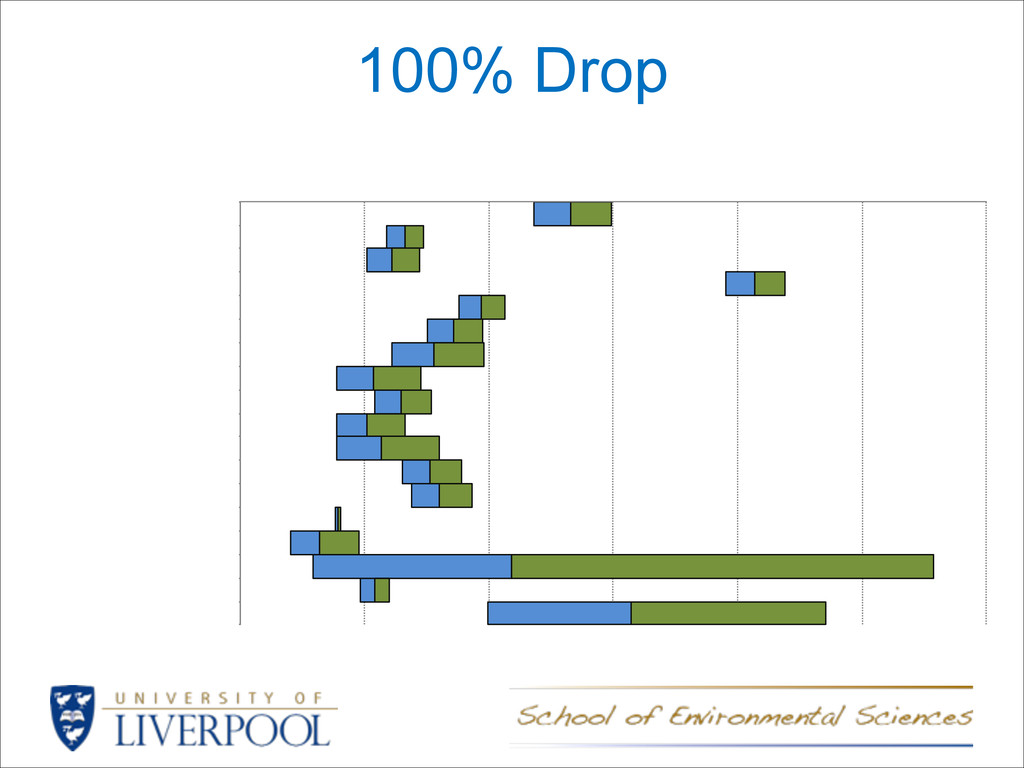
    Indian Any Other Asian Background Pakistani Black - African Black Caribbean Any Other Black Background Chinese Any Other Mixed Background White and Asian White and Black African White and Black Caribbean Any Other Ethnic Group White - British White - Irish Traveller of Irish Heritage Any Other White Background Gypsy / Roma Index Score (100 = National Average)
  10. Participation & Index Change 05 - 09 Wealthy Executives Affluent

    Greys Flourishing Families Prosperous Professionals Educated Urbanites Aspiring Singles Starting Out Secure Families Settled Suburbia Prudent Pensioners Asian Communities Post-Industrial Families Blue-Collar Roots Struggling Families Burdened Singles High-Rise Hardship Inner City Adversity -10 -5 0 5 10 15 20 50 70 90 110 130 150 170 Index Change Index Score (Average 100)
  11. Mitigating Decline • Action Plan for Geography – Royal Geographical

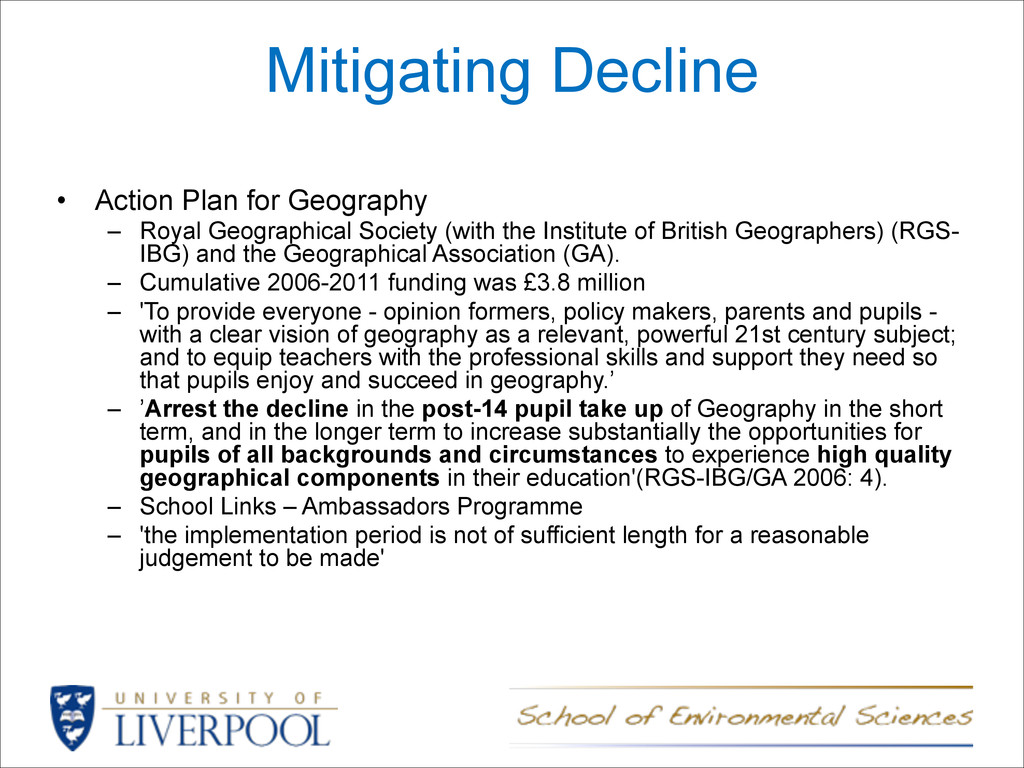
    Society (with the Institute of British Geographers) (RGS- IBG) and the Geographical Association (GA). – Cumulative 2006-2011 funding was £3.8 million – 'To provide everyone - opinion formers, policy makers, parents and pupils - with a clear vision of geography as a relevant, powerful 21st century subject; and to equip teachers with the professional skills and support they need so that pupils enjoy and succeed in geography.’ – ’Arrest the decline in the post-14 pupil take up of Geography in the short term, and in the longer term to increase substantially the opportunities for pupils of all backgrounds and circumstances to experience high quality geographical components in their education'(RGS-IBG/GA 2006: 4). – School Links – Ambassadors Programme – 'the implementation period is not of sufficient length for a reasonable judgement to be made'
  12. English Baccalaureate (Ebacc) • Introduced by the Department for Education

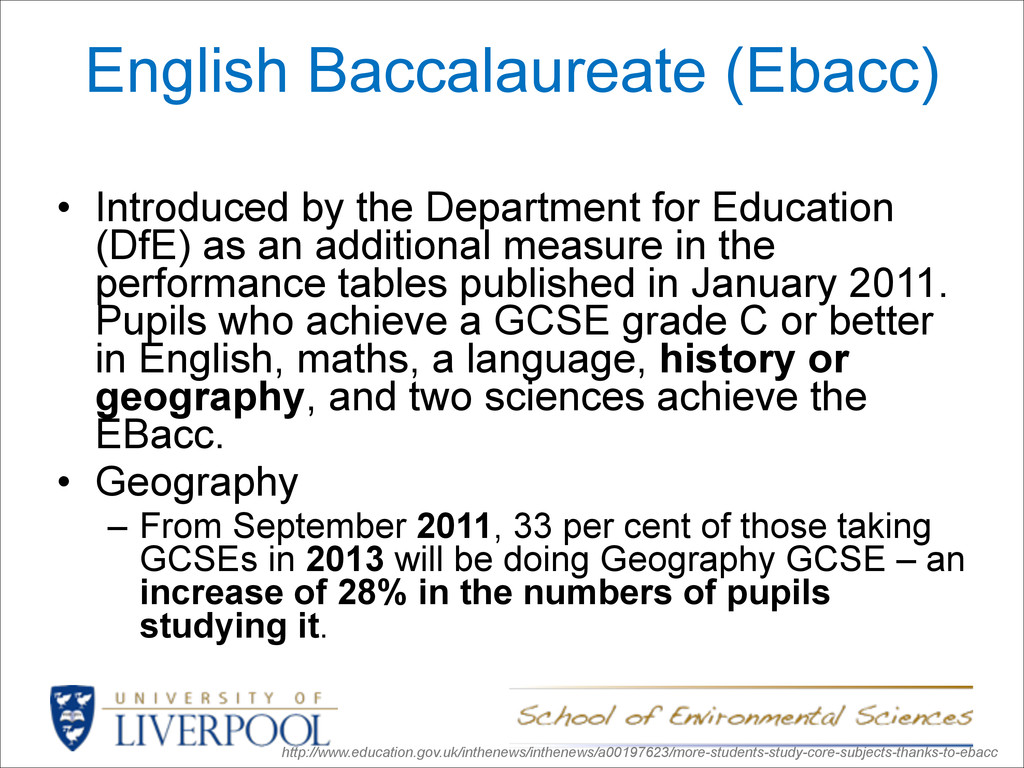
    (DfE) as an additional measure in the performance tables published in January 2011. Pupils who achieve a GCSE grade C or better in English, maths, a language, history or geography, and two sciences achieve the EBacc. • Geography – From September 2011, 33 per cent of those taking GCSEs in 2013 will be doing Geography GCSE – an increase of 28% in the numbers of pupils studying it. http://www.education.gov.uk/inthenews/inthenews/a00197623/more-students-study-core-subjects-thanks-to-ebacc
  13. Process • Lookup average distance geodemographic group travels to selected

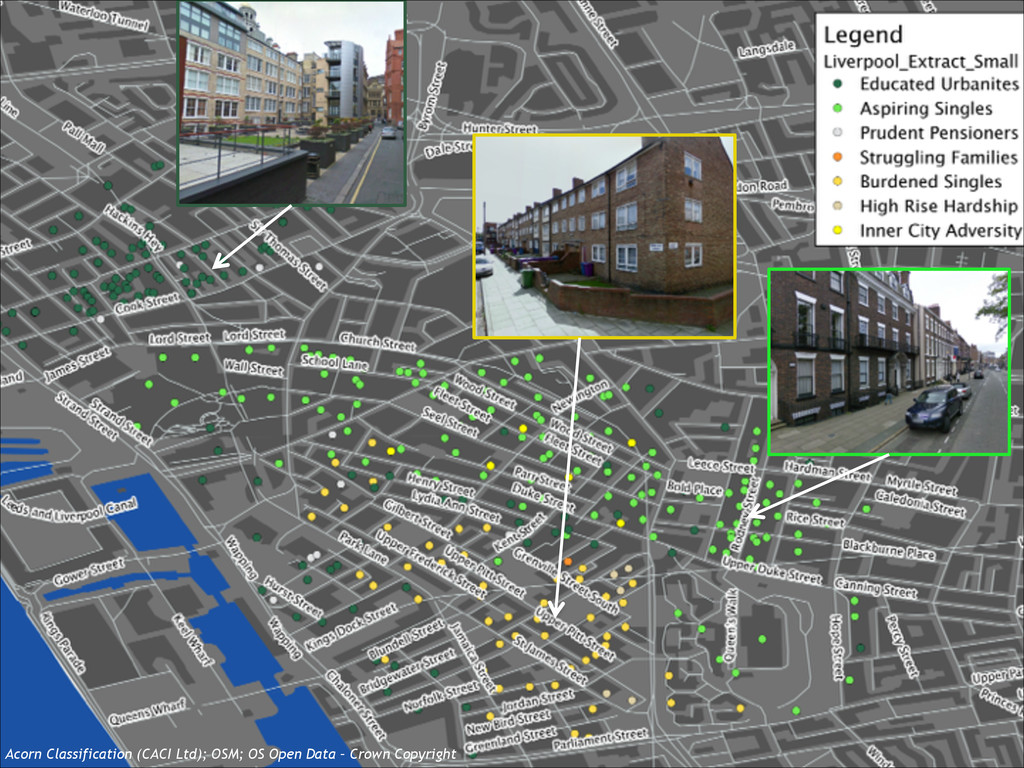
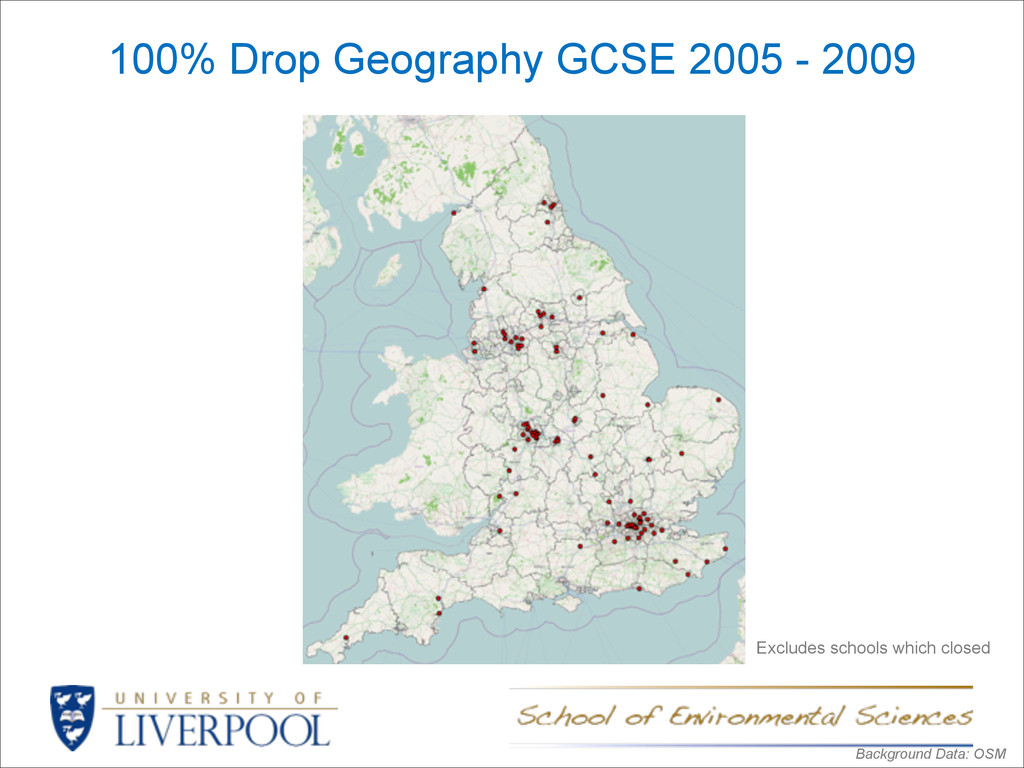
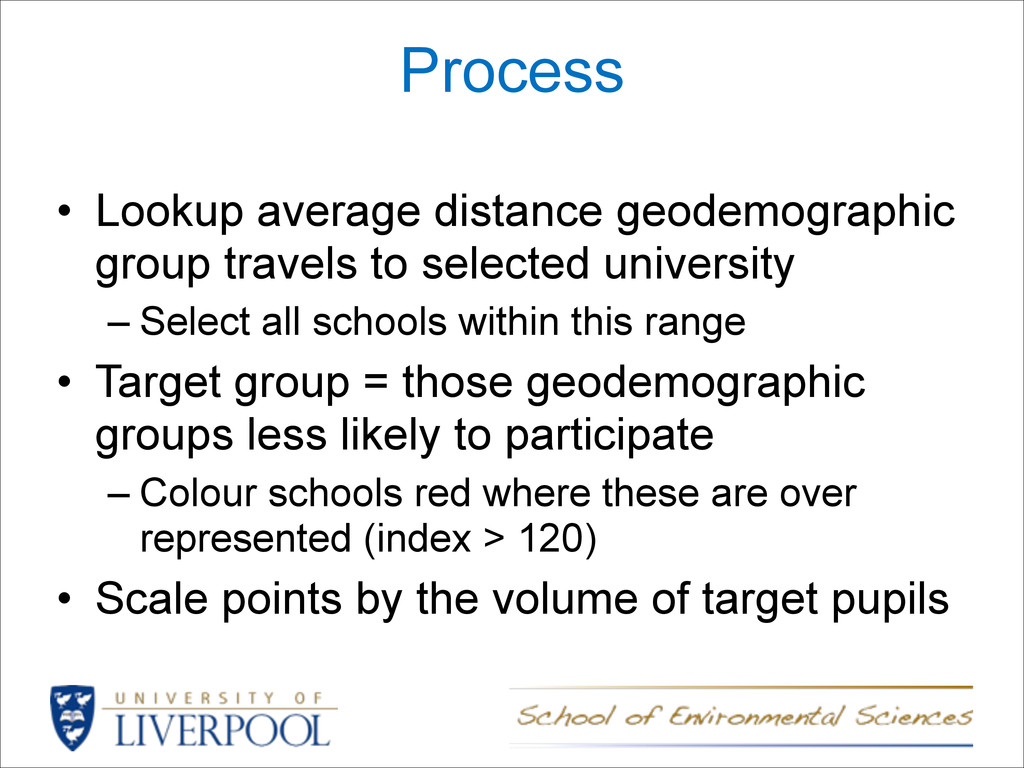
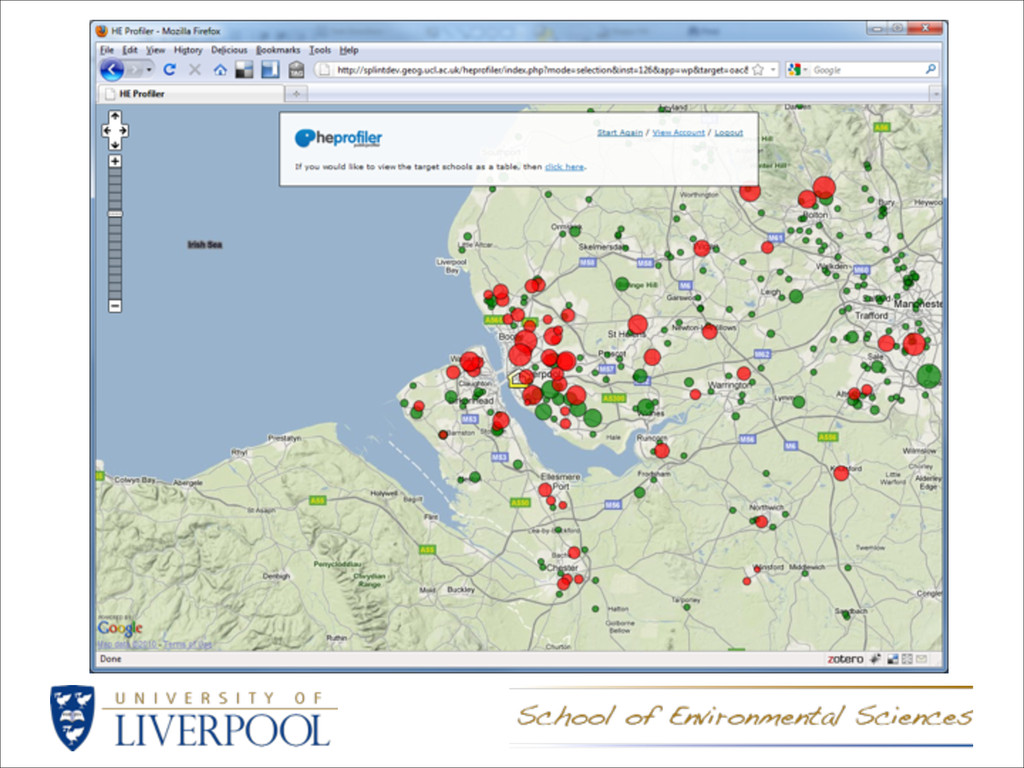
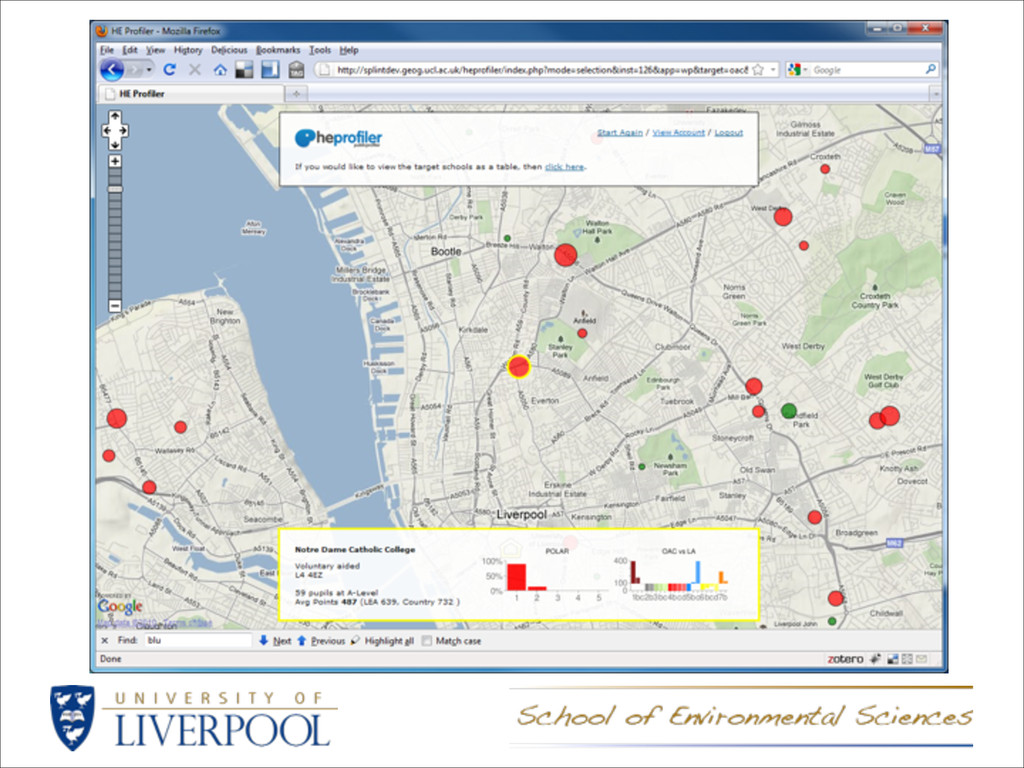
    university – Select all schools within this range • Target group = those geodemographic groups less likely to participate – Colour schools red where these are over represented (index > 120) • Scale points by the volume of target pupils