Amol Deshpande Associate Professor Department of Computer Science and UMIACS University of Maryland at College Park Joint work with many students and collaborators These slides at: http://ter.ps/a37
l Sensing devices and sensor networks (IoT) that can monitor everything from temperature to pollu5on to vital signs 24/7 l Increasingly sophis5cated smart phones l Internet, social networks making it very easy to publish data l Scien5fic experiments and simula5ons l Many aspects of life being turned into data (“dataifica5on”) l “Big Data” (= extrac5ng knowledge and insights from data) becoming fundamental l Science, business, poli5cs -‐-‐ largely driven by data and analy5cs l Many others (Educa5on, Social Good) are slowly being Big Data
scale of data certainly poses many problems l But most datasets are pre?y small (10GB-‐500GB)… l Variety and heterogeneity in both data and applica5ons l Text, networks, 5me series, nested/hierarchical, mul5media, … l Increasingly complex and specialized analysis tasks l Velocity l Data generated at very high rates and o[en needs to be processed in real 5me l Veracity l What/who to trust? How to reason about data quality issues? l Easy to draw wrong sta5s5cal conclusions from large datasets l Issues becoming more important with increasing automa5on… Four V’s of Big Data
managing and analyzing big data by.. l Designing intui5ve, formal, and declara5ve abstrac5ons to empower users, and l Developing scalable pla)orms and algorithms to support those abstrac5ons over large volumes of data l Major research thrusts over the last 10 years l Uncertain and probabilis5c data management l Graph data management l Data management in the cloud l Collabora5ve data analy5cs l Query processing and op5miza5on Focus of My Research Group at UMD
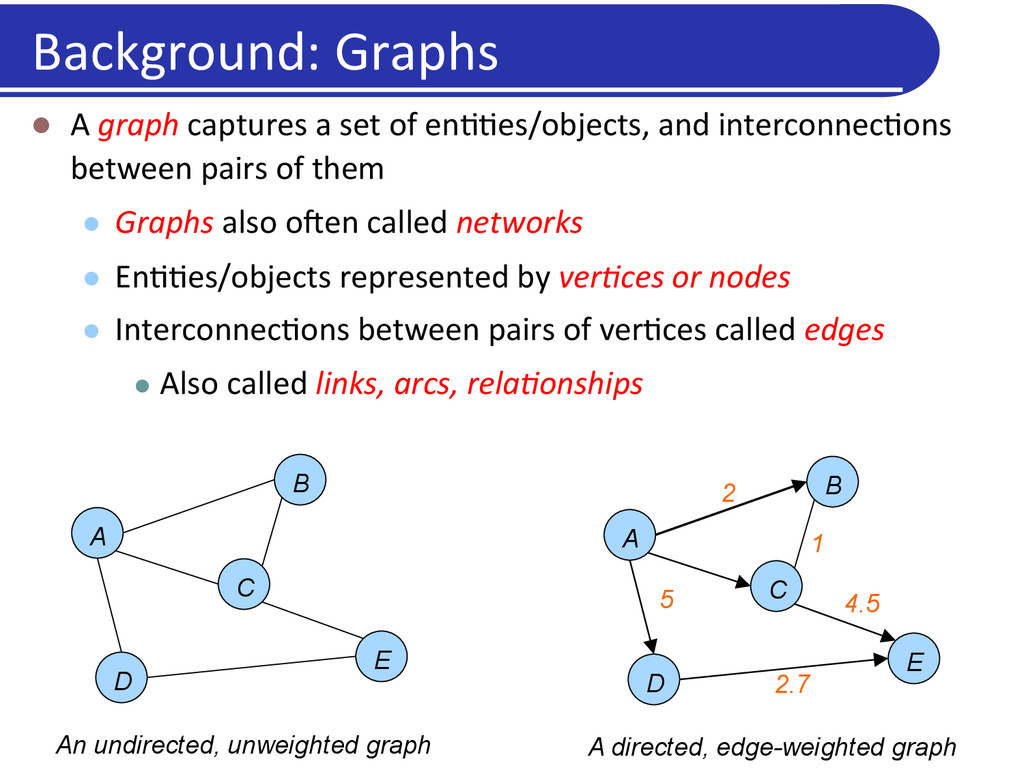
between pairs of them l Graphs also o[en called networks l En55es/objects represented by ver@ces or nodes l Interconnec5ons between pairs of ver5ces called edges l Also called links, arcs, rela@onships Background: Graphs A B D C E An undirected, unweighted graph A B D C E A directed, edge-weighted graph 2 1 4.5 2.7 5
between pairs of them l Graphs also o[en called networks l En55es/objects represented by ver@ces or nodes l Interconnec5ons between pairs of ver5ces called edges l Also called links, arcs, rela@onships l Graph theory, graph algorithms very well studied in Computer Science l Not as much work on managing large volumes of graph-‐ structured data, or doing analy5cs over them Background: Graphs
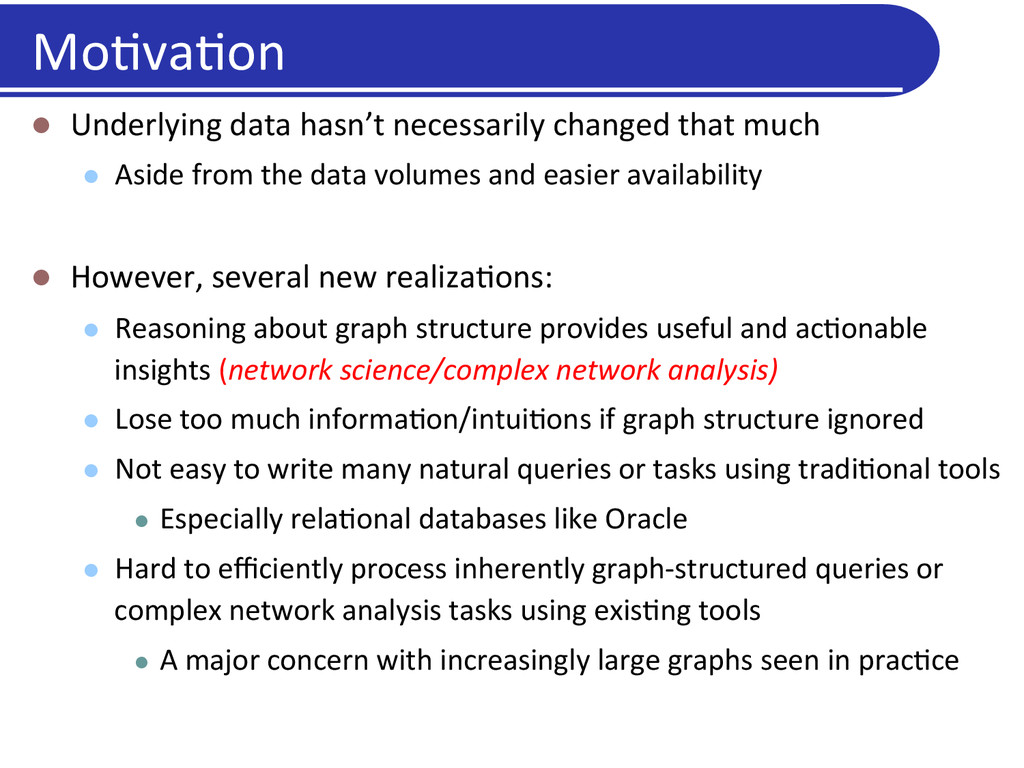
Aside from the data volumes and easier availability l However, several new realiza5ons: l Reasoning about graph structure provides useful and ac5onable insights (network science/complex network analysis) l Lose too much informa5on/intui5ons if graph structure ignored l Not easy to write many natural queries or tasks using tradi5onal tools l Especially rela5onal databases like Oracle l Hard to efficiently process inherently graph-‐structured queries or complex network analysis tasks using exis5ng tools l A major concern with increasingly large graphs seen in prac5ce Mo5va5on
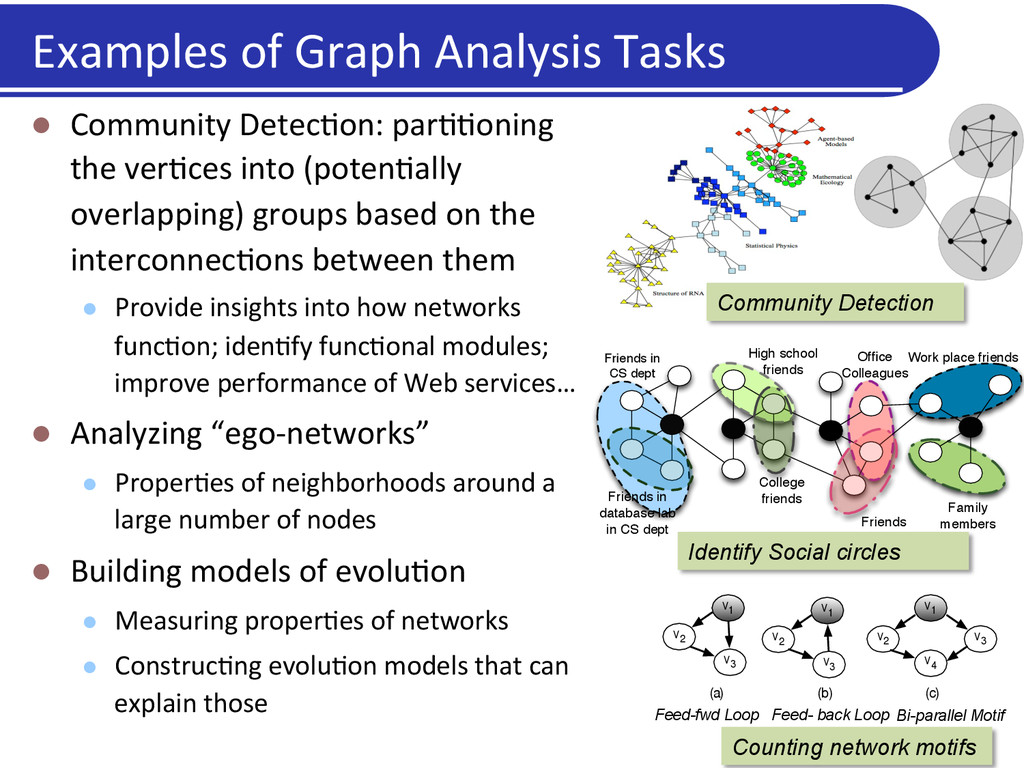
overlapping) groups based on the interconnec5ons between them l Provide insights into how networks func5on; iden5fy func5onal modules; improve performance of Web services… l Analyzing “ego-‐networks” l Proper5es of neighborhoods around a large number of nodes l Building models of evolu5on l Measuring proper5es of networks l Construc5ng evolu5on models that can explain those Examples of Graph Analysis Tasks Community Detection High school friends Family members Office Colleagues Friends College friends Friends in database lab in CS dept Friends in CS dept Work place friends Identify Social circles V2 V1 V3 V2 V1 V3 V1 V2 V3 V4 (a) (b) (c) Counting network motifs Feed-fwd Loop Feed- back Loop Bi-parallel Motif
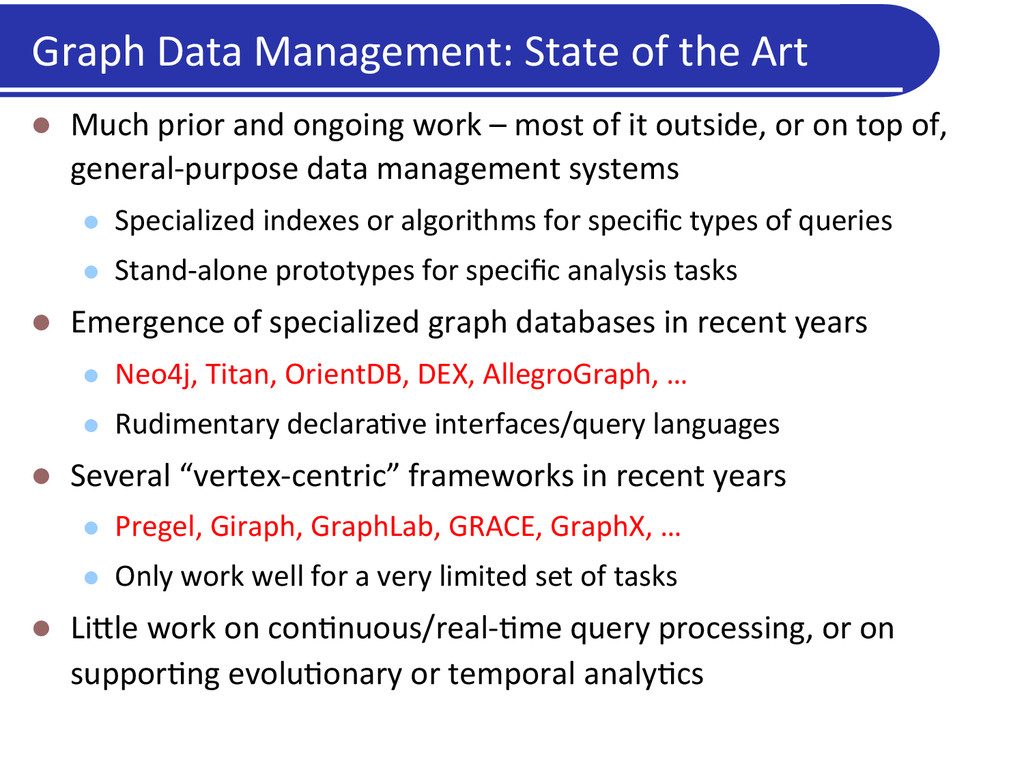
prior and ongoing work – most of it outside, or on top of, general-‐purpose data management systems l Specialized indexes or algorithms for specific types of queries l Stand-‐alone prototypes for specific analysis tasks l Emergence of specialized graph databases in recent years l Neo4j, Titan, OrientDB, DEX, AllegroGraph, … l Rudimentary declara5ve interfaces/query languages l Several “vertex-‐centric” frameworks in recent years l Pregel, Giraph, GraphLab, GRACE, GraphX, … l Only work well for a very limited set of tasks l Li?le work on con5nuous/real-‐5me query processing, or on suppor5ng evolu5onary or temporal analy5cs
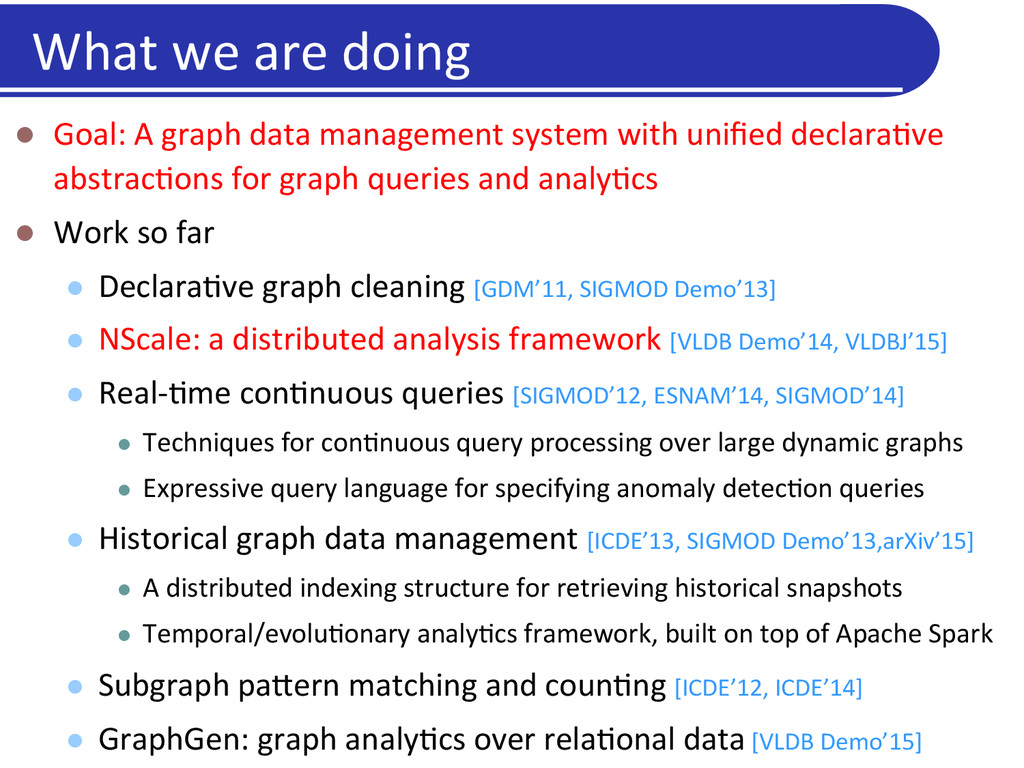
abstrac5ons for graph queries and analy5cs l Work so far l Declara5ve graph cleaning [GDM’11, SIGMOD Demo’13] l NScale: a distributed analysis framework [VLDB Demo’14, VLDBJ’15] l Real-‐5me con5nuous queries [SIGMOD’12, ESNAM’14, SIGMOD’14] l Techniques for con5nuous query processing over large dynamic graphs l Expressive query language for specifying anomaly detec5on queries l Historical graph data management [ICDE’13, SIGMOD Demo’13,arXiv’15] l A distributed indexing structure for retrieving historical snapshots l Temporal/evolu5onary analy5cs framework, built on top of Apache Spark l Subgraph pa?ern matching and coun5ng [ICDE’12, ICDE’14] l GraphGen: graph analy5cs over rela5onal data [VLDB Demo’15] What we are doing
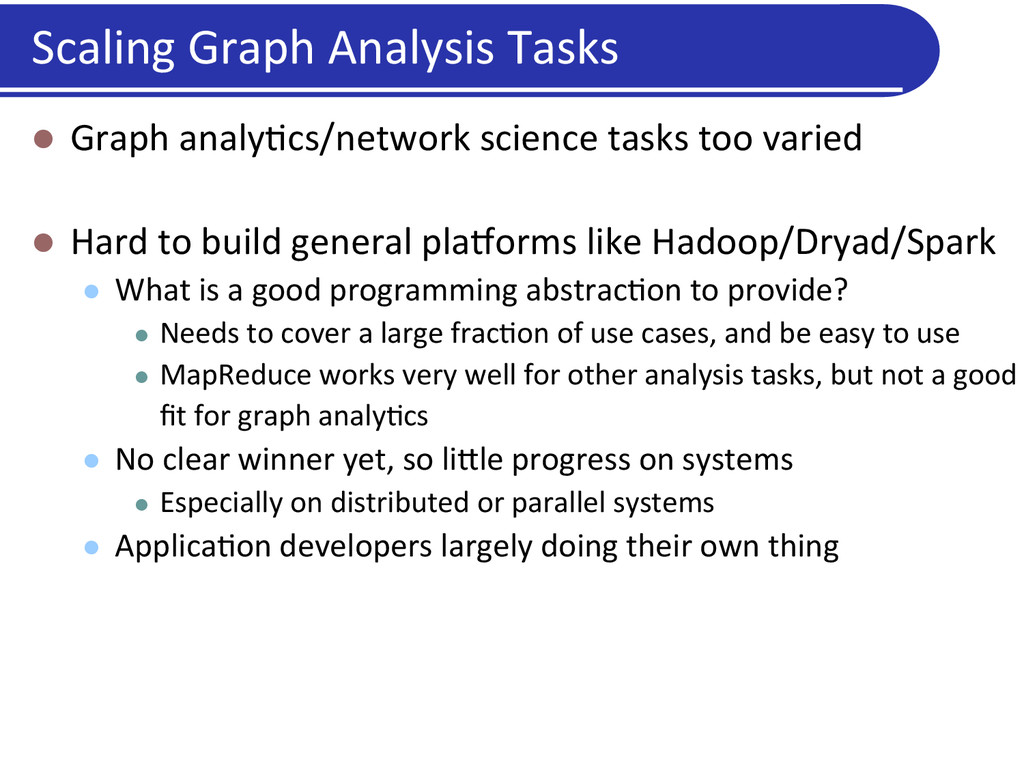
to build general pla)orms like Hadoop/Dryad/Spark l What is a good programming abstrac5on to provide? l Needs to cover a large frac5on of use cases, and be easy to use l MapReduce works very well for other analysis tasks, but not a good fit for graph analy5cs l No clear winner yet, so li?le progress on systems l Especially on distributed or parallel systems l Applica5on developers largely doing their own thing Scaling Graph Analysis Tasks
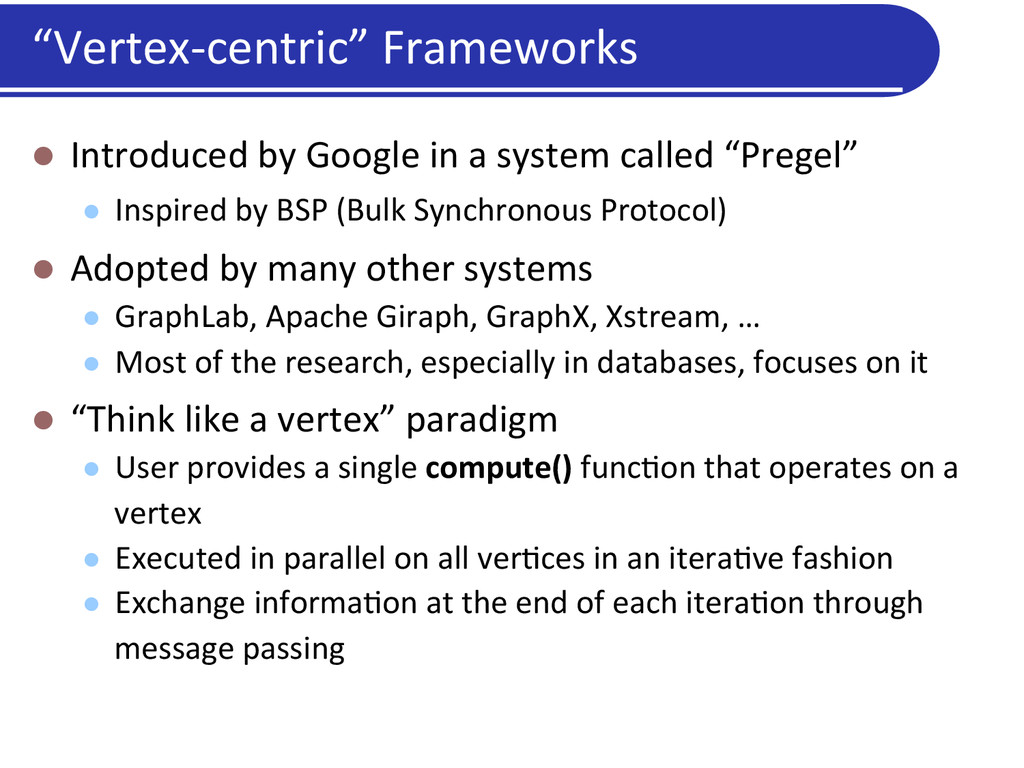
l Inspired by BSP (Bulk Synchronous Protocol) l Adopted by many other systems l GraphLab, Apache Giraph, GraphX, Xstream, … l Most of the research, especially in databases, focuses on it l “Think like a vertex” paradigm l User provides a single compute() func5on that operates on a vertex l Executed in parallel on all ver5ces in an itera5ve fashion l Exchange informa5on at the end of each itera5on through message passing “Vertex-‐centric” Frameworks
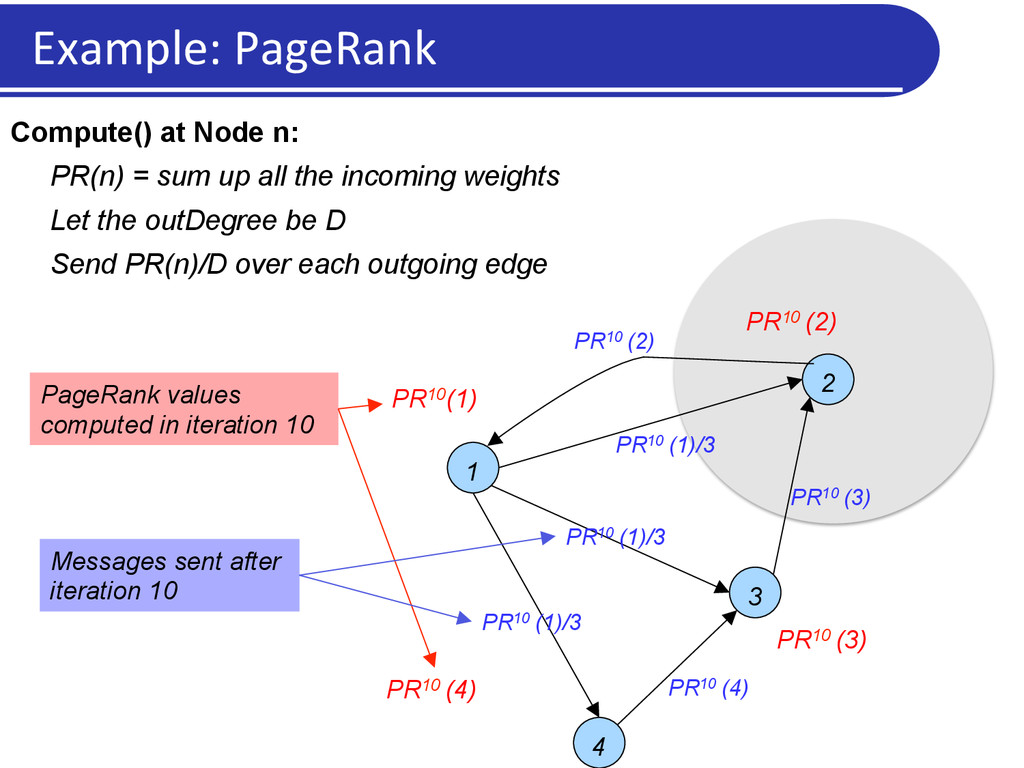
(2) PR10 (3) PR10 (4) Compute() at Node n: PR(n) = sum up all the incoming weights Let the outDegree be D Send PR(n)/D over each outgoing edge PageRank values computed in iteration 10 PR10 (3) PR10 (1)/3 PR10 (1)/3 PR10 (1)/3 PR10 (2) PR10 (4) Messages sent after iteration 10
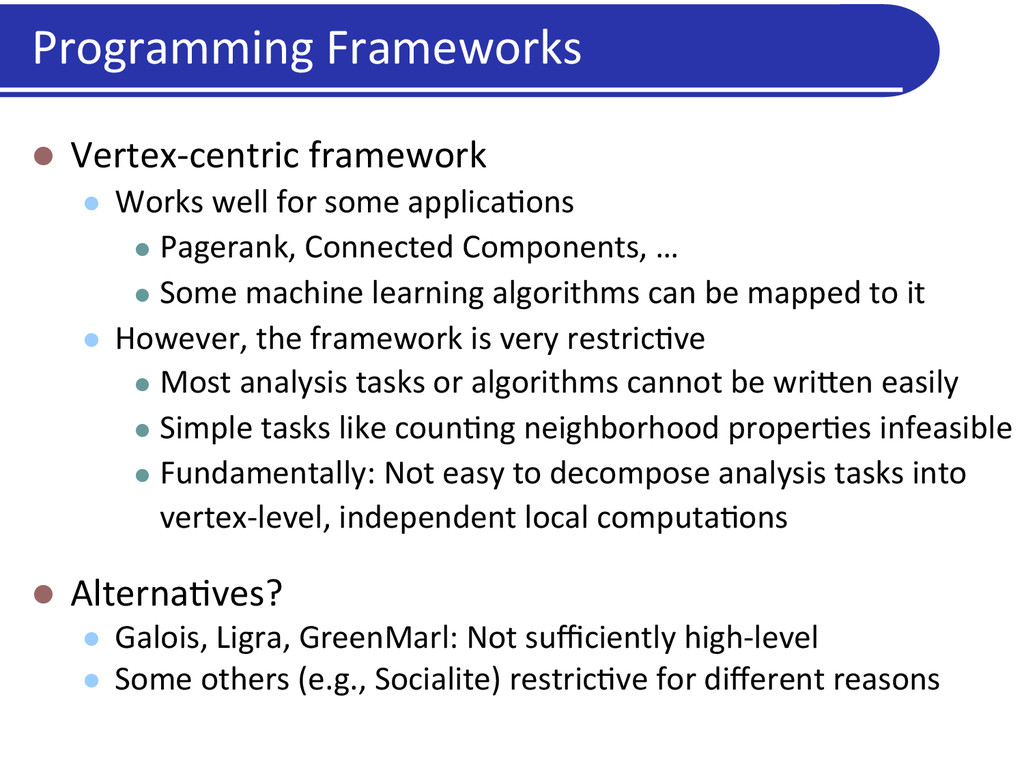
l Pagerank, Connected Components, … l Some machine learning algorithms can be mapped to it l However, the framework is very restric5ve l Most analysis tasks or algorithms cannot be wri?en easily l Simple tasks like coun5ng neighborhood proper5es infeasible l Fundamentally: Not easy to decompose analysis tasks into vertex-‐level, independent local computa5ons l Alterna5ves? l Galois, Ligra, GreenMarl: Not sufficiently high-‐level l Some others (e.g., Socialite) restric5ve for different reasons Programming Frameworks
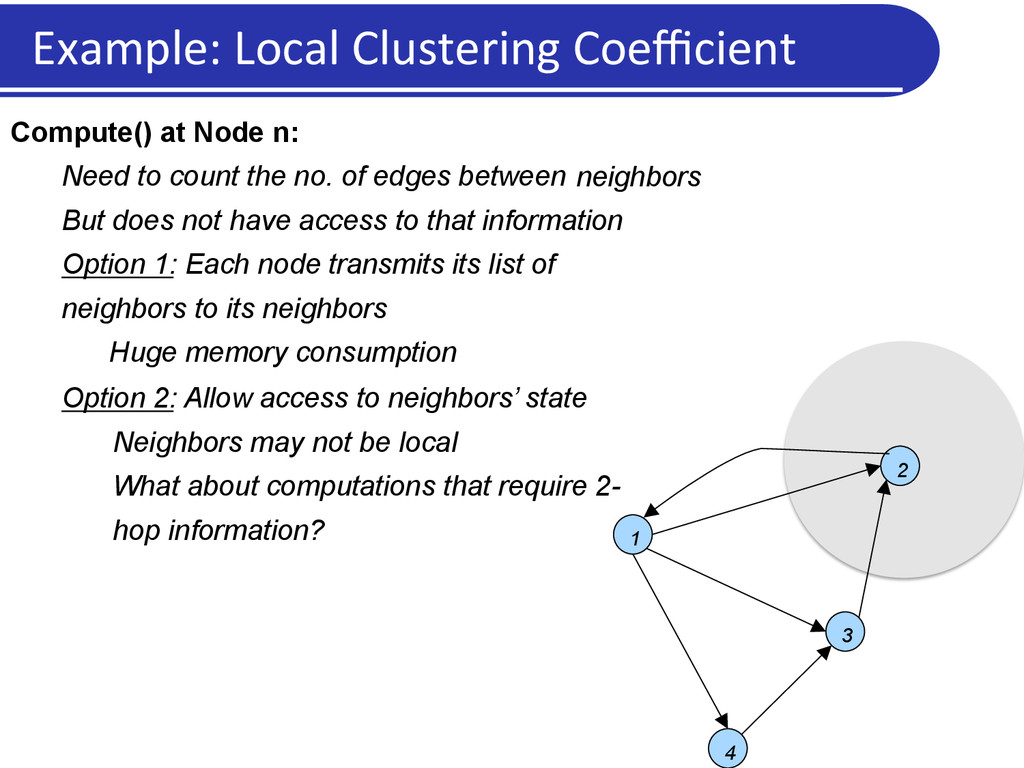
at Node n: Need to count the no. of edges between But does not have access to that information Option 1: Each node transmits its list of neighbors to its neighbors Huge memory consumption Option 2: Allow access to neighbors’ state Neighbors may not be local What about computations that require 2- hop information? neighbors
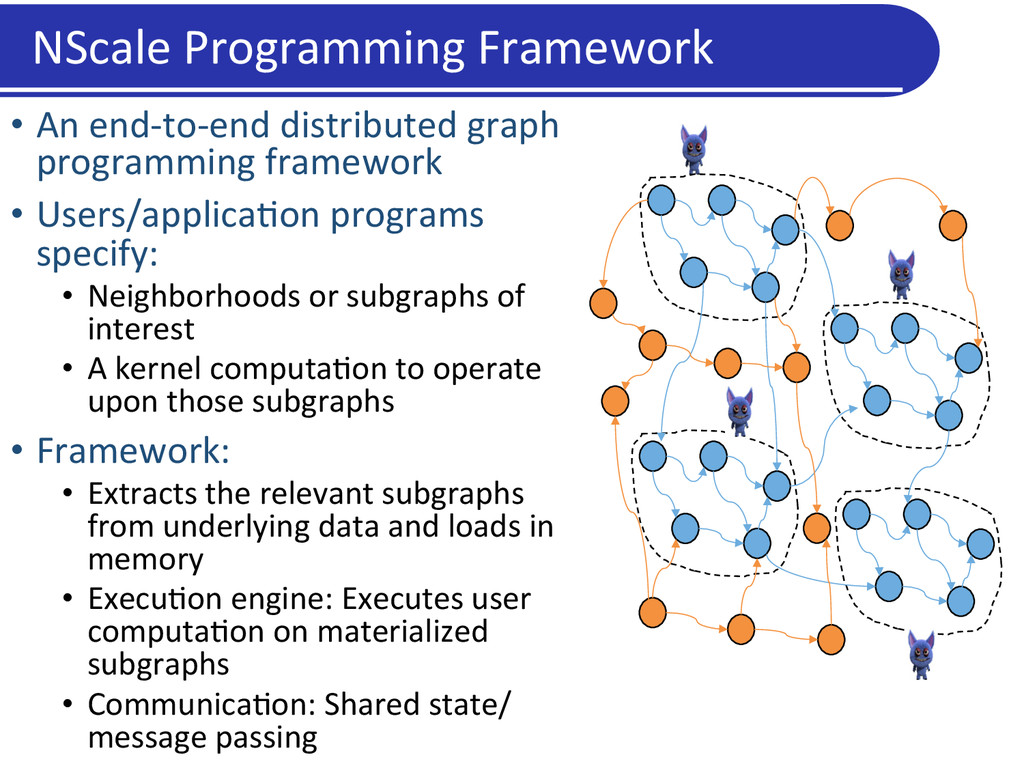
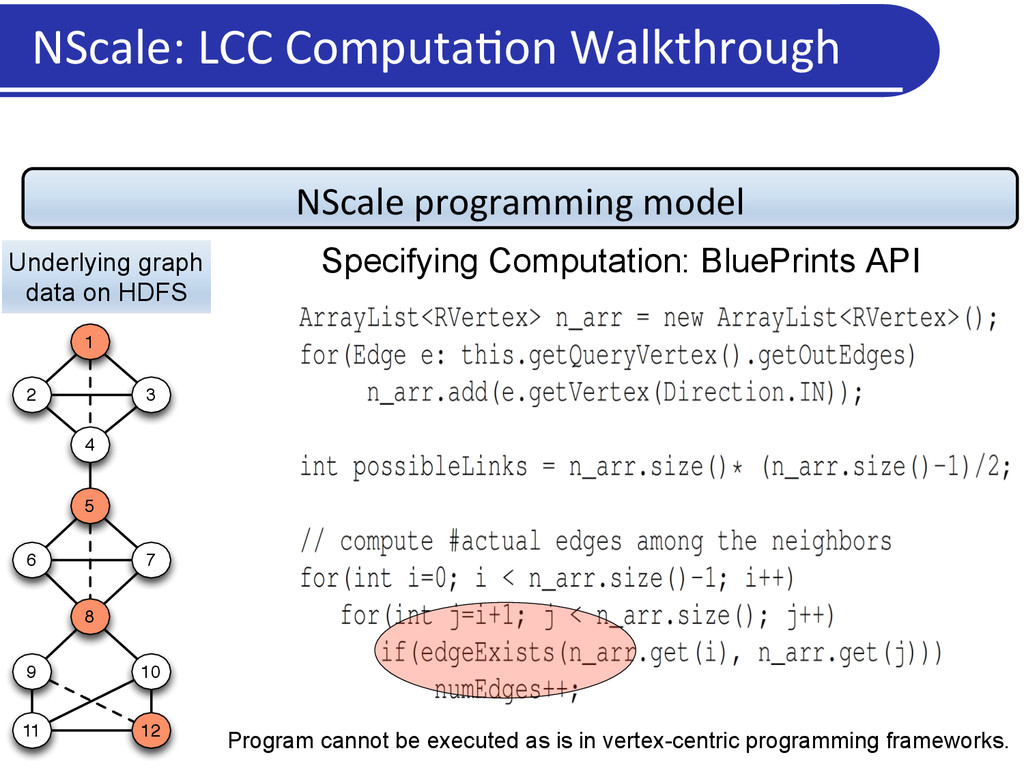
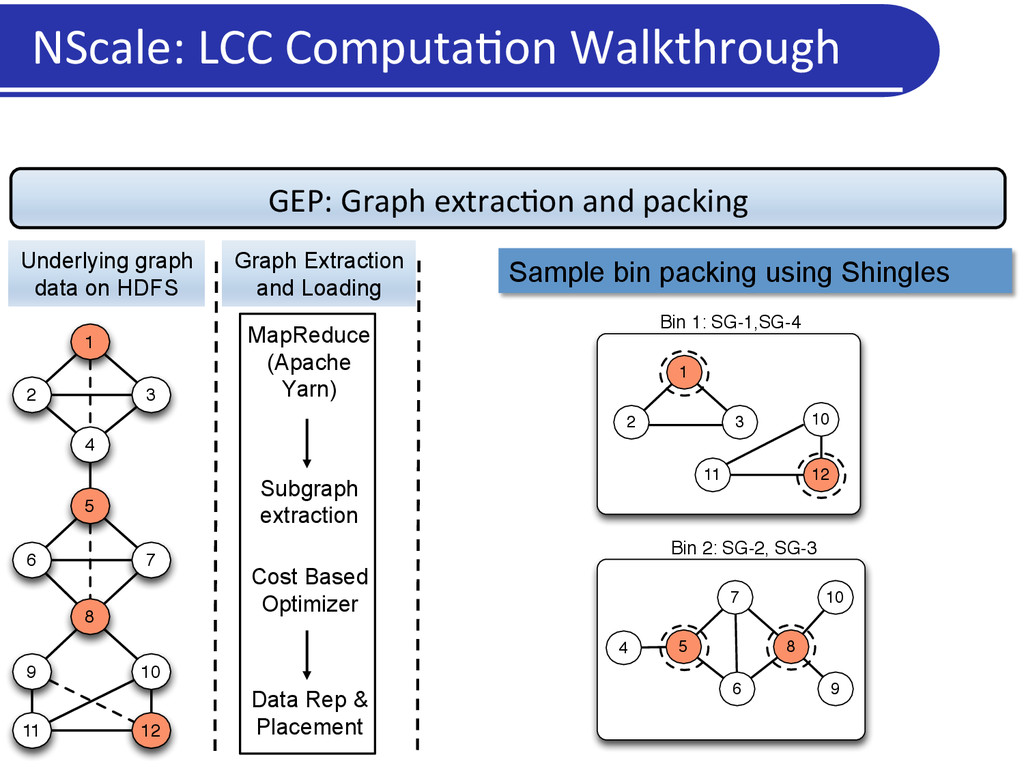
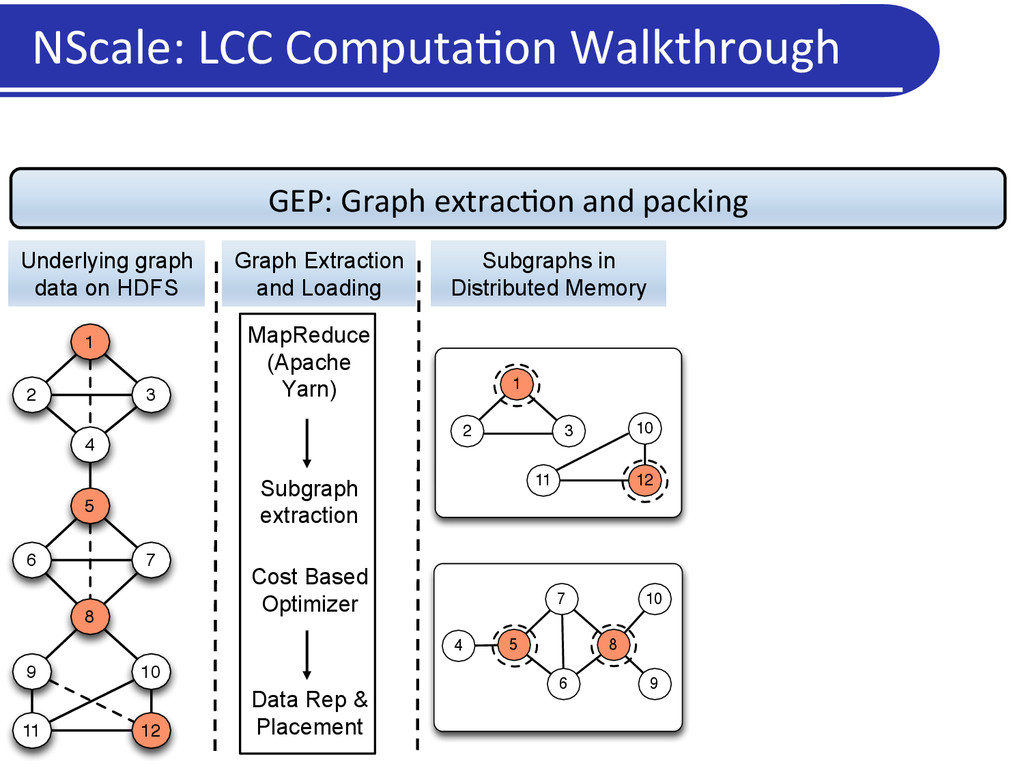
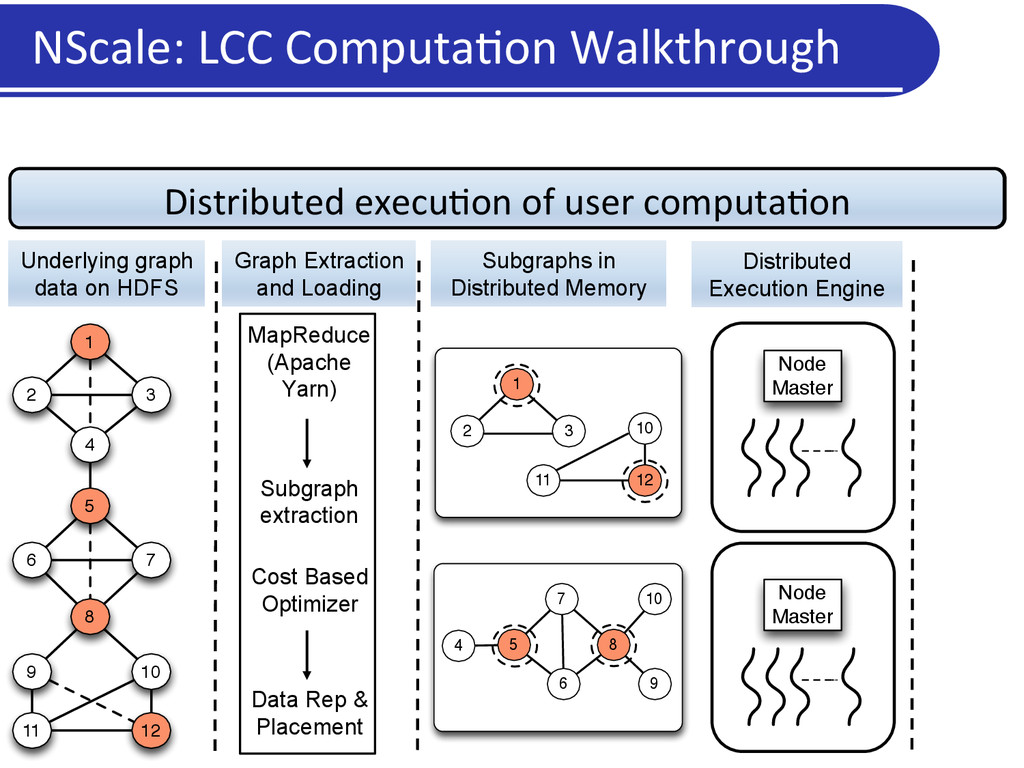
Users/applica5on programs specify: • Neighborhoods or subgraphs of interest • A kernel computa5on to operate upon those subgraphs • Framework: • Extracts the relevant subgraphs from underlying data and loads in memory • Execu5on engine: Executes user computa5on on materialized subgraphs • Communica5on: Shared state/ message passing NScale Programming Framework
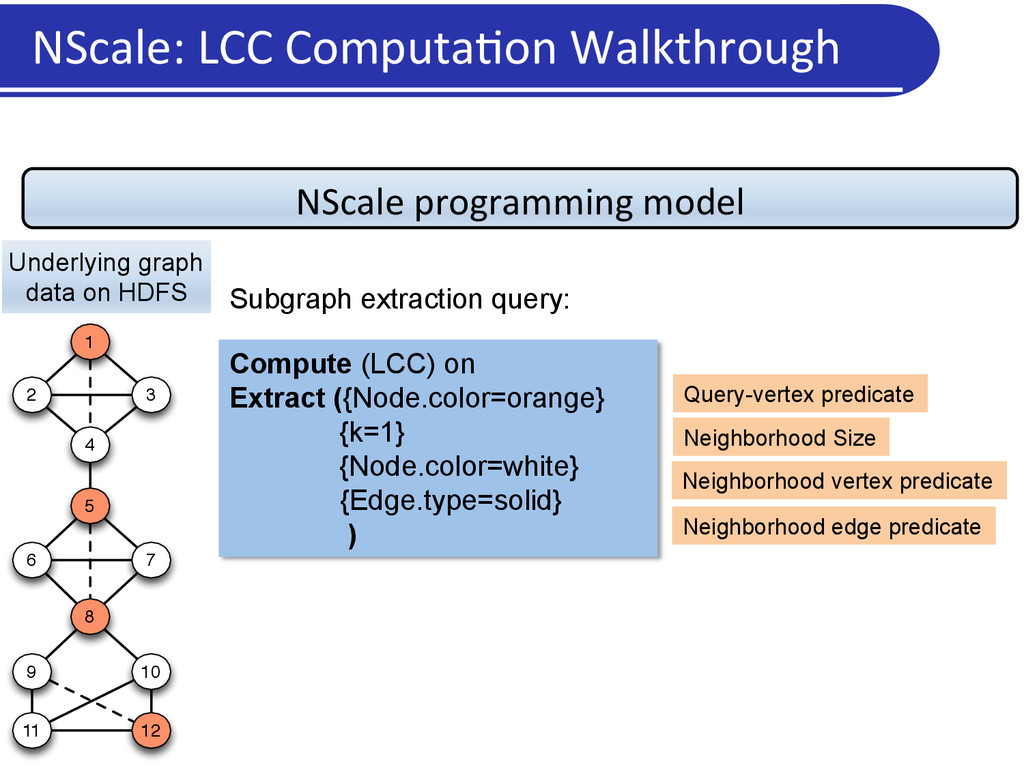
3 4 6 5 7 8 9 10 11 12 Underlying graph data on HDFS Specifying Computation: BluePrints API Program cannot be executed as is in vertex-centric programming frameworks.
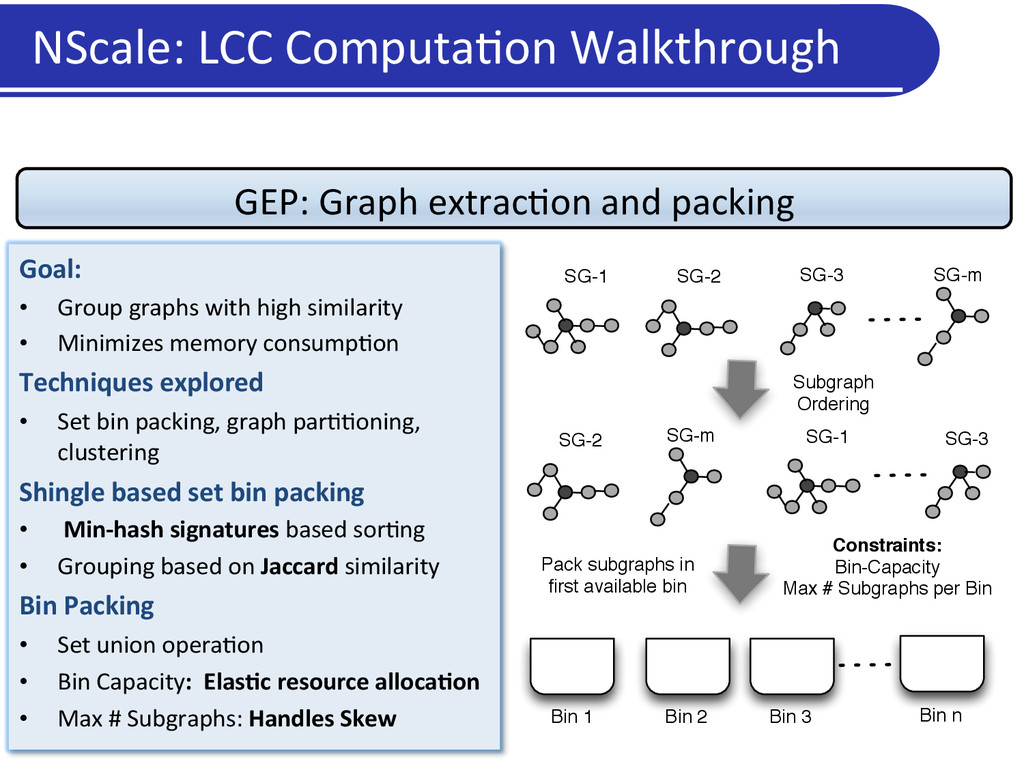
SG-1 SG-2 SG-3 SG-m Bin 1 Bin 2 Bin n Subgraph Ordering Pack subgraphs in first available bin SG-2 SG-m SG-1 SG-3 Constraints: Bin-Capacity Max # Subgraphs per Bin Bin 3 Goal: • Group graphs with high similarity • Minimizes memory consump5on Techniques explored • Set bin packing, graph par55oning, clustering Shingle based set bin packing • Min-‐hash signatures based sor5ng • Grouping based on Jaccard similarity Bin Packing • Set union opera5on • Bin Capacity: ElasDc resource allocaDon • Max # Subgraphs: Handles Skew
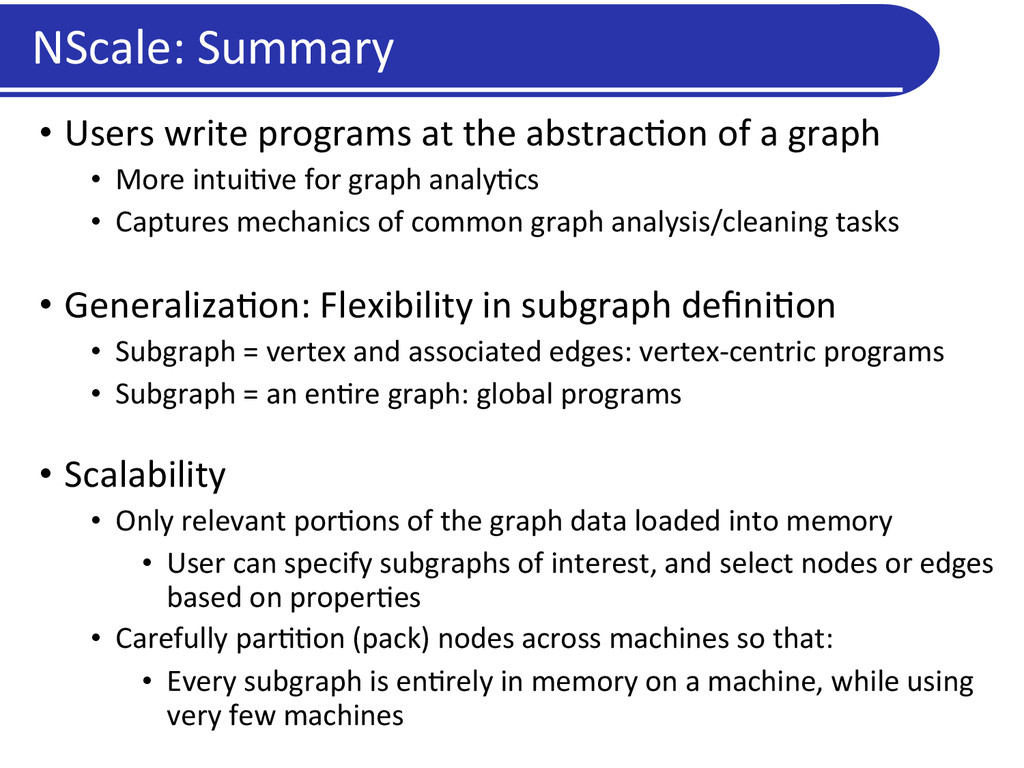
a graph • More intui5ve for graph analy5cs • Captures mechanics of common graph analysis/cleaning tasks • Generaliza5on: Flexibility in subgraph defini5on • Subgraph = vertex and associated edges: vertex-‐centric programs • Subgraph = an en5re graph: global programs • Scalability • Only relevant por5ons of the graph data loaded into memory • User can specify subgraphs of interest, and select nodes or edges based on proper5es • Carefully par55on (pack) nodes across machines so that: • Every subgraph is en5rely in memory on a machine, while using very few machines NScale: Summary
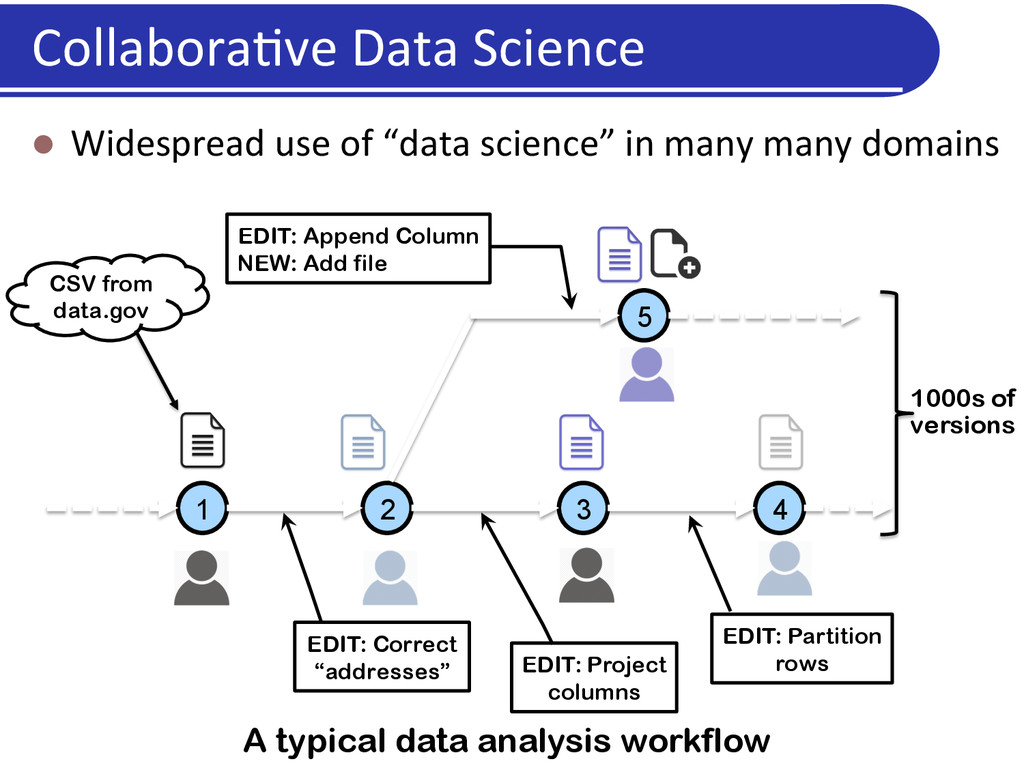
in many many domains 1 2 3 4 5 CSV from data.gov EDIT: Correct “addresses” EDIT: Append Column NEW: Add file EDIT: Project columns EDIT: Partition rows A typical data analysis workflow 1000s of versions
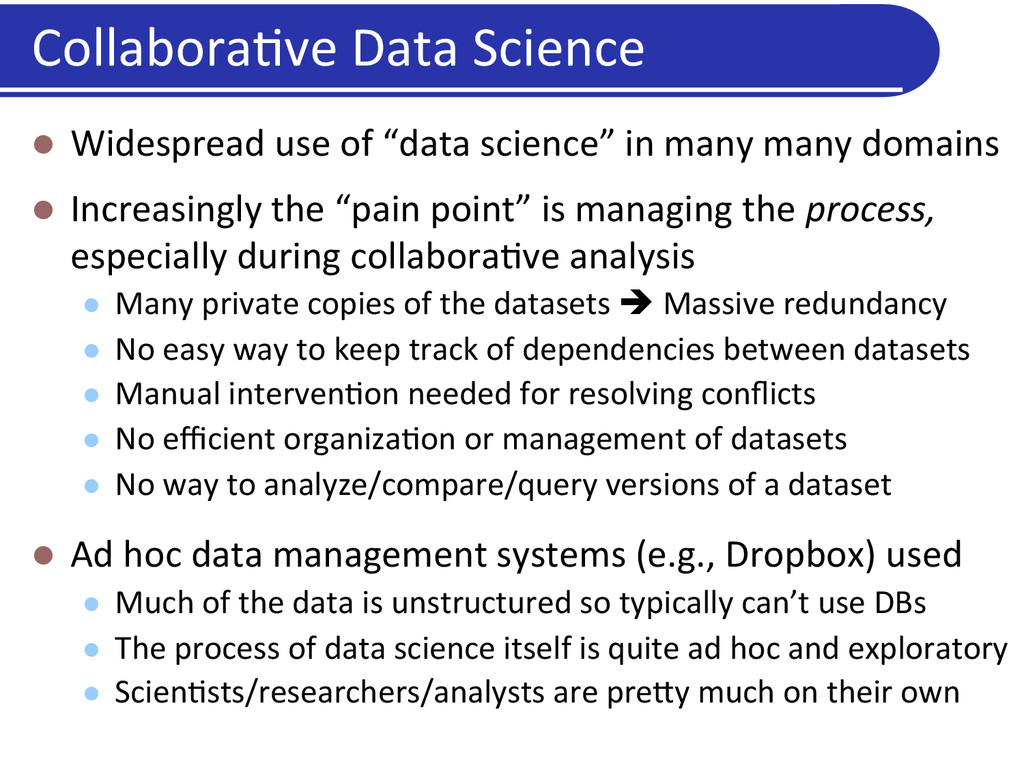
in many many domains l Increasingly the “pain point” is managing the process, especially during collabora5ve analysis l Many private copies of the datasets è Massive redundancy l No easy way to keep track of dependencies between datasets l Manual interven5on needed for resolving conflicts l No efficient organiza5on or management of datasets l No way to analyze/compare/query versions of a dataset l Ad hoc data management systems (e.g., Dropbox) used l Much of the data is unstructured so typically can’t use DBs l The process of data science itself is quite ad hoc and exploratory l Scien5sts/researchers/analysts are pre?y much on their own
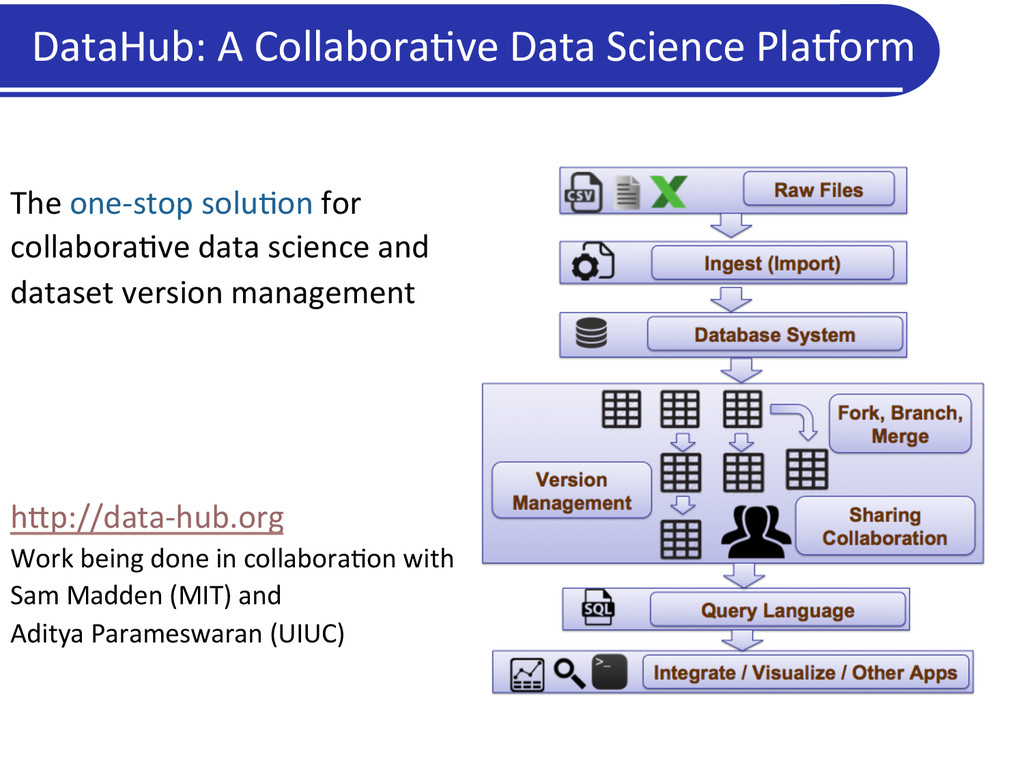
for collabora5ve data science and dataset version management h?p://data-‐hub.org Work being done in collabora5on with Sam Madden (MIT) and Aditya Parameswaran (UIUC)
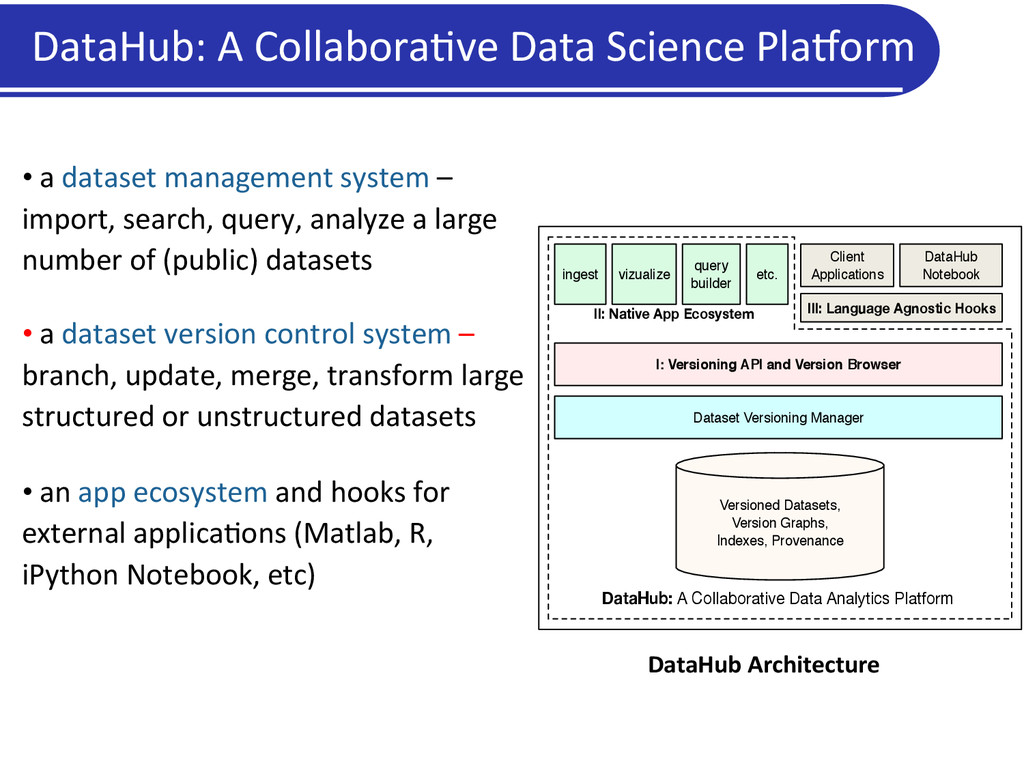
management system – import, search, query, analyze a large number of (public) datasets • a dataset version control system – branch, update, merge, transform large structured or unstructured datasets • an app ecosystem and hooks for external applica5ons (Matlab, R, iPython Notebook, etc) DataHub Architecture Versioned Datasets, Version Graphs, Indexes, Provenance Dataset Versioning Manager I: Versioning API and Version Browser ingest vizualize etc. Client Applications DataHub: A Collaborative Data Analytics Platform II: Native App Ecosystem query builder III: Language Agnostic Hooks DataHub Notebook
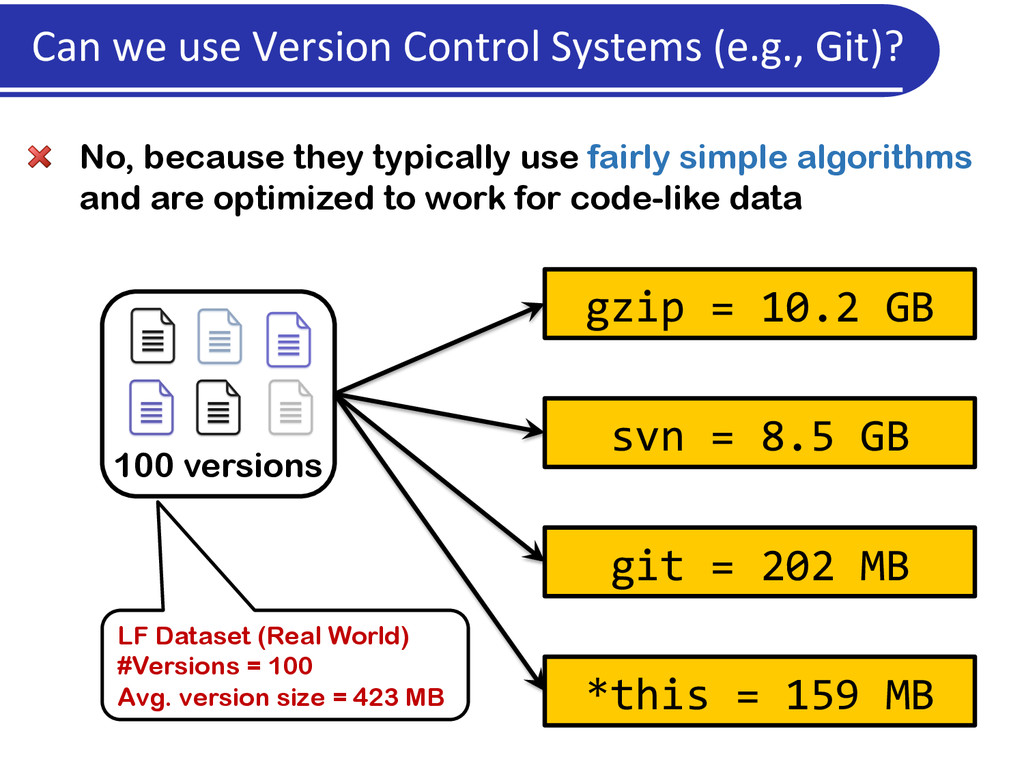
are optimized to work for code-like data 100 versions LF Dataset (Real World) #Versions = 100 Avg. version size = 423 MB gzip = 10.2 GB svn = 8.5 GB git = 202 MB *this = 159 MB Can we use Version Control Systems (e.g., Git)?
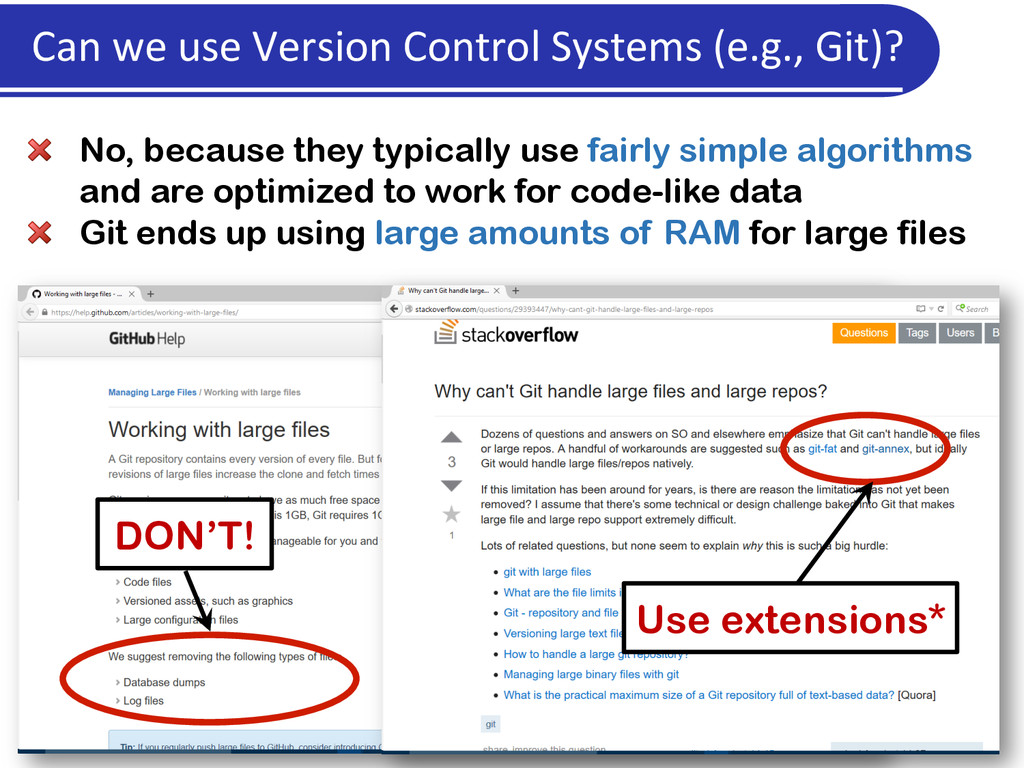
are optimized to work for code-like data Git ends up using large amounts of RAM for large files DON’T! Use extensions* Can we use Version Control Systems (e.g., Git)?
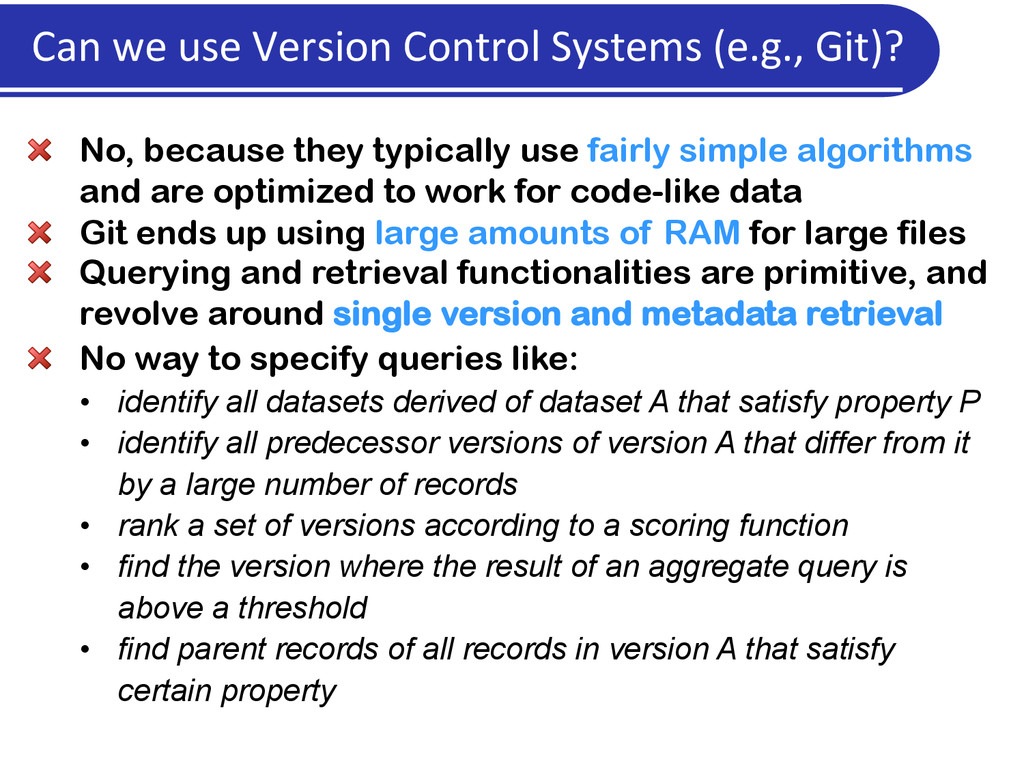
are optimized to work for code-like data Git ends up using large amounts of RAM for large files Querying and retrieval functionalities are primitive, and revolve around single version and metadata retrieval No way to specify queries like: • identify all datasets derived of dataset A that satisfy property P • identify all predecessor versions of version A that differ from it by a large number of records • rank a set of versions according to a scoring function • find the version where the result of an aggregate query is above a threshold • find parent records of all records in version A that satisfy certain property Can we use Version Control Systems (e.g., Git)?
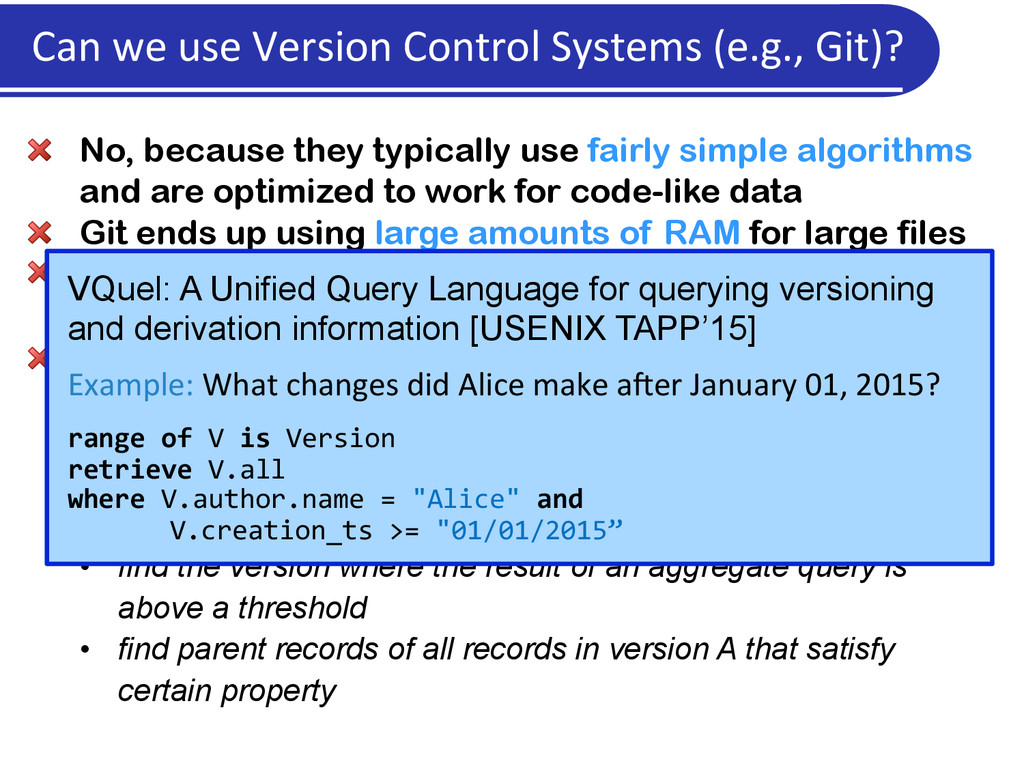
are optimized to work for code-like data Git ends up using large amounts of RAM for large files Querying and retrieval functionalities are primitive, and revolve around single version and metadata retrieval No way to specify queries like: • identify all datasets derived of dataset A that satisfy property P • identify all predecessor versions of version A that differ from it by a large number of records • rank a set of versions according to a scoring function • find the version where the result of an aggregate query is above a threshold • find parent records of all records in version A that satisfy certain property Can we use Version Control Systems (e.g., Git)? VQuel: A Unified Query Language for querying versioning and derivation information [USENIX TAPP’15] Example: What changes did Alice make a[er January 01, 2015? range of V is Version retrieve V.all where V.author.name = "Alice" and V.creation_ts >= "01/01/2015”
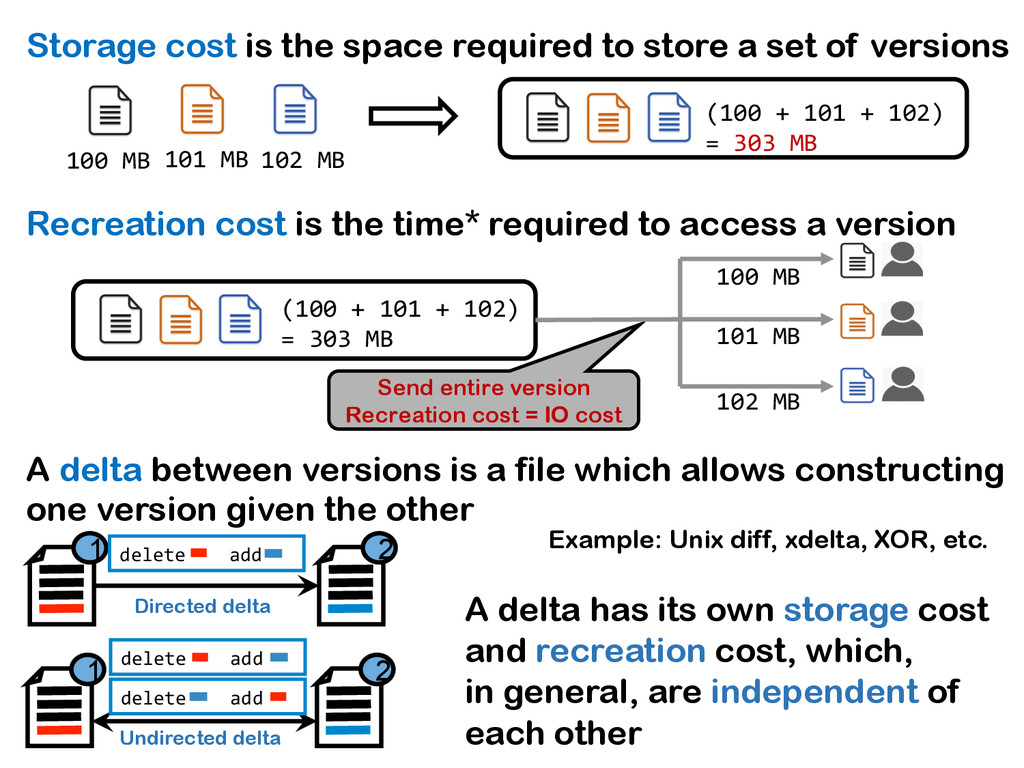
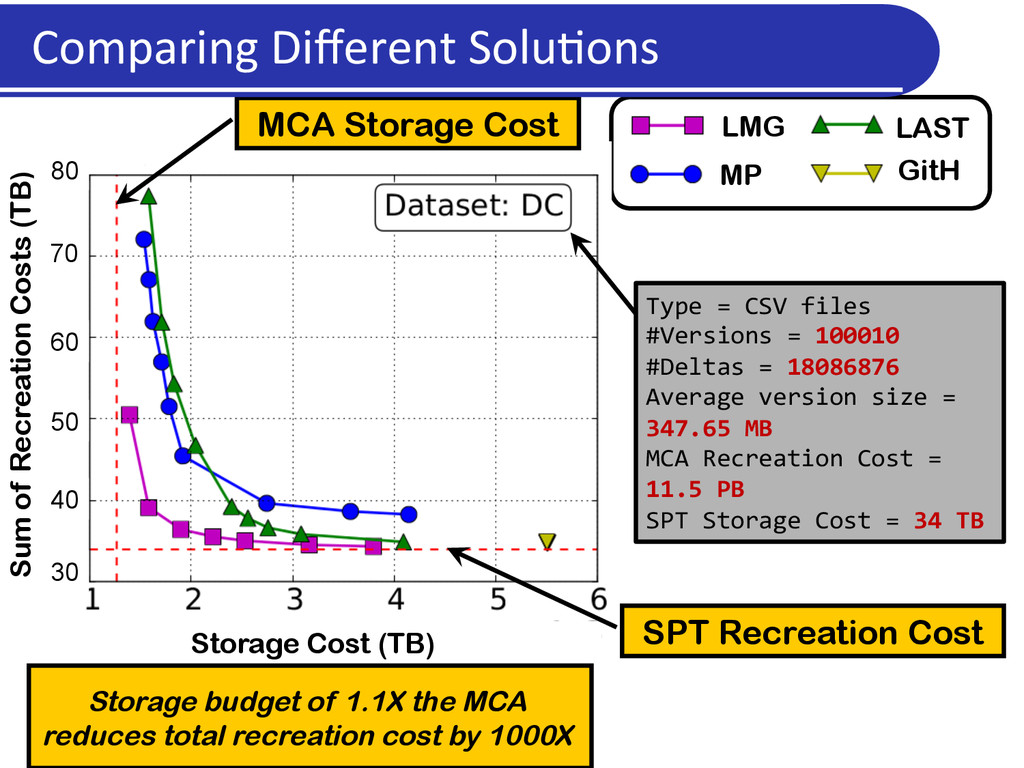
of versions Recreation cost is the time* required to access a version 100 MB 102 MB 101 MB (100 + 101 + 102) = 303 MB Send entire version Recreation cost = IO cost (100 + 101 + 102) = 303 MB 100 MB 101 MB 102 MB A delta between versions is a file which allows constructing one version given the other 1 Directed delta 2 delete add 1 Undirected delta 2 delete add delete add Example: Unix diff, xdelta, XOR, etc. A delta has its own storage cost and recreation cost, which, in general, are independent of each other
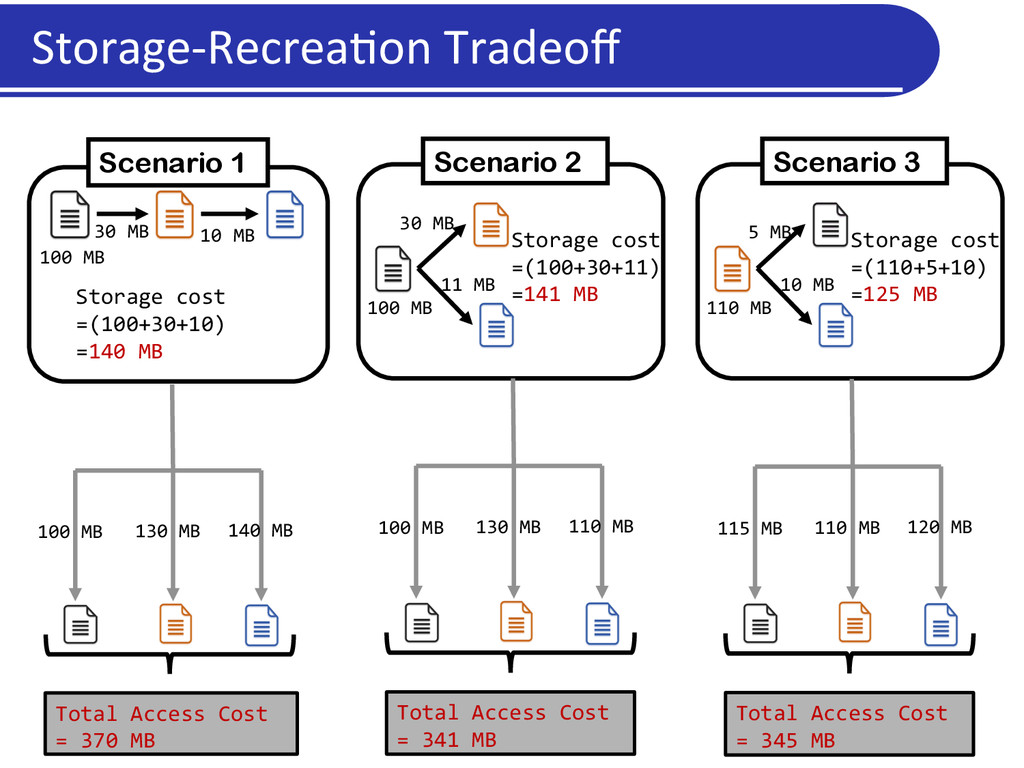
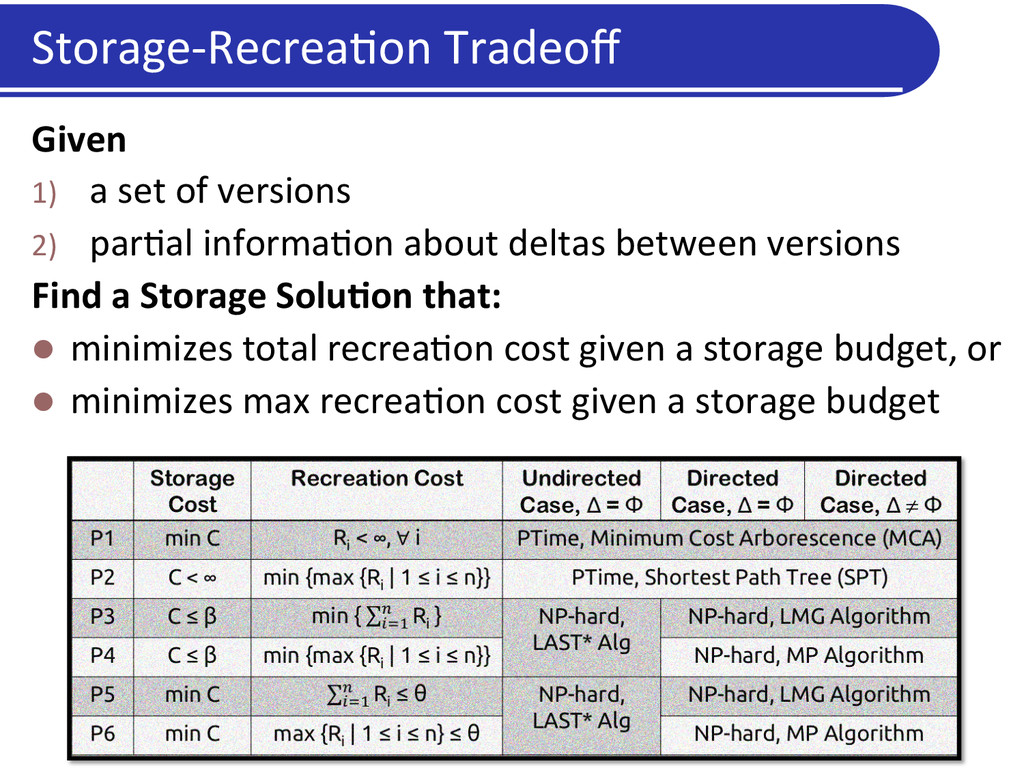
2) par5al informa5on about deltas between versions Find a Storage SoluDon that: l minimizes total recrea5on cost given a storage budget, or l minimizes max recrea5on cost given a storage budget
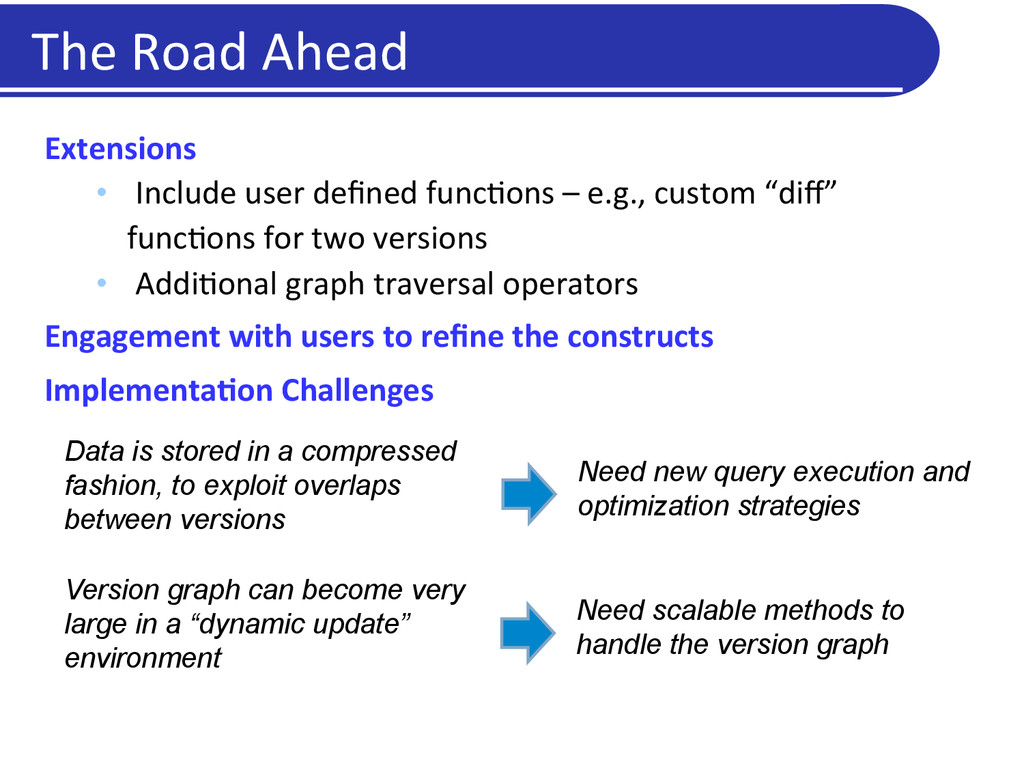
func5ons – e.g., custom “diff” func5ons for two versions • Addi5onal graph traversal operators Engagement with users to refine the constructs ImplementaDon Challenges Data is stored in a compressed fashion, to exploit overlaps between versions Need new query execution and optimization strategies Version graph can become very large in a “dynamic update” environment Need scalable methods to handle the version graph The Road Ahead