Upgrade to Pro — share decks privately, control downloads, hide ads and more …

microfluidics & miniaturization for clinical diagnostics

microfluidics & miniaturization for clinical diagnostics

... talk given at EMBL, Heidelberg. Microfluidics 2012, July 25-27, 2012.

andreas manz

July 25, 2012
Tweet

More Decks by andreas manz

Other Decks in Science

Transcript

  1. Andreas Manz,
    Jörg Ingo Baumbach,
    Pavel Neužil
    KIST Europe, Saarbrücken Germany
    Saarland University, Physics & Mechatronics, Germany
    microfluidics & miniaturization
    for clinical diagnostics

    View Slide

  2. View Slide

  3. microfabrication, 1975/79
    S. Terry et al., Stanford USA

    View Slide

  4. microfabrication, 1975/79
    Steve Terry

    View Slide

  5. phosphate monitor, 1989-92

    View Slide

  6. phosphate monitor, 1989-92

    View Slide

  7. 1989-91
    capillary electrophoresis on chip

    View Slide

  8. 1989-91
    glass devices
    1747
    Newton

    View Slide

  9. 10 fold miniaturization
    100 x faster separation
    1000 x smaller volume
    same separation efficiency

    View Slide

  10. fluorescence [arb. units]
    time [s]
    0 40 80 120 160
    1 2
    3
    4
    5
    6
    cycle #
    7 8
    t 7 s
    synchr.
    fluorescence [arb. units]
    time [s]
    0 40 80 120 160
    1 2
    3
    4
    5
    6
    cycle #
    7 8
    t 7 s
    synchr.
    fluorescence [arb. units]
    time [s]
    0 40 80 120 160
    1 2
    3
    4
    5
    6
    cycle #
    7 8
    t 7 s
    synchr.
    electrophoresis
    FITC labeled amino acids
    D.J.Harrison, K.Flury, K.Seiler, Z.Fan, C.S.Effenhauser, A.Manz, Science 261, 895-897
    (1993)
    C.S.Effenhauser, A.Manz, H.M.Widmer, Anal. Chem. 65, 2637-2642 (1993)

    View Slide

  11. View Slide

  12. double stranded DNA separation

    View Slide

  13. reaction with intercalating dye

    View Slide

  14. publications per month citing
    Agilent 2100 bioanalyzer
    Courtesy of Agilent Waldbronn
    introduced 1999
    more than 8500 instruments sold worldwide
    Gold-Standard for the analysis of RNA

    View Slide

  15. what did I learn from all this?
    100x speed
    100x parallel
    market collapses
    companies will do
    everything to block it

    View Slide

  16. KIST Europe
    Korea Institute for Science and Technology
    Saarbrücken Germany
    technology,
    instrumentation &
    biotech to help
    prevent pandemics

    View Slide

  17. KIST Europe
    Korea Institute for Science and Technology
    Saarbrücken Germany
    technology,
    instrumentation &
    biotech to help
    prevent pandemics

    View Slide

  18. 18
    H7
    H5
    H9*
    1980
    1997
    Recorded new avian influenzas
    1996 2002
    1999
    2003
    1955 1965 1975 1985 1995 2005
    H1N1
    H2N2
    1889
    Russian
    influenza
    H2N2
    H2N2
    1957
    Asian
    influenza
    H2N2
    H3N2
    1968
    Hong Kong
    influenza
    H3N2
    H3N8
    1900
    Old Hong Kong
    influenza
    H3N8
    1918
    Spanish
    influenza
    H1N1
    1915 1925 1955 1965 1975 1985 1995 2005
    1895 1905 2010 2015
    2009
    Pandemic
    influenza
    H1N1
    recorded human pandemic influenza
    (early sub-types inferred)
    Reproduced and adapted (2009) with permission of Dr Masato Tashiro, Director, Center for Influenza Virus Research,
    National Institute of Infectious Diseases (NIID), Japan.
    H1N1
    Pandemic
    H1N1

    View Slide

  19. possible European scenario
    In reality, the initiation phase can be prolonged, especially in the summer months.
    What cannot be determined is when acceleration takes place.
    0%
    5%
    10%
    15%
    20%
    25%
    Apr May Jun Jul Aug Sep Oct Nov Dec Jan Feb Mar
    Month
    Proportion of total cases, consultations, hospitalisations or deaths
    Initiation Acceleration Peak Declining
    Animated slide: Press key
    Apr

    View Slide

  20. 1918/1919 pandemic: A(H1N1)
    influenza deaths, England and Wales
    1918/19: ‘Influenza deaths’, England and Wales.
    The pandemic affected young adults, the very young and
    older age groups.
    0
    2,000
    4,000
    6,000
    8,000
    10,000
    12,000
    14,000
    16,000
    18,000
    27
    29
    31
    33
    35
    37
    39
    41
    43
    45
    47
    49
    51
    2
    4
    6
    8
    10
    12
    14
    16
    18
    1918 1919
    Week no. and year
    Deaths in England and Wales
    Ro
    = 2-3 (US) Mills, Robins, Lipsitch (Nature 2004)
    Ro
    = 1.5-2 (UK) Gani et al (EID 2005)
    Ro
    = 1.5-1.8 (UK) Hall et al (Epidemiol. Infect. 2006)
    Ro
    = 1.5-3.7 (Geneva) Chowell et al (Vaccine 2006)
    Courtesy of the Health Protection Agency, UK
    Transmissibility: estimated Basic Reproductive Number (Ro
    )

    View Slide

  21. estimated additional deaths in Europe if a 1918/19
    pandemic occurred 
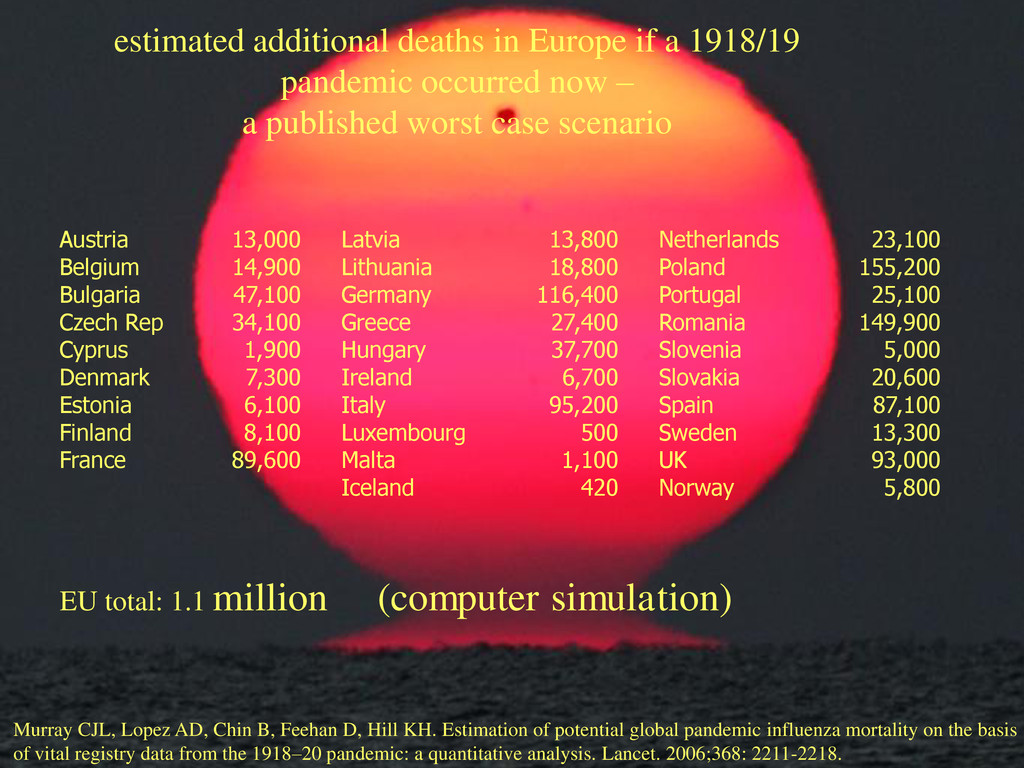
now –
    a published worst case scenario
    Austria 13,000 Latvia 13,800 Netherlands 23,100
    Belgium 14,900 Lithuania 18,800 Poland 155,200
    Bulgaria 47,100 Germany 116,400 Portugal 25,100
    Czech Rep 34,100 Greece 27,400 Romania 149,900
    Cyprus 1, 900 Hungary 37,700 Slovenia 5,000
    Denmark 7,300 Ireland 6,700 Slovakia 20,600
    Estonia 6,100 Italy 95,200 Spain 87,100
    Finland 8,100 Luxembourg 500 Sweden 13,300
    France 89,600 Malta 1,100 UK 93,000
    Iceland 420 Norway 5,800
    EU total: 1.1 million (computer simulation)
    Murray CJL, Lopez AD, Chin B, Feehan D, Hill KH. Estimation of potential global pandemic influenza mortality on the basis
    of vital registry data from the 1918–20 pandemic: a quantitative analysis. Lancet. 2006;368: 2211-2218.

    View Slide

  22. main reason for worse situation today:
    increased population
    increased population density in large cities
    increased mobility (commute, tourism)
    closed air circulation (e.g. offices, airplanes)
    insufficient filtering, insufficient hygiene

    View Slide

  23. possible remedy
    “systems biology like approach”
    measurement, screening
    computer model
    drastic measures to contain pandemic

    View Slide

  24. conventional plating methods

    View Slide

  25. what we would need
    taken from movie
    “I am Legend”

    View Slide

  26. to discuss
    time to activate and use measurements
    time to getting technology & biotech ready
    false negatives
    acceptance in public
    (non invasive would be best)

    View Slide

  27. part 1

    View Slide

  28. breath analysis
    metabolic profiling

    View Slide

  29. fBreath
    (t,x,y,z,analyte,concentration, ….)
    spectrometry

    View Slide

  30. ion mobility spectrometry (IMS)
    entirely reagent free

    View Slide

  31. Peak position
    qualitative
    information
    Peak area
    quantitative
    information
    Ion mobility spectrum of positive ions of acetone
    in air
    information

    View Slide

  32. MCC/IMS

    View Slide

  33. 0
    25
    50
    75
    100
    125
    0
    5
    10
    15
    20
    25
    Tetrachloroethene
    Toluene
    Pyridine
    Trichloroethene
    Butanol
    Ethylmethylketone
    Propanol
    Pentane
    MCC-UV-IMS
    Tetrachloroethene
    Toluene
    Pyridine
    Trichloroethene
    Butanol
    Ethylmethylketone
    Pentane
    Propanol
    Drift Time / ms Retention Time / s
    MCC/IMS

    View Slide

  34. fBreath
    (t,x,y,z,analyte,concentration, ….)
    metabolomics

    View Slide

  35. metabolic map of a patient group

    View Slide

  36. stem cells, head space
    standard nutrition
    background
    hungry
    necrotic

    View Slide

  37. fBreath
    (t,x,y,z,analyte,concentration, ….)
    bacteria

    View Slide

  38. bacteria
    positive mode
    Cooperation with the University Göttingen
    no need to isolate
    microorganism

    View Slide

  39. bacteria
    negative mode
    Cooperation with the University Göttingen

    View Slide

  40. Pseudomonas signals in breath
    0.0
    0.2
    0.4
    0.6
    0.8
    1.0
    0.000 0.005 0.010 0.015 0.020
    Pseudomonas
    Control
    Analyte PS0
    Analyte P_1
    Cooperation with the Ruhrlandklinik Essen
    chronic?
    infectious
    ?

    View Slide

  41. Pseudomonas metabolites in breath
    Cooperation with the Ruhrlandklinik Essen

    View Slide

  42. fBreath
    (t,x,y,z,analyte,concentration, ….)
    lung cancer
    and others

    View Slide

  43. up to 600 different metabolites
    Peak number
    Patient number
    similarities
    differences

    View Slide

  44. breath analysis – lung cancer
    Pilot Study:
    • 36 patients suffering with lung cancer
    • 54 healthy persons in a control group.
    A reduction from more than one million data points per IMS-chromatogram to 25 variables enabled a
    classification and differentiation of these two groups with an error of < 1.3 %.
    S. Bader, J.I. Baumbach et al.
    Science Price 2006
    of the ´Deutsche Gesellschaft für Pneumologie´
    obtained at the 47. Annual Conference in Nürnberg, March 29 - April 1, 2006:
    Ionenbeweglichkeitsspektrometrie bei Bronchialkarzinom und Atemwegsinfektion
    Discriminator
    -10 -5 0 5 10
    Smoking status
    Non-smoker
    Smoker
    No information available
    Non-smoker
    Smoker
    Lung Cancer Control
    Carcinoma in situ

    View Slide

  45. introduction and assessment of anesthesia
    target controlled infusions (TCI)
    calculated based on
    - patient height
    - patient weight
    - patient age
    bispectral index (BIS)
    monitor depth of anesthesia
    - Indicates brain
    activity
    most of the values are not optimal for particular patient

    View Slide

  46. breath analysis – anaesthesia
    0,0 0,5 1,0 1,5 2,0 2,5 3,0 3,5 4,0 4,5
    cPP
    [µg/mL]
    4
    6
    8
    10
    12
    14
    16
    18
    cAP
    [ppb]
    Breath
    Blood
    Cooperation with the University Göttingen
    propofol

    View Slide

  47. breath analysis - anesthetic propofol
    0 10 20 30 40
    0.00
    0.01
    0.02
    Peak intensity (V)
    Time (min)
    MCC/IMS breath analysis from anesthetized patient over time
    0 10 20 30 40 50
    0
    1
    2
    3
    4
    Plasma concentration (µg/mL)
    Time (min)
    calculated plasma value
    target 4 µg/ml target 2 µg/ml
    propofol in breath

    View Slide

  48. MCC/IMS breath analysis from anesthetized patient over time
    BIS 19
    BIS 33
    BIS 62
    Propofol in breath corresponds to the BIS value
    breath analysis - anesthetic propofol

    View Slide

  49. Online monitoring of anesthesia
    Result: Plasma conc. Vs. End tidal conc. (peak intensity)
    end tidal concentration (a.u.)
    dosage: propofol TCI plasma (µg/ml)
    0,0
    5,0
    10,0
    15,0
    20,0
    25,0
    30,0
    0,0 0,5 1,0 1,5 2,0 2,5 3,0 3,5 4,0 4,5
    C
    B
    A
    D
    E
    F
    G
    H
    „theranostics“- anesthetic propofol
    wake up
    go sleep
    maintain

    View Slide

  50. part 2

    View Slide

  51. View Slide

  52. virtual reaction chamber
    key properties
    – water-based sample
    encapsulated by oil
    – (RT) PCR conducted on a
    glass cover slip
    – micromachined heater/sensor
    are separated from the sample
    – cover slip is disposable
    – small sample volume makes
    system very fast
    PCR
    Sample
    Oi
    l
    B
    mirror
    reflection

    View Slide

  53. VRC details
    key properties
    – VRC with glass placed on a
    micromachined silicon
    – heater integrated with
    temperature sensor
    – heating rate: thermal mass,
    available power with PID
    control
    – cooling rate: t (thermal time
    constant)
    LENGTH
    HEATER
    LINK
    SENSOR
    T
    G
    P
    G
    H


     ;
    t

    View Slide

  54. how fast can the heater be?
    B
    A
    200 nL sample covered with 600 nL of oil. The heater is not well thermally
    isolated making cooling of the VRC faster.
    T
    G
    P
    G
    H


     ;
    t

    View Slide

  55. avian influenza virus detection by RT-PCR
    key properties
    • SYBR-green real-time RT-PCR
    • melting curve analysis
    • 8 minutes for RNA detection
    0 2 4 6 8 10 12 14
    0.0
    0.2
    0.4
    0.6
    0.8
    1.0
    -3
    -2
    -1
    0
    1
    2
    Fluorescence (V)
    Time (min)
    105 copies in 10 L MC
    Virus Detected
    Hot Start
    RT
    Temperature (V)
    PCR
    0 10 20 30 40
    0
    50
    100
    150
    10-4
    10-3
    10-2
    Fluorescence (mV)
    Cycle Number
    Differential Fluorescence (V/cycle)
    Critical Threshold 22.3
    0 2 4 6 8 10 12
    0.0
    0.3
    0.6
    -5
    -4
    -3
    -2
    -1
    0
    1
    2
    Fluorescence (V)
    Time (min)
    Virus Detected
    Hot Start
    RT
    Temperature (V)
    PCR

    View Slide

  56. current development
    • cost below 200 USD per unit
    • four samples a time, i.e. positive and negative control
    plus two samples
    • USB enabled
    • simple display
    • powered by 12V battery

    View Slide

  57. palm-sized PCR

    View Slide

  58. 1) disruption of spores by superheating for
    fast DNA extraction
    2) protein and peptide decomposition by
    superheating
    58
    sample preparation

    View Slide

  59. superheating
    solvent is at a temperature higher than boiling point
    without boiling!
    experiment
    no boiling of aqueous solutions at
    240 °C for more than 30 min!!!
    limited by thermal decomposition of surrounding oil
    temperature x exposure time =
    applied energy
    59
    PCR
    Sample
    Oi
    l
    B
    mirror
    reflection

    View Slide

  60. Bacillus spore disruption by superheating
    spores of bacteria are highly
    resistance against:
    - dryness
    - toxic substances
    - other aggressive
    substances
    - aging
    - heat: dry: 150 °C ca. 1 h
    boiling: ca. 5 h
    60
    electron microscope cross-section of a spore of Bacillus
    subtilis, showing the cortex and coat layers surrounding the
    core (dark central area). spore is 1.2 µm across. (Picture: S.
    Pankratz, Berkeley University of California)

    View Slide

  61. B. subtilis sporulation
    microscope image of Bacillus subtilis cells and spores after
    contrast staining (spores: blue, cells: green)
    61
    Zeiss Axiotron 2, 1500 magnification

    View Slide

  62. B. subtilis purified spores
    microscope image of Bacillus subtilis spores after
    contrast staining (spores: blue)
    62
    Zeiss Axiotron 2, 1500 magnification

    View Slide

  63. B. subtilis purified spores after
    SUPERHEATING
    microscope image of Bacillus subtilis spores after
    contrast staining (spores: blue)
    63
    Zeiss Axiotron 2, 1500 magnification

    View Slide

  64. spore disruption
    destruction of spores by superheating
    64
    0 5 10 15 20 25 30 35 40
    10-2
    10-1
    100
    101
    Fluorescence intensity
    Cycle Number
    positive control
    negative control
    spore solution
    spores after pretreatment
    spores after superheating

    View Slide

  65. 65
    protein- and peptide-
    decomposition by superheating
    for peptide mass fingerprinting

    View Slide

  66. mass spectrometric protein identification:
    state-of-art
    up to now: MS-grade trypsin digestion (Promega): expensive and time
    consuming  about 100 € per 100 µg!
    up to 5 € per experiment!
    66

    View Slide

  67. 67
    mass spectrometric protein identification:
    state-of-art
    peptide pattern (masses!) specific for the digested protein -> identification

    View Slide

  68. MALDI TOF mass spectrometry
    68

    View Slide

  69. 699.0 1361.8 2024.6 2687.4 3350.2 4013.0
    Mass (m/z)
    3246.7
    0
    10
    20
    30
    40
    50
    60
    70
    80
    90
    100
    % Intensity
    1230.6394
    1100.5487
    2515.1196
    1369.7378
    852.4741
    790.3886
    2711.2883
    1665.9083
    2451.0972
    1886.8596
    2151.0325
    918.5013
    2040.9810
    1089.5344
    1960.0337
    1558.7766
    953.4868
    1038.5365
    2060.9817
    2636.2397
    2840.3665
    1199.6136
    1689.8890
    1918.8551
    1103.5511
    1519.7914
    2212.9788
    842.5106
    1302.6404
    2456.1160
    1794.8060
    1849.9048
    1356.6586
    2133.0422
    1723.8525
    2529.1252
    712.3416
    2971.3765
    804.3983
    3112.5217
    2725.2981
    2167.0552
    1234.6450
    1623.8132
    1419.7062
    1974.0247
    2045.9821
    883.4579
    2388.1460
    2287.0447
    1555.7543
    3015.3503
    2653.2954
    956.4841
    1020.5149
    1760.8679
    2083.0049
    759.4001
    3348.6680
    921.5129
    1186.6179
    1145.5305
    2253.1111
    2908.2954
    MALDI example spectrum
    •each peak is a compound
    •each protein gives a different peptide pattern
    69

    View Slide

  70. • adrenocorticotropic hormone (fragment 1-24)
    • molecular weight 2933.44 Da
    • ACTH is a biomarker for cellular stress, infections,
    cancer (metastases!), activates G proteins…
    70
    start with “easy” samples: ACTH

    View Slide

  71. 71
    49.0 640.8 1232.6 1824.4 2416.2 3008.0
    Mass (m/z)
    2628.2
    10
    20
    30
    40
    50
    60
    70
    80
    90
    100
    % Intensity
    2932.645
    1467.313
    49.0 640.8 1232.6 1824.4 2416.2 3008.0
    Mass (m/z)
    5354.2
    10
    20
    30
    40
    50
    60
    70
    80
    90
    100
    % Intensity
    2932.6687
    1467.3292
    360.343
    2724.5750
    1475.3208
    978.5501
    213.122
    2885.6414
    1635.0529
    49.0 640.8 1232.6 1824.4 2416.2 3008.0
    Mass (m/z)
    2.0E+4
    10
    20
    30
    40
    50
    60
    70
    80
    90
    100
    % Intensity
    2932.6814
    1467.3354
    2915.7068
    2724.5742
    1635.0637
    379.0871
    71.3642
    2835.6299
    978.8941
    2884.6804
    2682.5625
    1363.2769
    1539.3729
    1498.2889
    1691.1270
    No heating
    Superheating to 130 °C for
    10 s
    Superheating to 130 °C for
    20 s
    peptide decomposition by superheating

    View Slide

  72. part 3

    View Slide

  73. RNA extraction chip
    Electrophoresis
    electrodes
    Lysis electrode
    Gel
    Cell sample
    RNA
    P.Vulto, et al., Lab Chip, 11, 1596-1602 (2011)

    View Slide

  74. RNA extraction chip
    Bubble-expulsion
    structures
    Phaseguides
    Dry film resist
    fabrication

    View Slide

  75. Phaseguides principle
    Capillary pressure bariers for liquid guidance
    Top-view
    P. Vulto, et al., J. Micromech. Microeng., 16, 2006
    x
    y

    View Slide

  76. Butterfly 180° rotation
    Filling any geometry
    P. Vulto, et al., accepted for Lab Chip

    View Slide

  77. Phaseguides

    View Slide

  78. View Slide

  79. Precise gel patterning
    Nutrient & gas perfusion
    No physical barrier
    Co-culturing
    Gradients & stimuli
    Organotypic cell cultures for drug efficacy and toxicity
    screening
    Cells in matrix
    Perfusion
    Perfusion

    View Slide

  80. Microtiter plate format
    Superior imaging
    Controlled gas flux
    Cheap and disposable
    Compatible with standard
    robots & readout stations
    384 pitch

    View Slide

  81. other activities
    high voltage electrophoresis
    cyclic electrofocusing
    biomimetic microfabrication
    Human Document project

    View Slide

  82. „the human document project“
    workshop, Stanford, September 12-13, 2012
    (chair: Steve Quake, www.humandocument.org)
    to preserve one document about mankind
    for one million years

    View Slide

  83. acknowledgement
    Matthias Altmeyer, PhD
    Mark Tarn, PhD
    Sasidhar Maddula, PhD
    Kathrin Rupp
    Anne-Cristin Hauschild
    Adam Pribylka
    Per Arvid Lothman
    Vanessa Almeida
    Zeynep Meric
    Sung Eun Choi
    Dong Sik Han
    Younggeun Jo
    Jukyung Park
    Juergen Pipper, IBN Singapore
    Lukas Novak, CTU, Prague
    Julien Reboud, IME Singapore
    Paul Vulto, IMTEK Freiburg
    Susann Podszun, IMTEK
    Philipp Meyer, IMTEK
    Carsten Hermann, IMTEK
    Gerald Urban, Prof. IMTEK

    View Slide